
Economic indicators play a pivotal role in understanding the health and performance of the U.S. economy. They are essential tools for policymakers, advisors, investors, and businesses as they enable informed decision-making and significantly influence business strategies and financial markets. In the week ending on October 19, the SPDR S&P 500 ETF Trust (SPY) fell 1.67% while the Invesco S&P 500 Equal Weight ETF (RSP) was down 1.32%.
In this article, we look at three closely watched indicators from the past week — retail sales, industrial production, and the Conference Board’s Leading Economic Index (LEI). These indicators might seem unrelated at first glance. Yet they are interconnected in their role in assessing economic health and predicting economic trends. Retail sales and industrial production are among the four recession-determining indicators recognized by the National Bureau of Economic Research (NBER). Furthermore, the LEI serves as a forward-looking indicator, offering insights into whether the economy is headed toward expansion or recession. Since the end of last year, concerns of an impending recession have loomed large, though it has not materialized. These indicators, among others, will continue to be central to the ongoing discussion.
Economic Indicators: Retail Sales
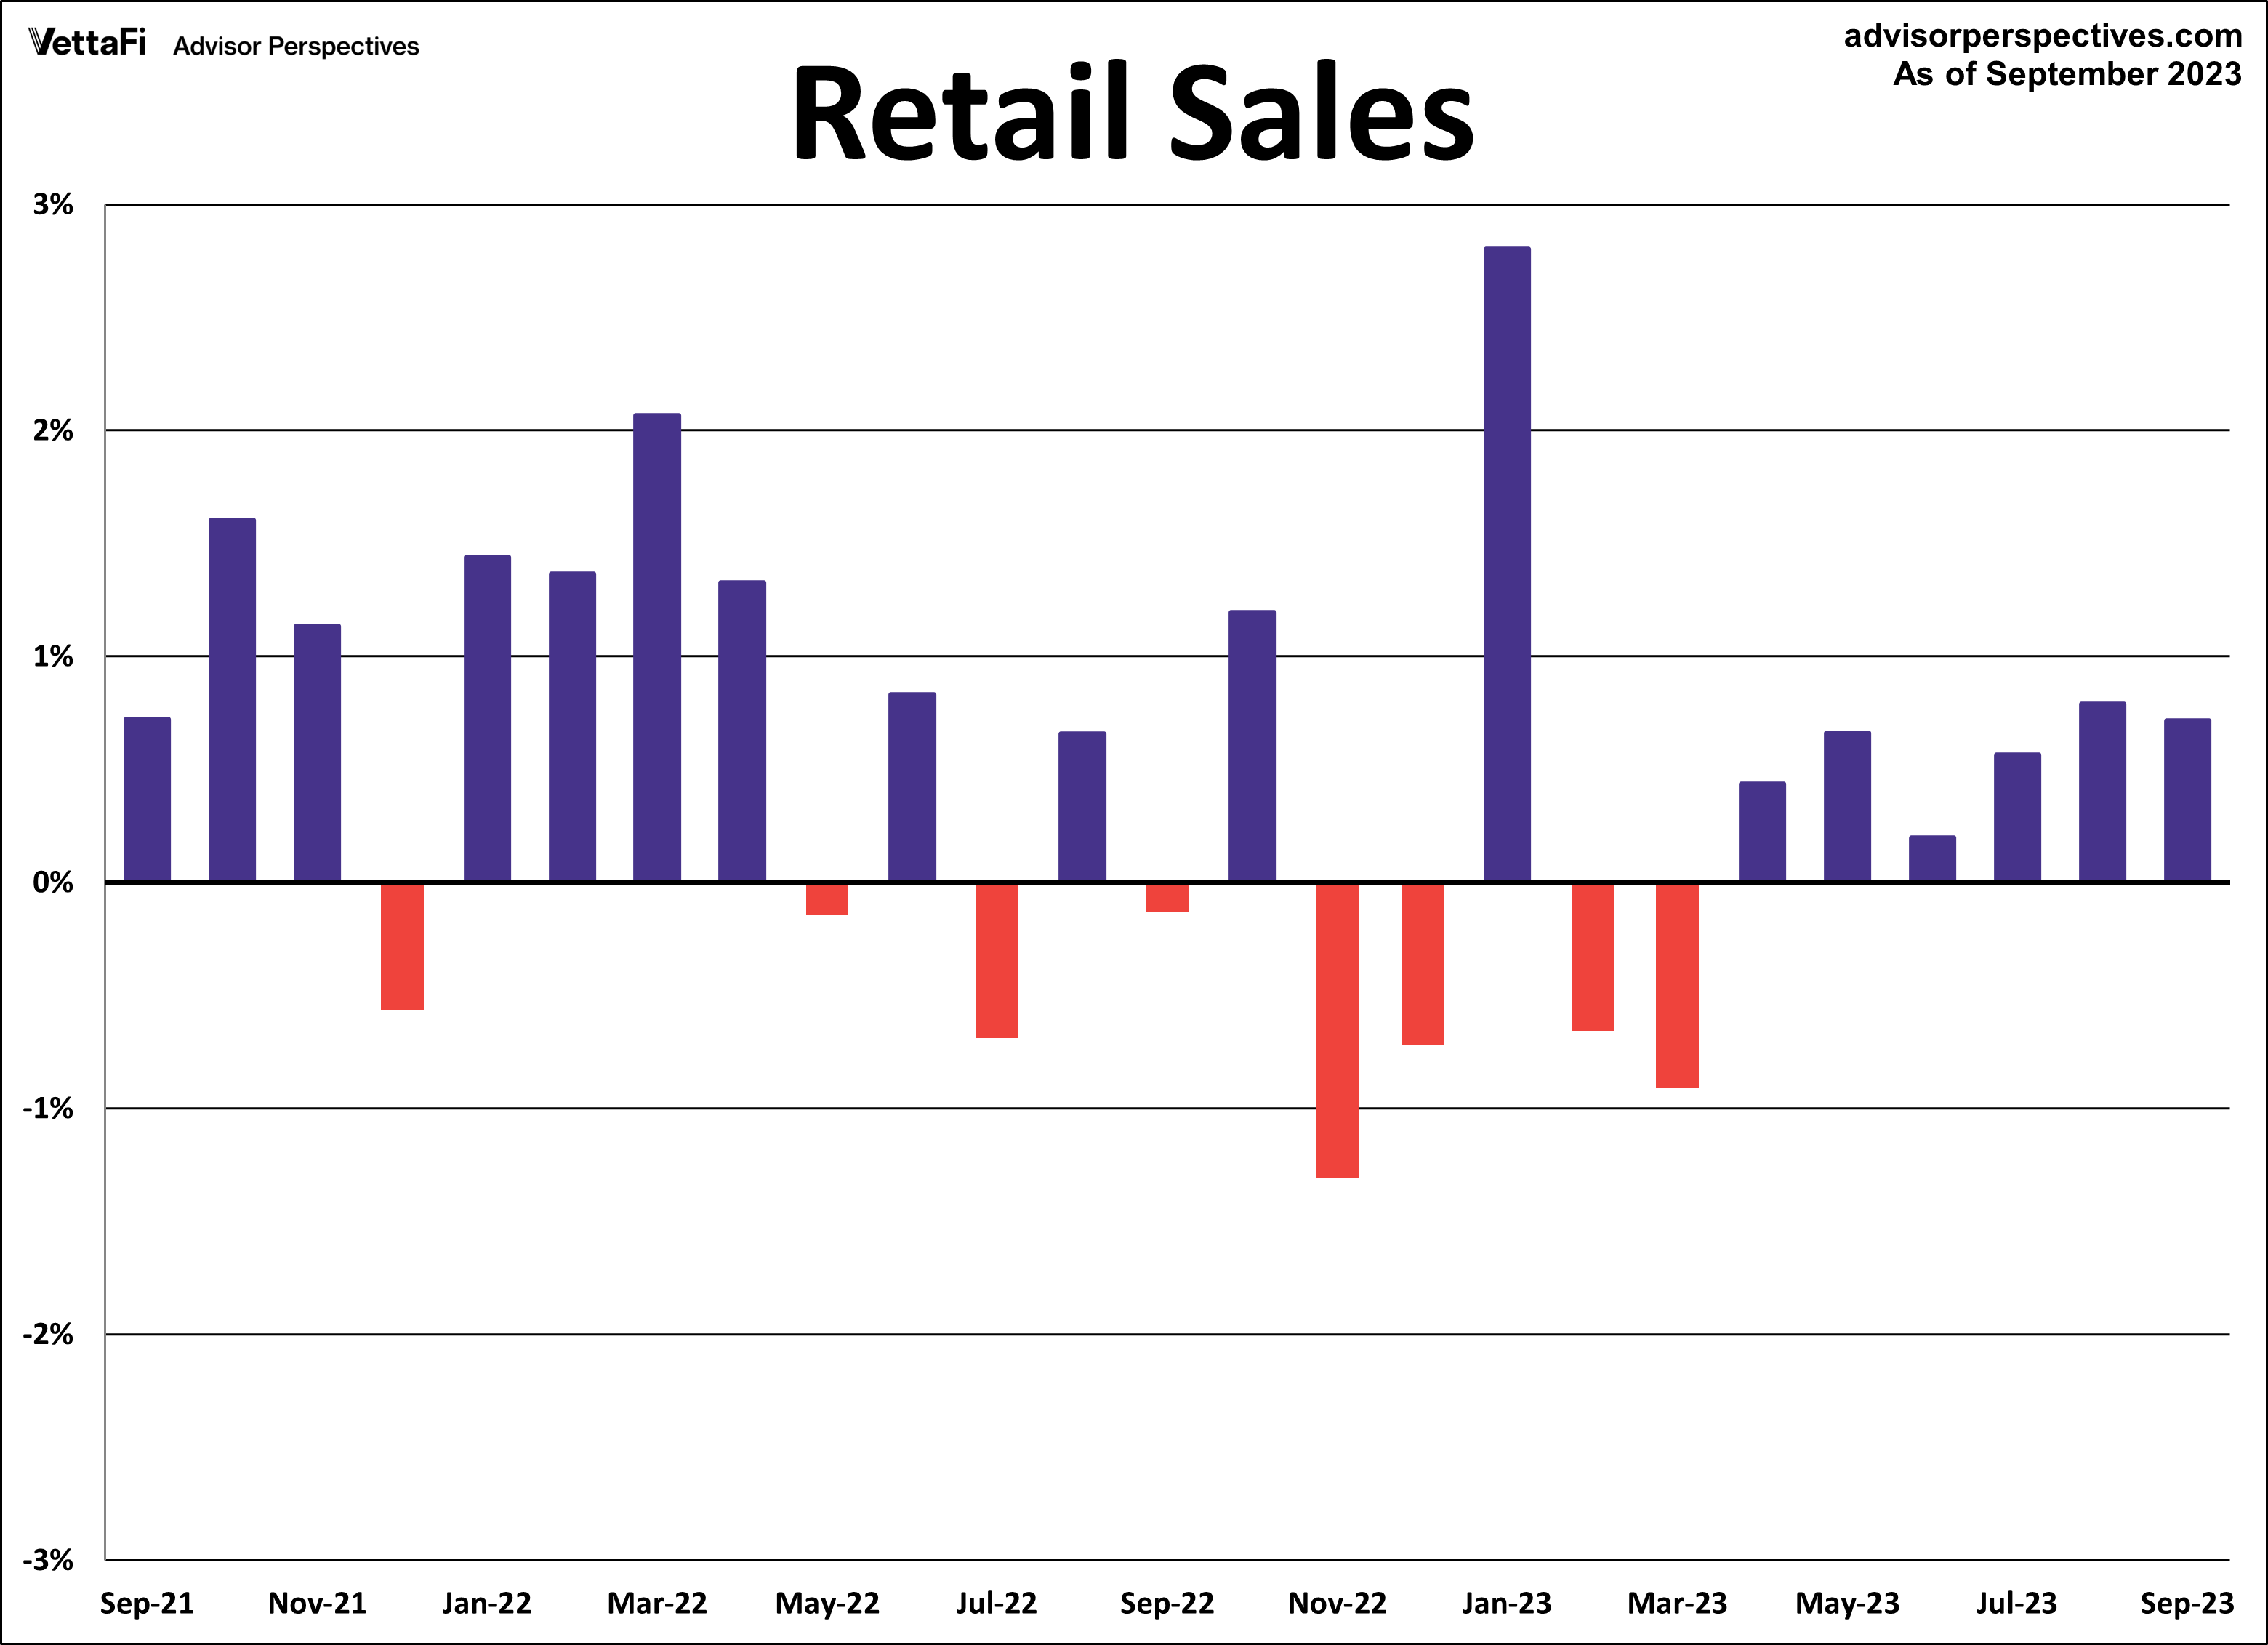
American consumers continue to spend money, despite numerous factors working against them. In the face of high interest rates, elevated inflation, high gas prices, dwindling savings, and the resumption of student loan payments, consumers remain resilient. This is evidenced by six straight months of increased spending. Retail sales increased 0.7% in September, more than doubling the expected 0.3% growth. Core retail sales (excluding automobiles) were up 0.6% from the previous month. This exceeded expectations of 0.2% growth.
Lastly, control purchases, which is thought to be an even more “core” view of retail sales, were up 0.6% from last month. That beat expectations of 0.1% growth. This series typically does not garner as much attention as the headline and core figures. But control purchases are a more consistent and reliable reading of the economy. Despite consumers fueling the economy for most of the year, challenges loom ahead, and a potential dip in spending could be on the horizon.
Retail sales will have an impact on the interest in the SPDR S&P Retail ETF (XRT).
Industrial Production
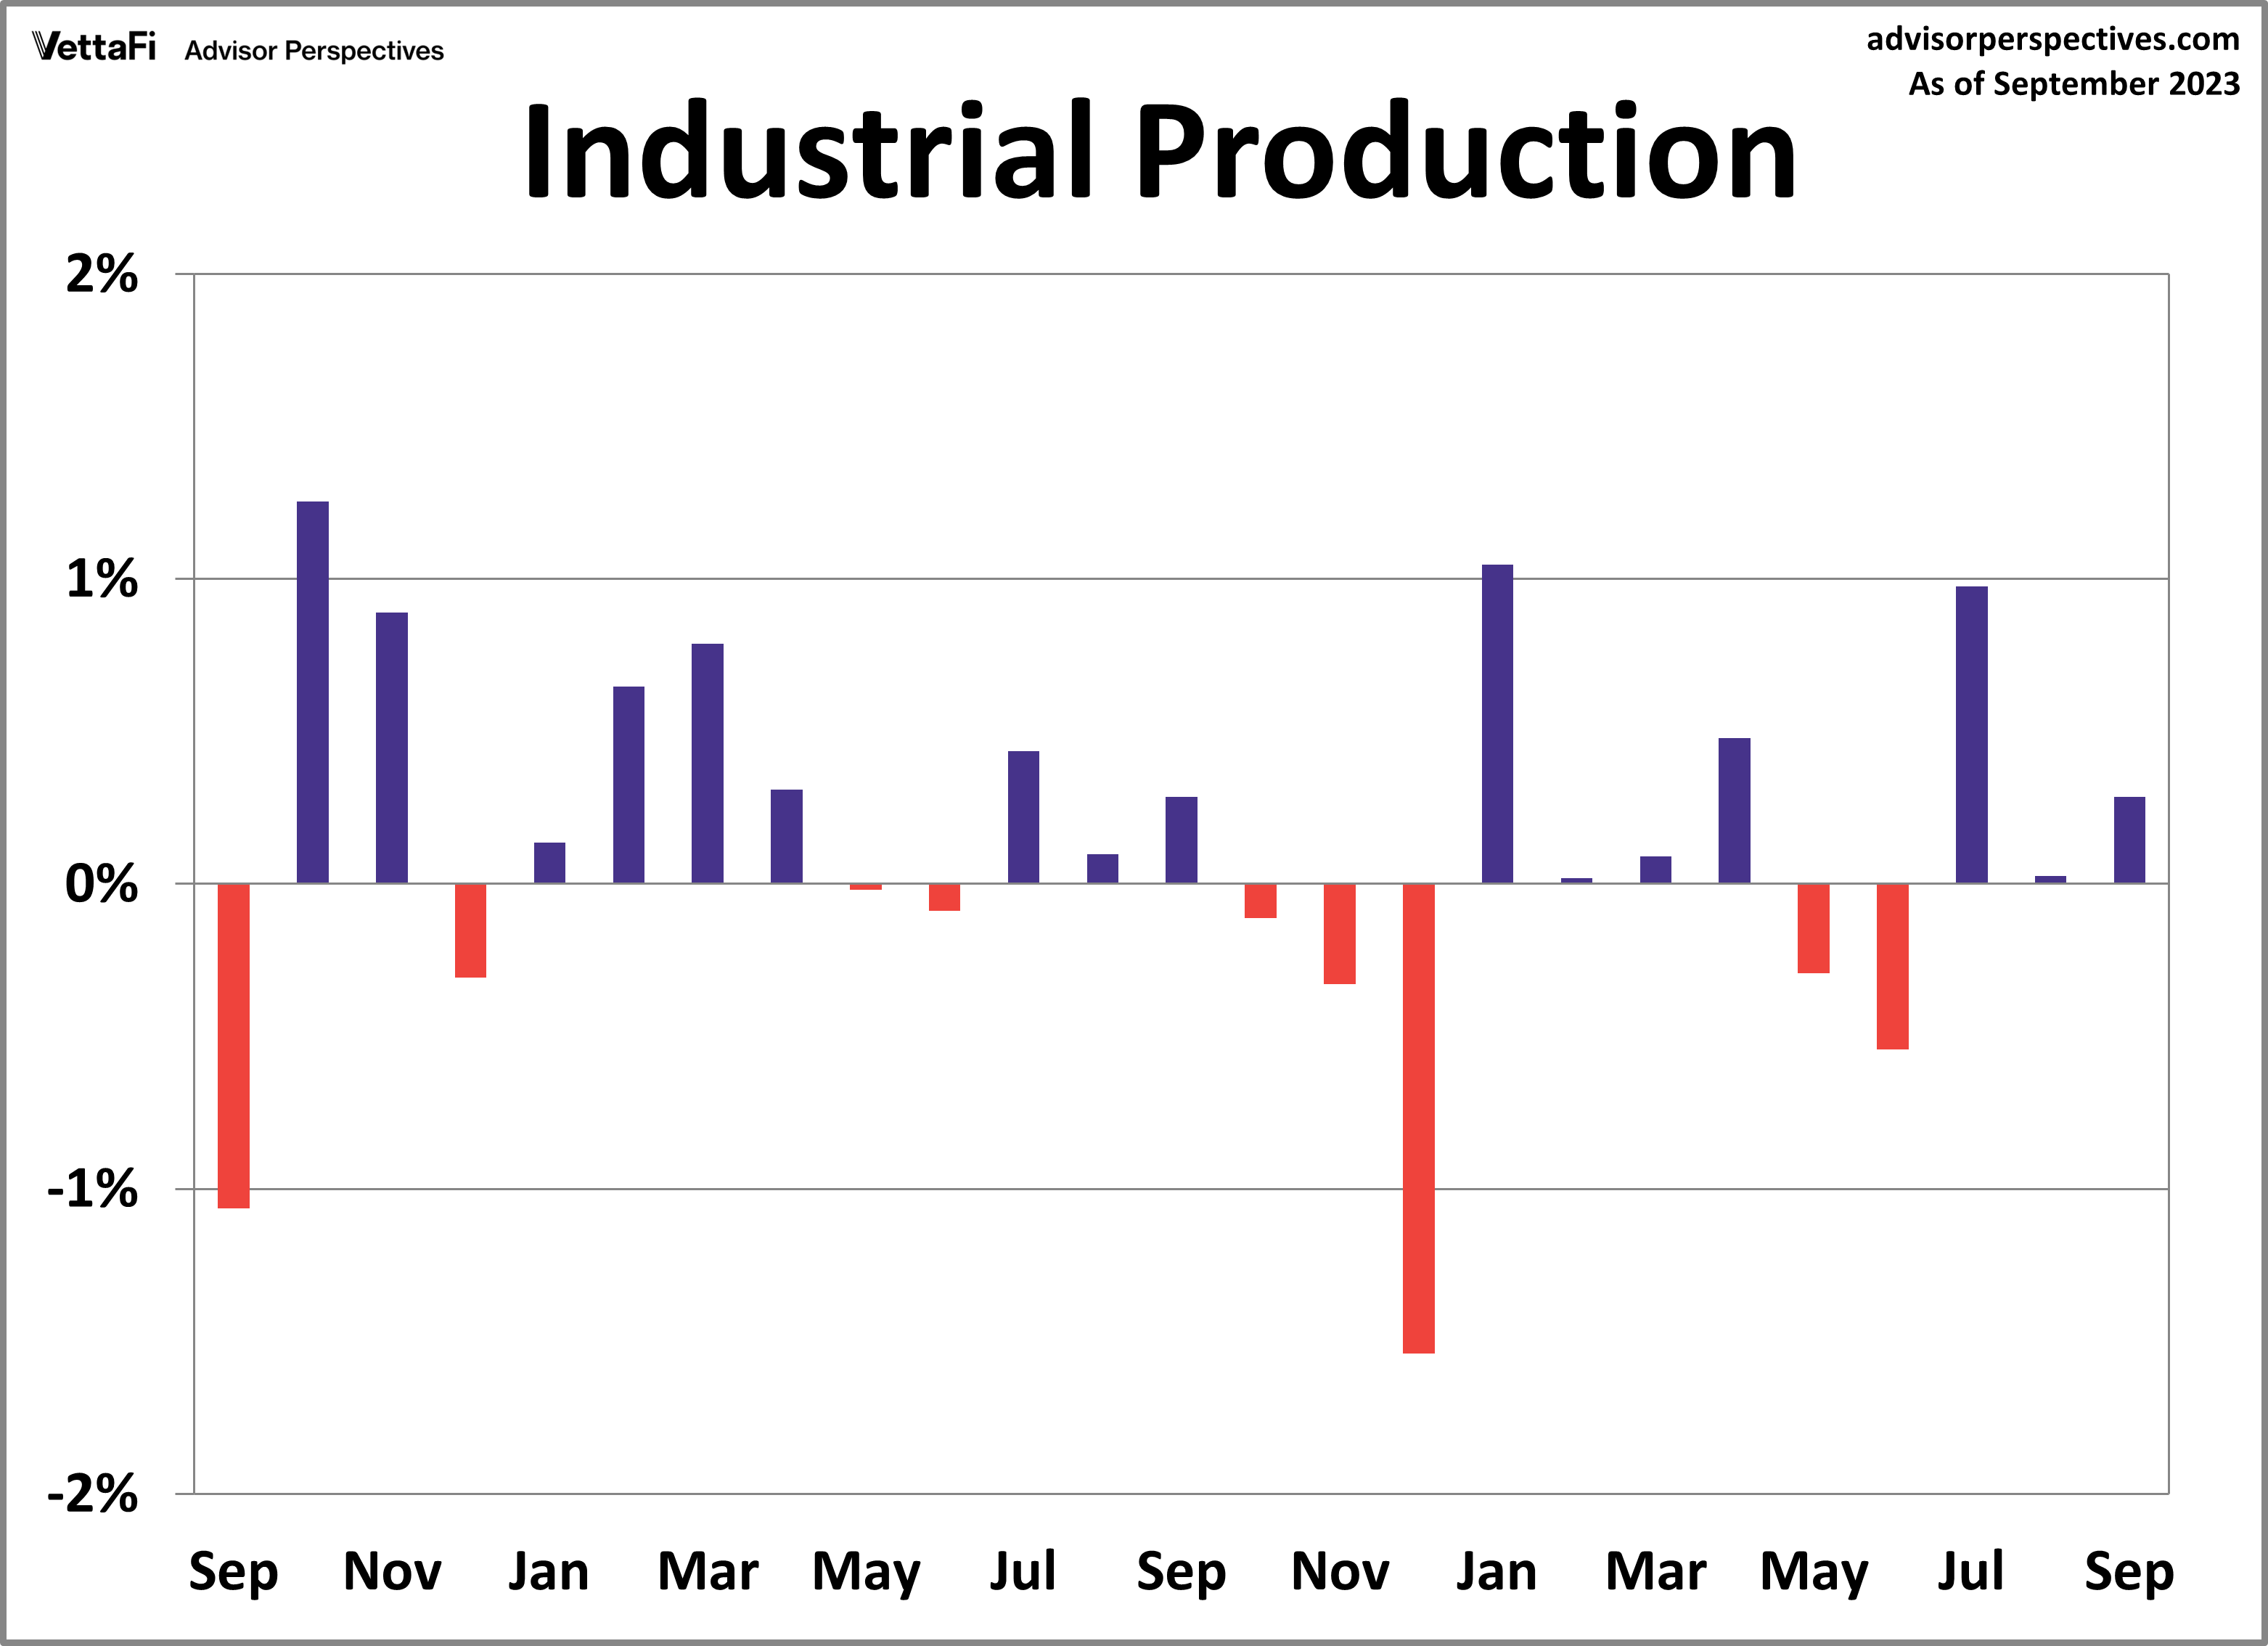
U.S. factory output increased for a third straight month in September as it reached its highest level in five years. Industrial production rose 0.3% in September, outpacing the 0.1% projected growth. A breakdown of the index reveals that last month’s growth can be largely attributed to two sectors: manufacturing and mining. Surprisingly, the production of motor vehicles and parts inched up 0.3% despite ongoing strikes against three major automakers. Compared to one year ago, industrial production was up 0.08%. This marks the third straight month of positive year-over-year readings.
Capacity utilization, which measures the amount of slack in the economy by comparing current production output to its maximum potential output, also increased last month. The latest reading of the capacity utilization index was up 0.2% from last month to 79.7, surpassing the 79.6 forecast. In addition to showing cycles of economic growth and demand, capacity utilization also serves as a leading indicator of inflation. This makes it a closely monitored measure of economic health.
Industrial production will have an impact on the interest in the Industrial Select Sector SPDR Fund (XLI).
Leading Economic Index
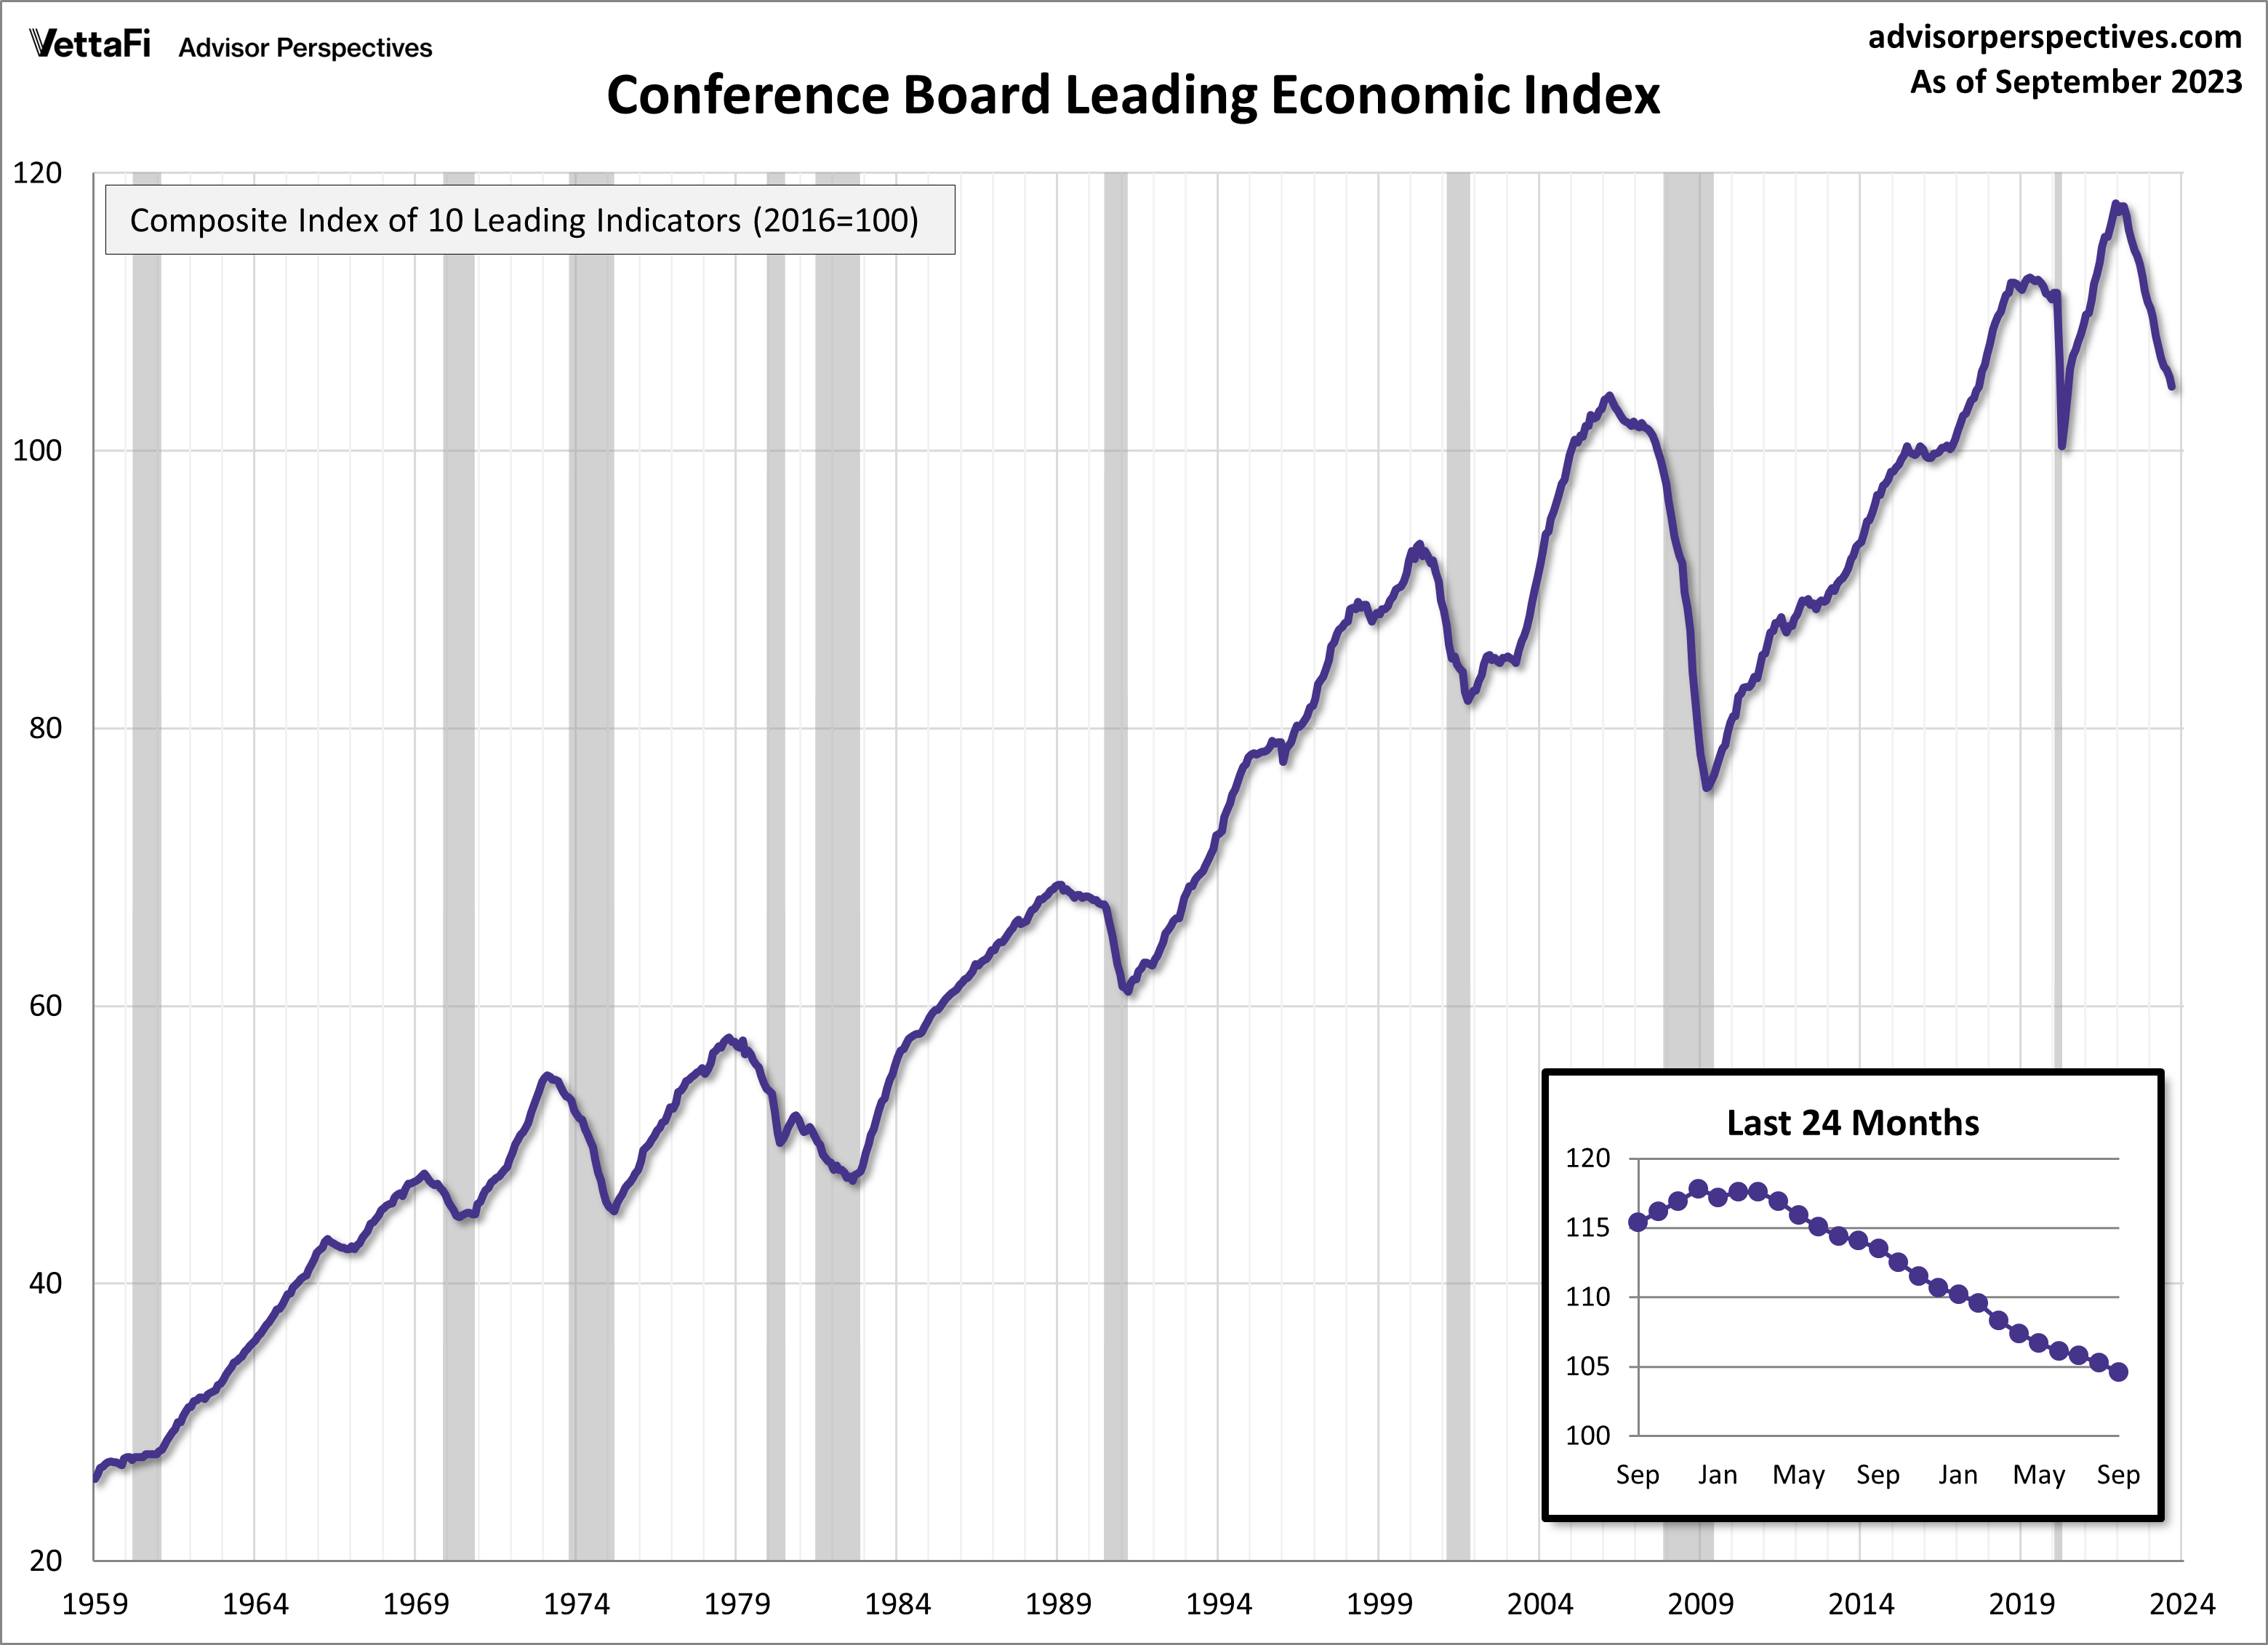
The Conference Board Leading Economic Index (LEI), a composite index designed to predict the economy’s trajectory, continues to signal weak economic activity ahead. September marked the 18th consecutive month of decline for the LEI, with a 0.7% drop to 104.6. That was its lowest level since June 2020. The Conference Board has been predicting a recession for quite some time, and the continuous decline in the index over the past year and a half strengthens their stance. More specifically, the Conference Board now projects a short and shallow recession for the first half of 2024.
In September, nine of the index’s 10 components made negative contributions. The largest declines come from average consumer expectations for business conditions, ISM® New Orders Index, building permits, and the interest rate spread (10-year Treasury bonds less federal funds rate). The sole positive contributor was average weekly initial claims for unemployment insurance.
Economic Indicators and the Week Ahead
The upcoming week will offer insights into the nation’s economic climate, particularly in terms of consumption and consumer sentiment. The Bureau of Economic Analysis (BEA) will release the advance estimate of the 2023 Q3 GDP on Thursday followed by September’s PCE Price Index reading on Friday. Also on Friday, the University of Michigan will report the final reading for this month’s Consumer Sentiment Index.
The 2023 Q3 advance estimate is forecasted to come in at 4.1%, almost twice as much as the 2023 Q2 final estimate of 2.1%. The core PCE price index, the Fed’s preferred measure of inflation, will be released on Friday. In that, we’ll learn whether inflation continues to trend downward toward the Fed’s 2% target rate. Finally, consumer attitudes are expected to have worsened from last month. This is because the final report for the Michigan Consumer Sentiment Index, which could impact the Consumer Discretionary Select Sector SPDR ETF (XLY), is predicted to come in at 63.0, a steep decline from September’s final reading of 68.1.
For more news, information, and analysis, visit the Innovative ETFs Channel.
