
The November release for new home sales from the Census Bureau came in at a seasonally adjusted annual rate of 590,000 units. New home sales were down 12.2% month-over-month from a revised rate of 672,000 in October and up 1.4% from one year ago.
For a longer-term perspective, here is a snapshot of the data series, which is produced in conjunction with the Department of Housing and Urban Development. The data since January 1963 is available in the St. Louis Fed’s FRED repository here. We’ve included a six-month moving average to highlight the trend in this highly volatile series.
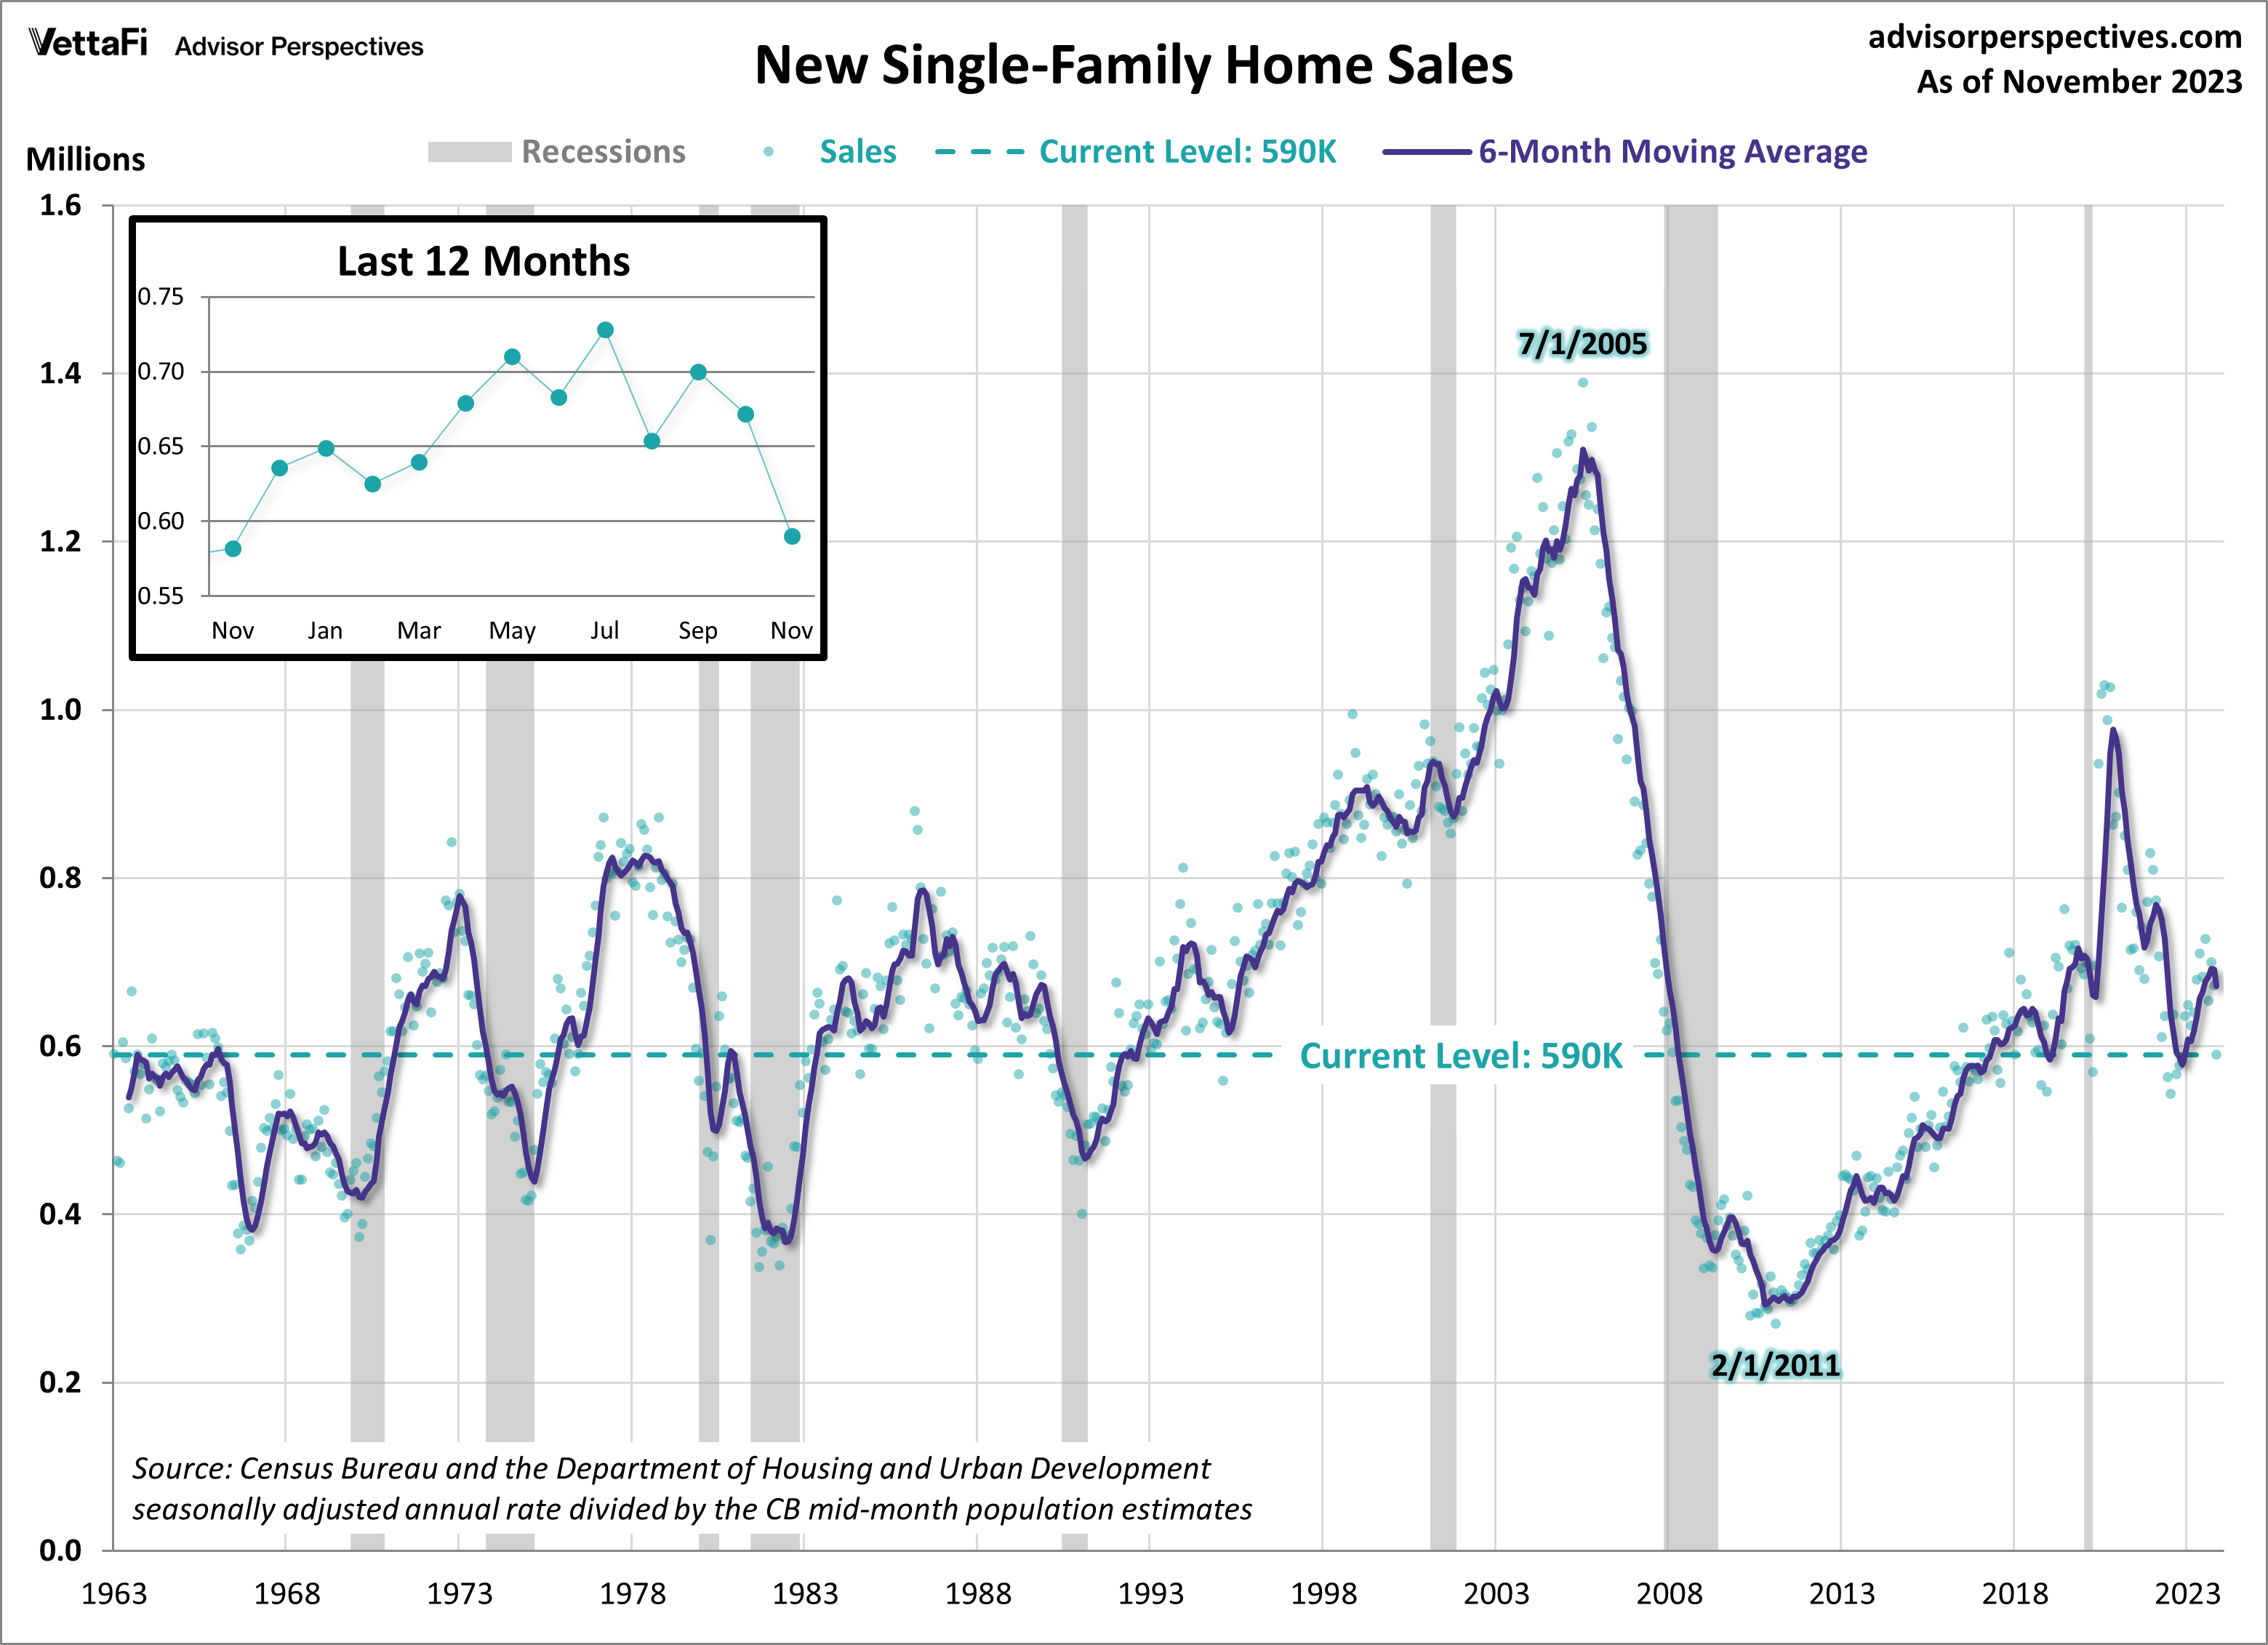
Over this time frame, we see the steady rise in new home sales following the 1990 recession and the acceleration in sales during the real estate bubble that peaked in 2005. Starting in 2011, there was a similar rise in new home sales that peaked near the end of 2020 and retracted for about 2 years. The most recent trend in new home sales has been one of steady growth, with new home sales increasing 9 of the past 14 months.
New Home Sales: The Population-Adjusted Reality
Now let’s examine the data with a simple population adjustment. The Census Bureau’s mid-month population estimates show a 78.6% increase in the US population since 1963. Here is a chart of new home sales as a percentage of the population.
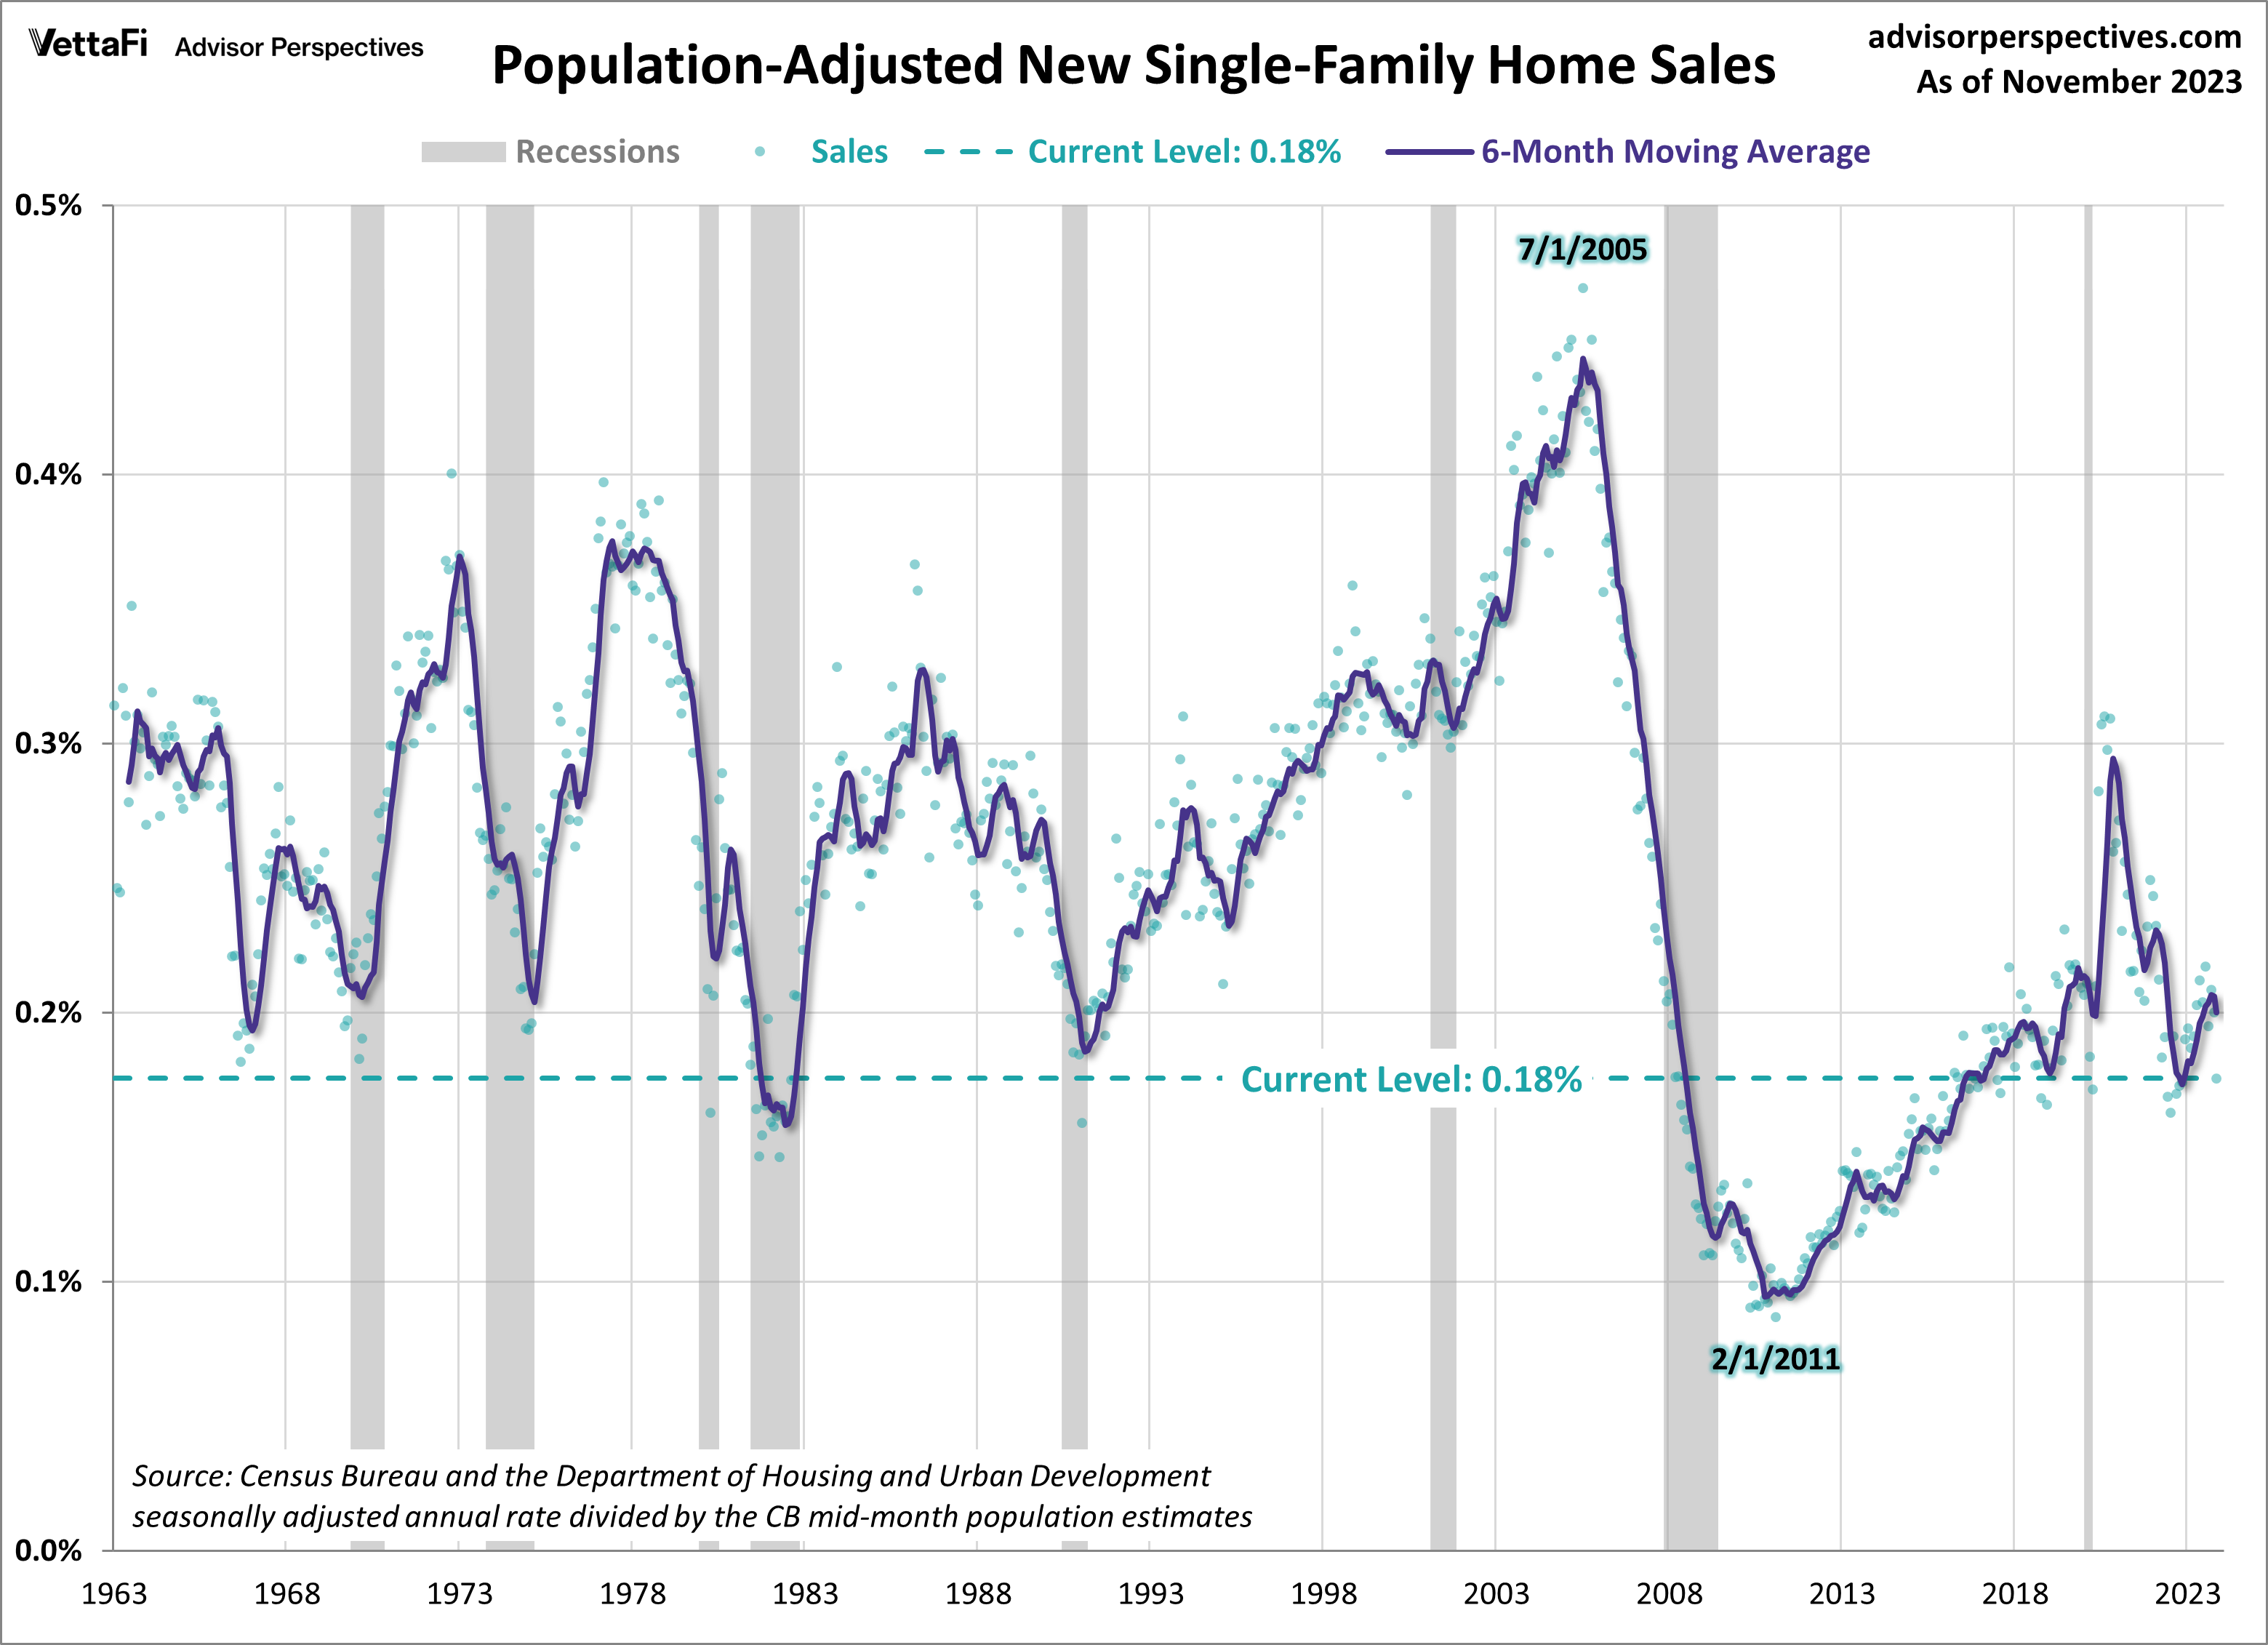
New single-family home sales are 0.2% below the 1963 start of this data series. The population-adjusted version is 44.1% below the first 1963 sales and at a level similar to the lows we saw during the Great Recession. Today’s 30-year mortgage rate is 6.67% (per Freddie Mac).
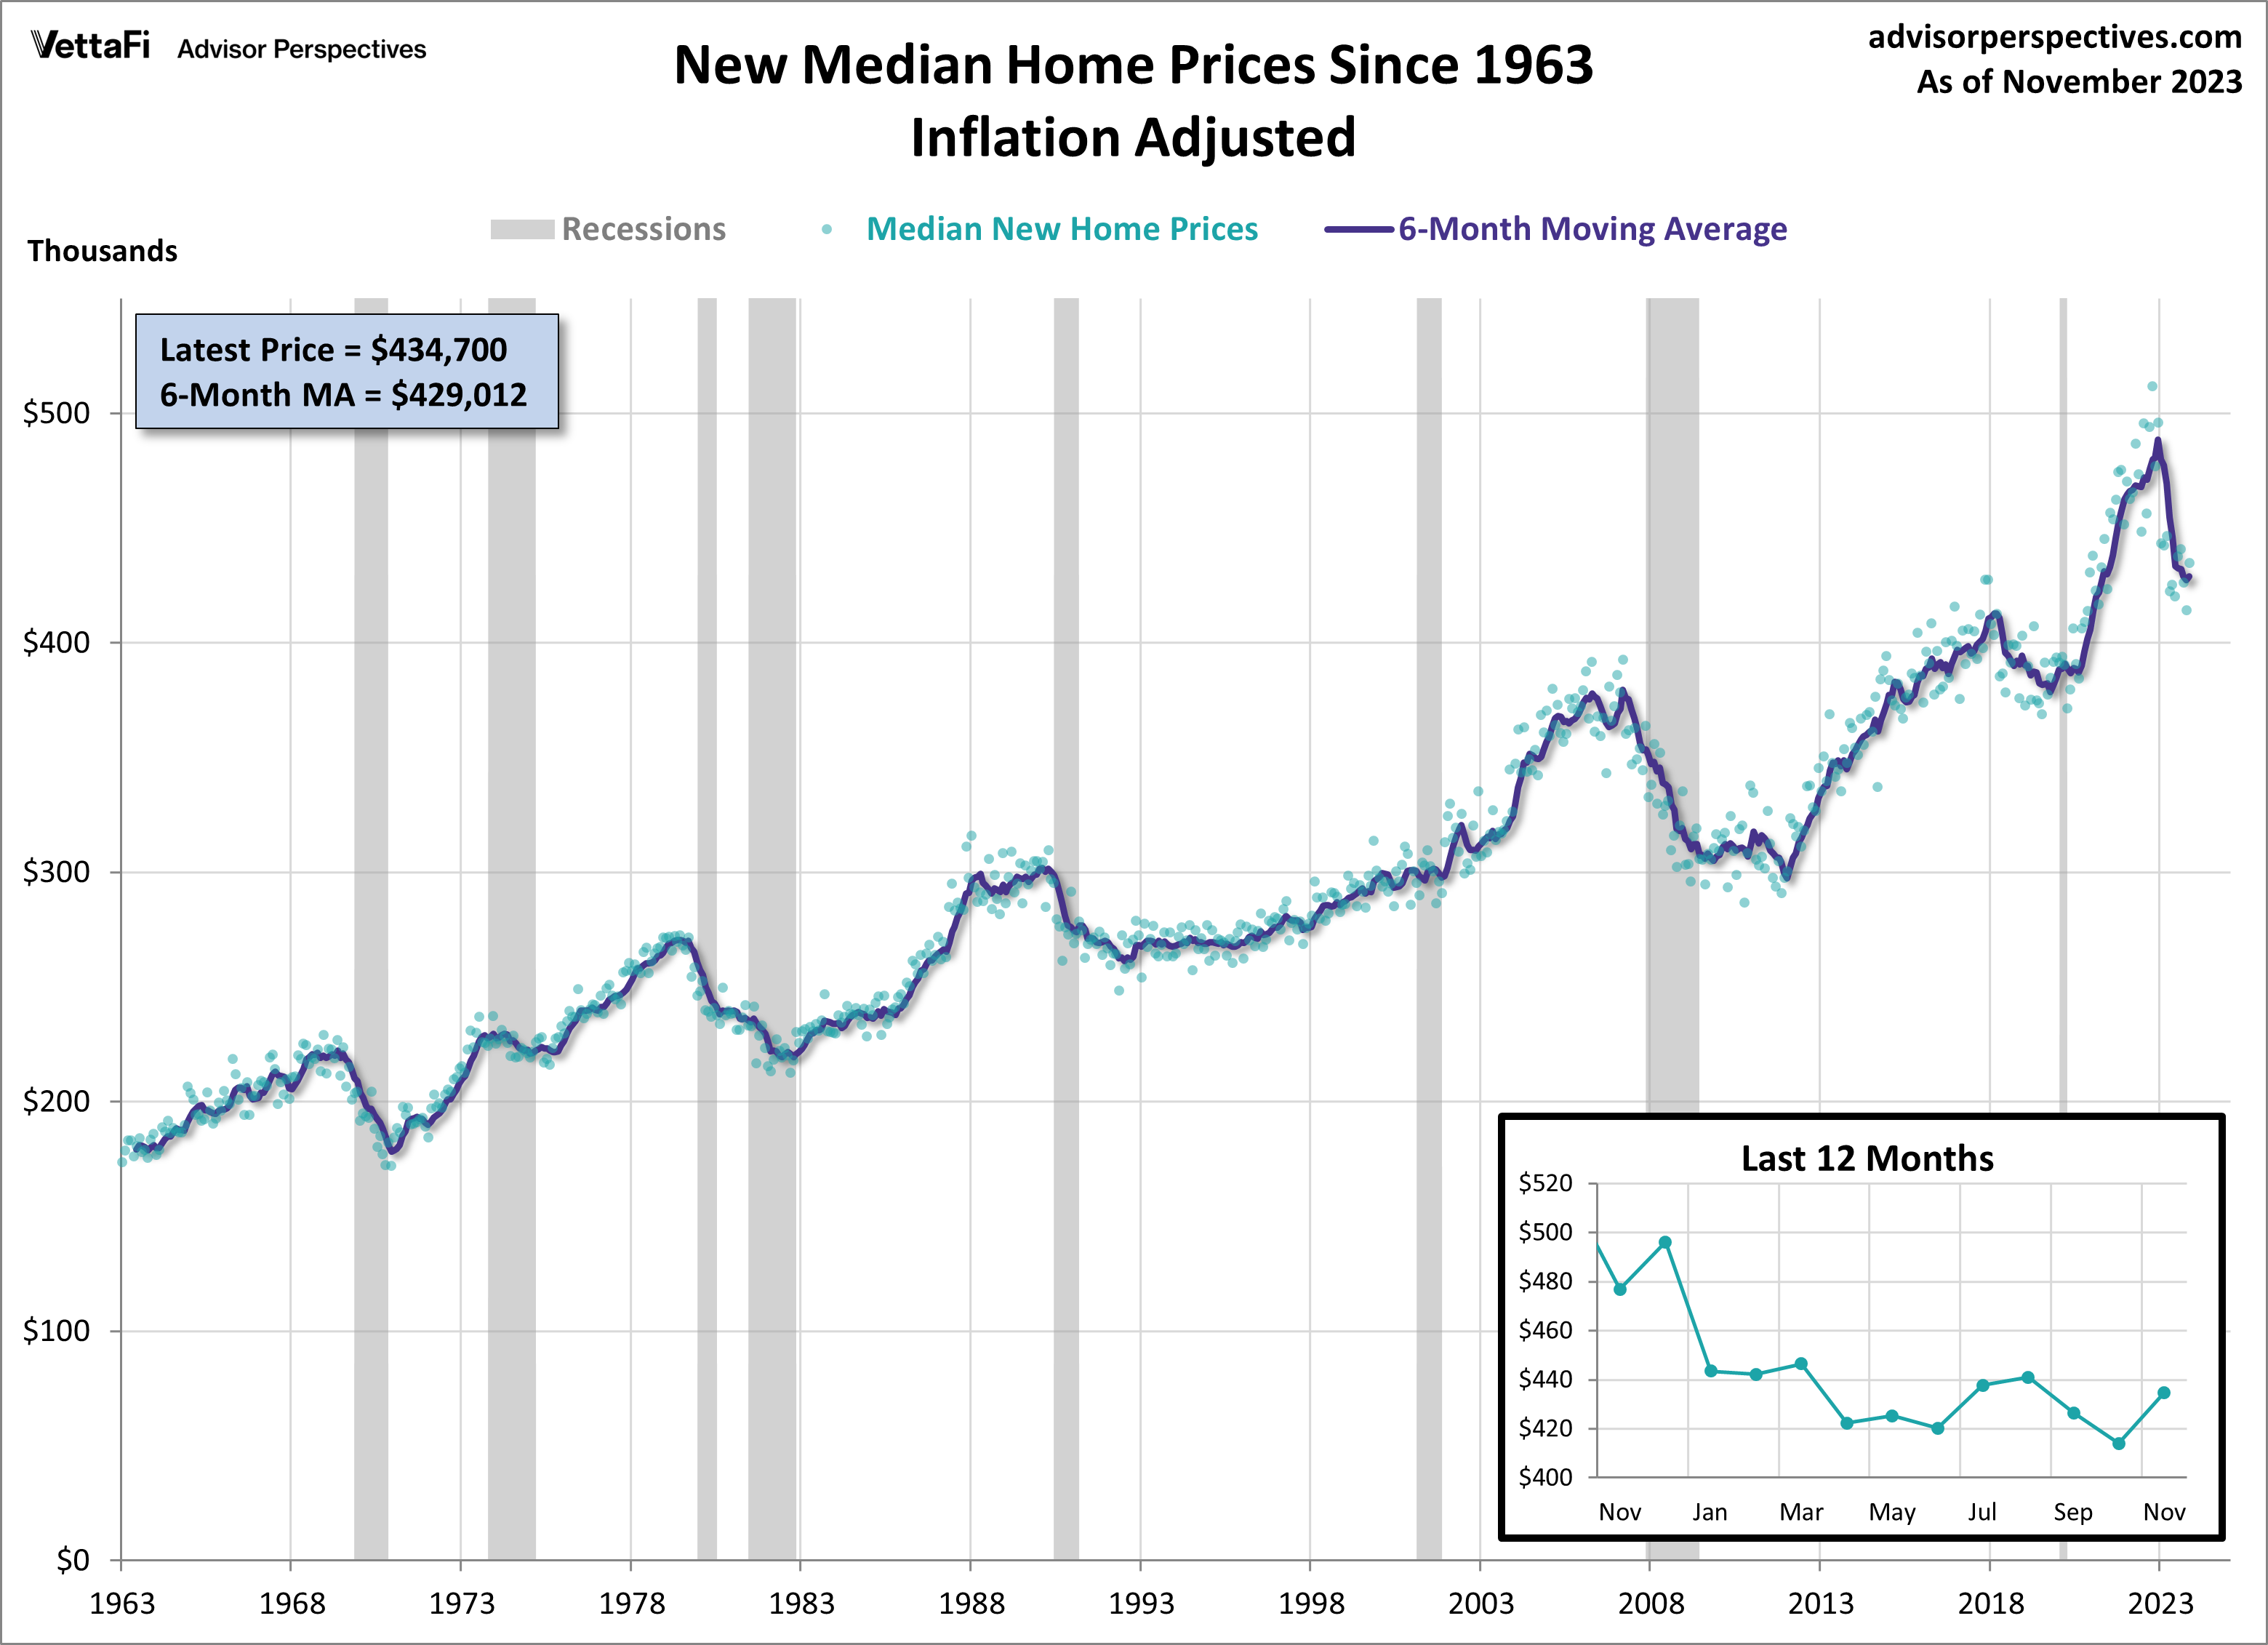
New Home Sales: Median Price
The median home price is now at $434,700. This represents a 4.8% increase from last month and a 6.0% decrease from November 2022. However, after adjusting for inflation, the monthly change rises to a 5.0% increase while the annual change drops to a 8.8% decrease.
This next chart shows the inflation-adjusted median sales price of new homes since 1963. The data source is also the Census Bureau and can be found on the press release and website above. For inflation adjustment, we use the CPI-U, which is the consumer price index for all urban consumers. We’ve included a six-month moving average for this extremely volatile metric to give us a clearer sense of the trend.
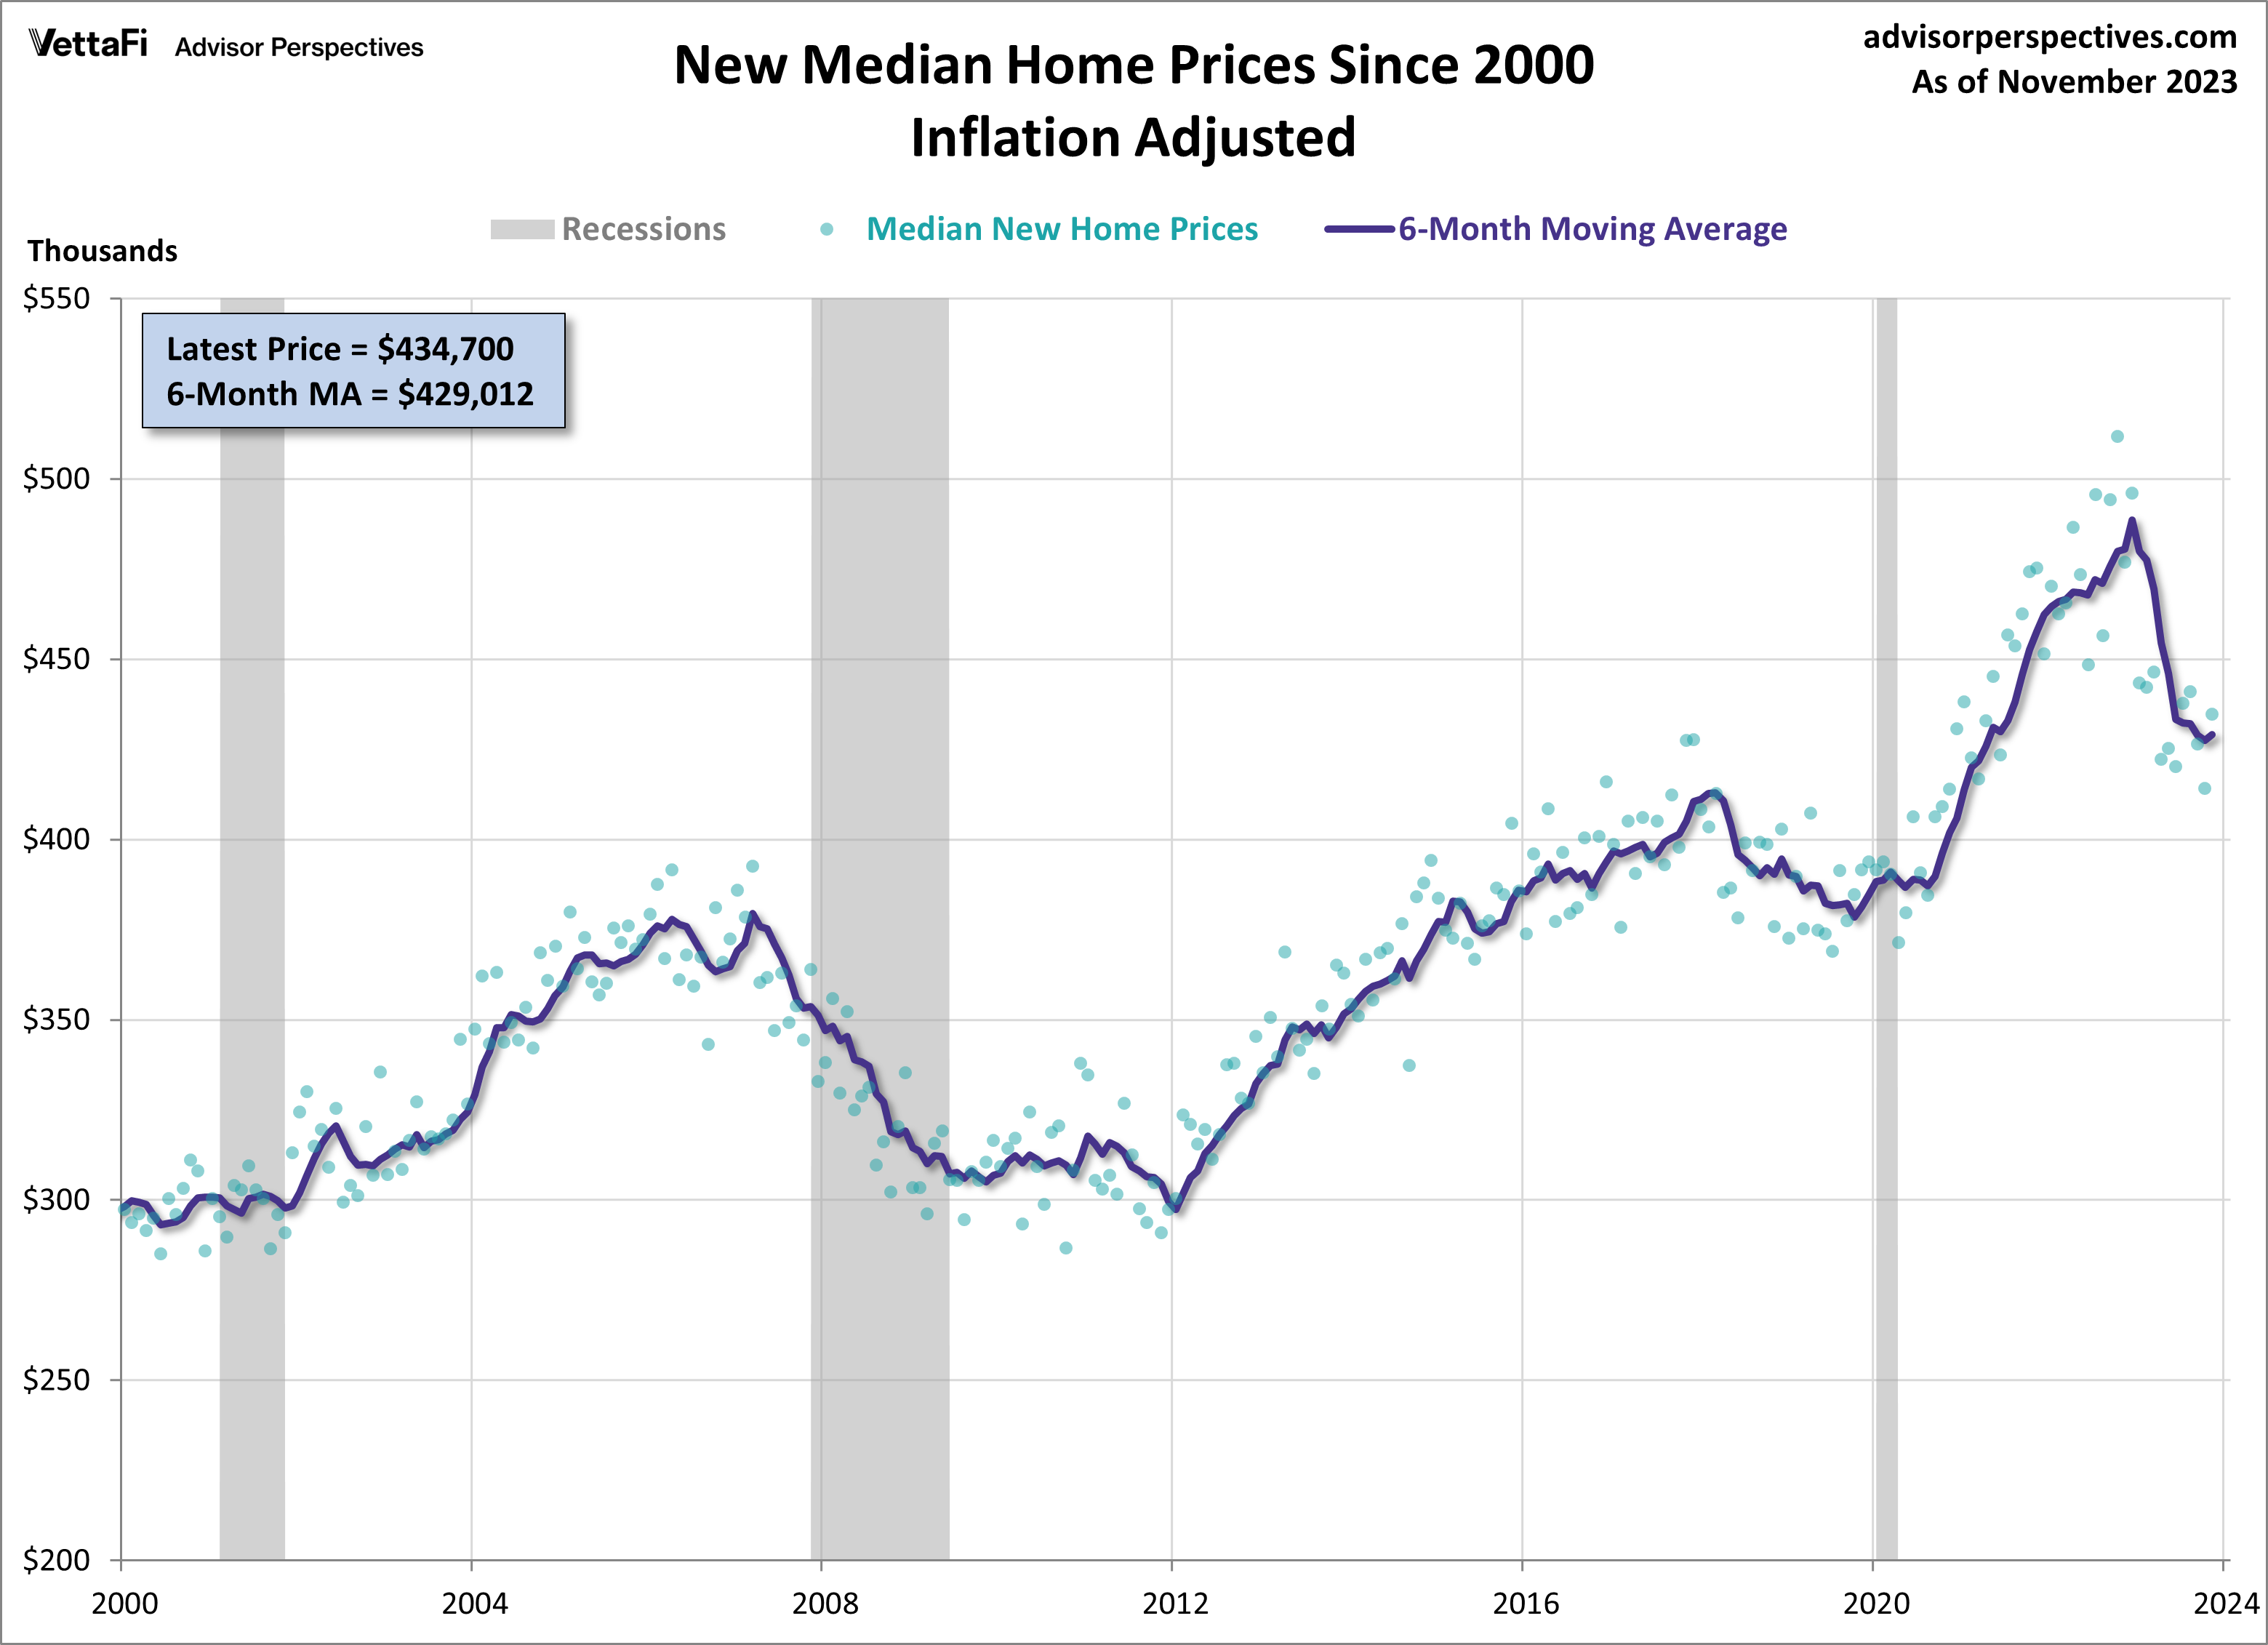
Here’s a zoomed-in look from the turn of the century.
ETFs associated with residential real-estate include: iShares Residential and Multisector Real Estate ETF (REZ).
ETFs associated with home builders include: Invesco Dynamic Building & Construction ETF (PKB), iShares U.S. Home Construction ETF (ITB) and SPDR S&P Homebuilders ETF (XHB).
Originally published on Advisor Perspectives.
For more news, information, and strategy, visit the Innovative ETFs Channel.
