
Valid until the market close on November 30, 2023
The S&P 500 closed October with a monthly loss of 2.20%, after a loss of 4.93% in September. At this point, after close on the last day of the month, four of five Ivy portfolio ETFs — Vanguard Total Stock Market ETF (VTI), Vanguard FTSE All-World ex-US Index Fund (VEU), iShares 7-10 Year Treasury Bond ETF (IEF) and Vanguard Real Estate ETF (VNQ) — are signaling “cash,” up from last month’s triple “cash” signal.
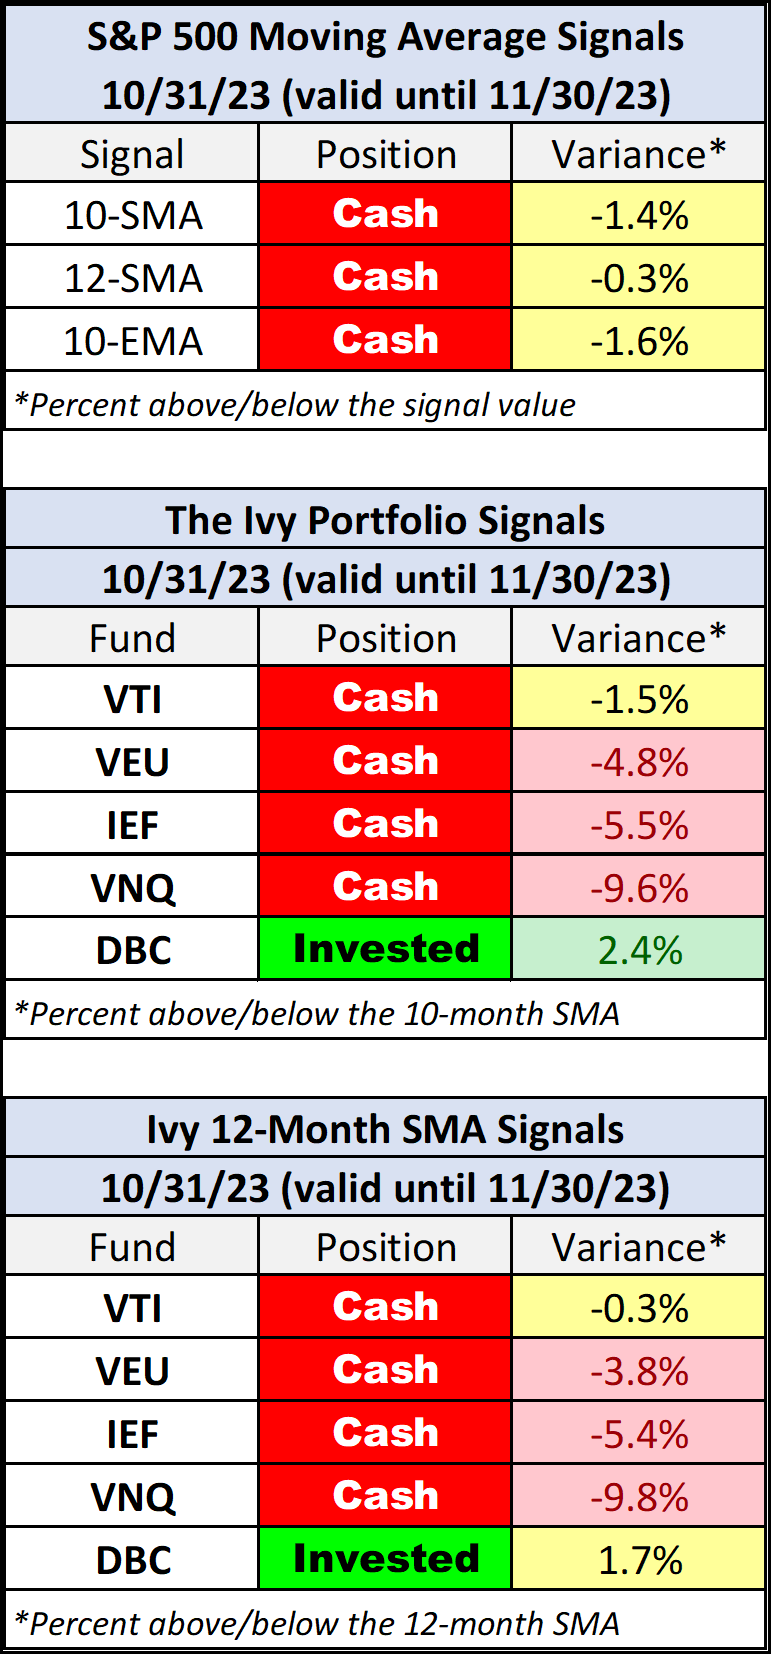
If a position is less than 2% from a signal, it is highlighted in yellow.
The Ivy Portfolio
The second table above shows the current 10-month simple moving average (SMA) signal for each of the five ETFs featured in The Ivy Portfolio. The third table shows the 12-month SMAs for the same ETFs for this popular alternative strategy.
The five ETFs included in the Ivy Portfolio are Vanguard Total Stock Market ETF (VTI), Vanguard FTSE All-World ex-US Index Fund (VEU), iShares 7-10 Year Treasury Bond ETF (IEF), Vanguard Real Estate ETF (VNQ), and Invesco DB Commodity Index Tracking Fund (DBC).
For a fascinating analysis of the Ivy portfolio strategy, see this article by Adam Butler, Mike Philbrick, and Rodrigo Gordillo: Faber’s Ivy Portfolio: As Simple as Possible, But No Simpler.
Background on Moving Averages
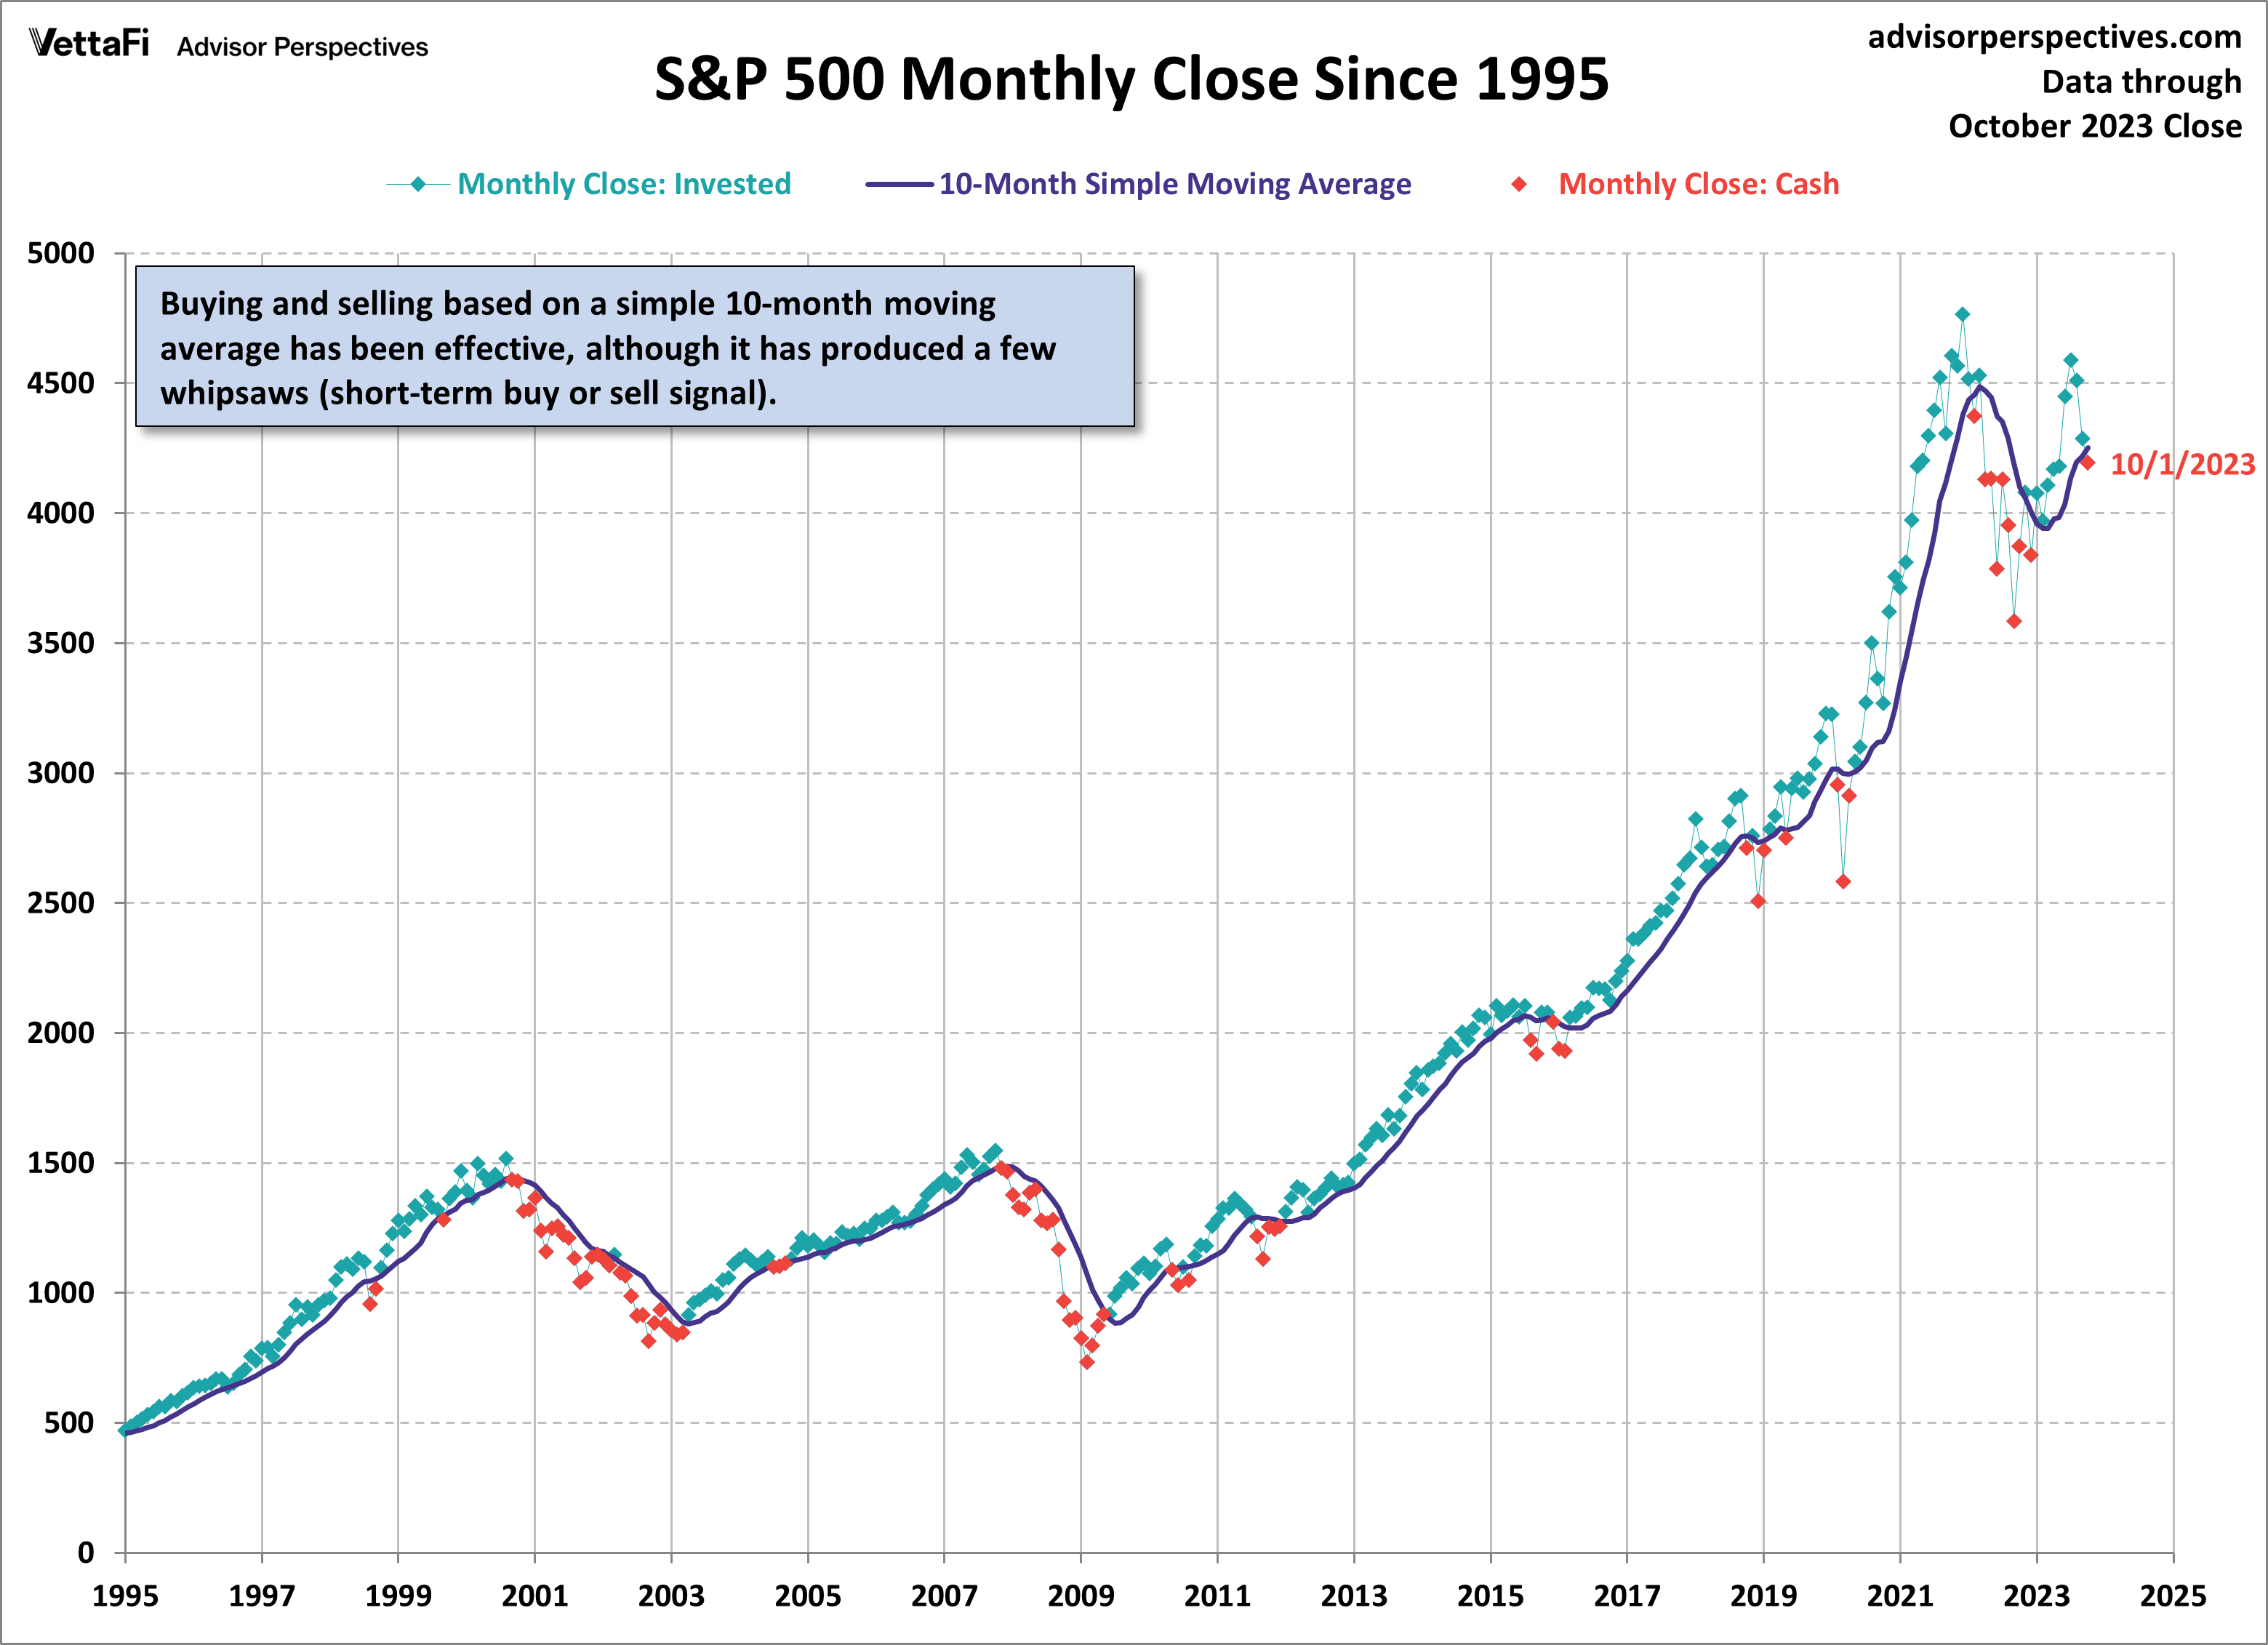
Buying and selling based on a moving average of monthly closes can be an effective strategy for managing the risk of severe loss from major bear markets. In essence, when the monthly close of the index is above the moving average value, you hold the index. When the index closes below, you move to cash. The disadvantage is that it never gets you out at the top or back in at the bottom. Also, it can produce the occasional whipsaw (short-term buy or sell signal), which was seen most recently in 2020.
Nevertheless, a chart of the S&P 500 monthly closes since 1995 shows that a 10- or 12-month SMA strategy would have ensured participation in most of the upside price movement while dramatically reducing losses.
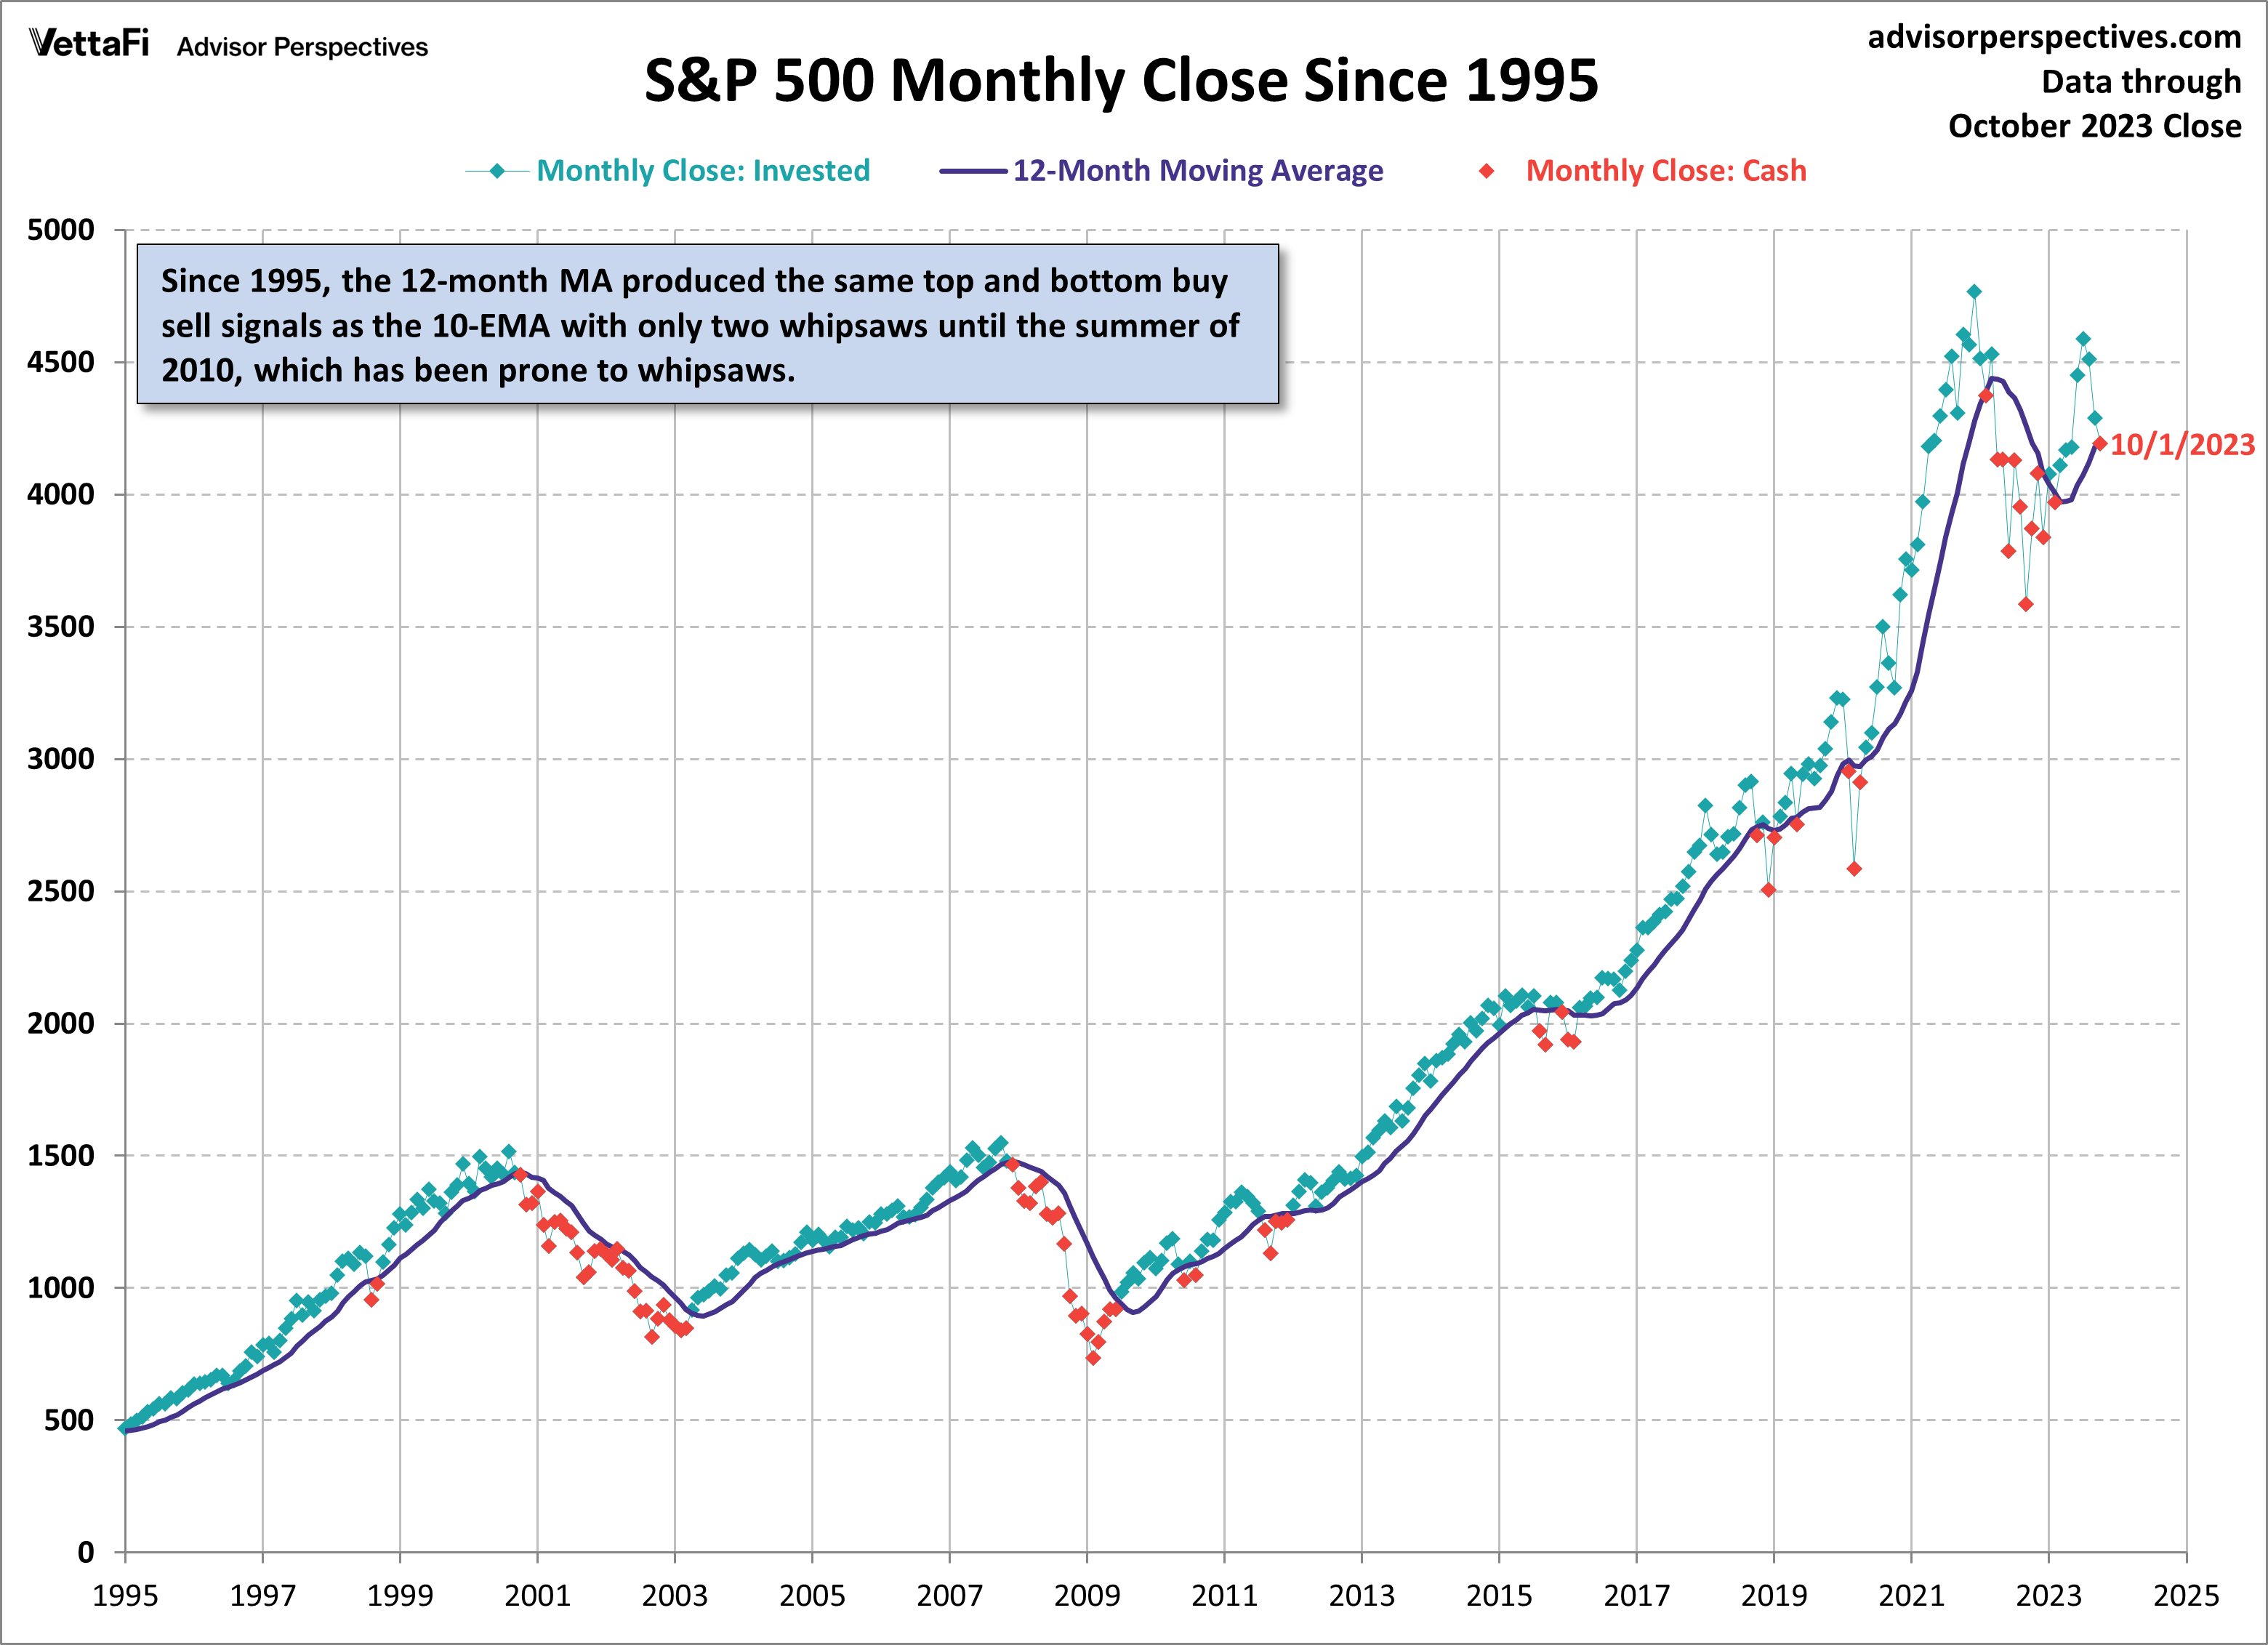
Here is the 12-month variant:
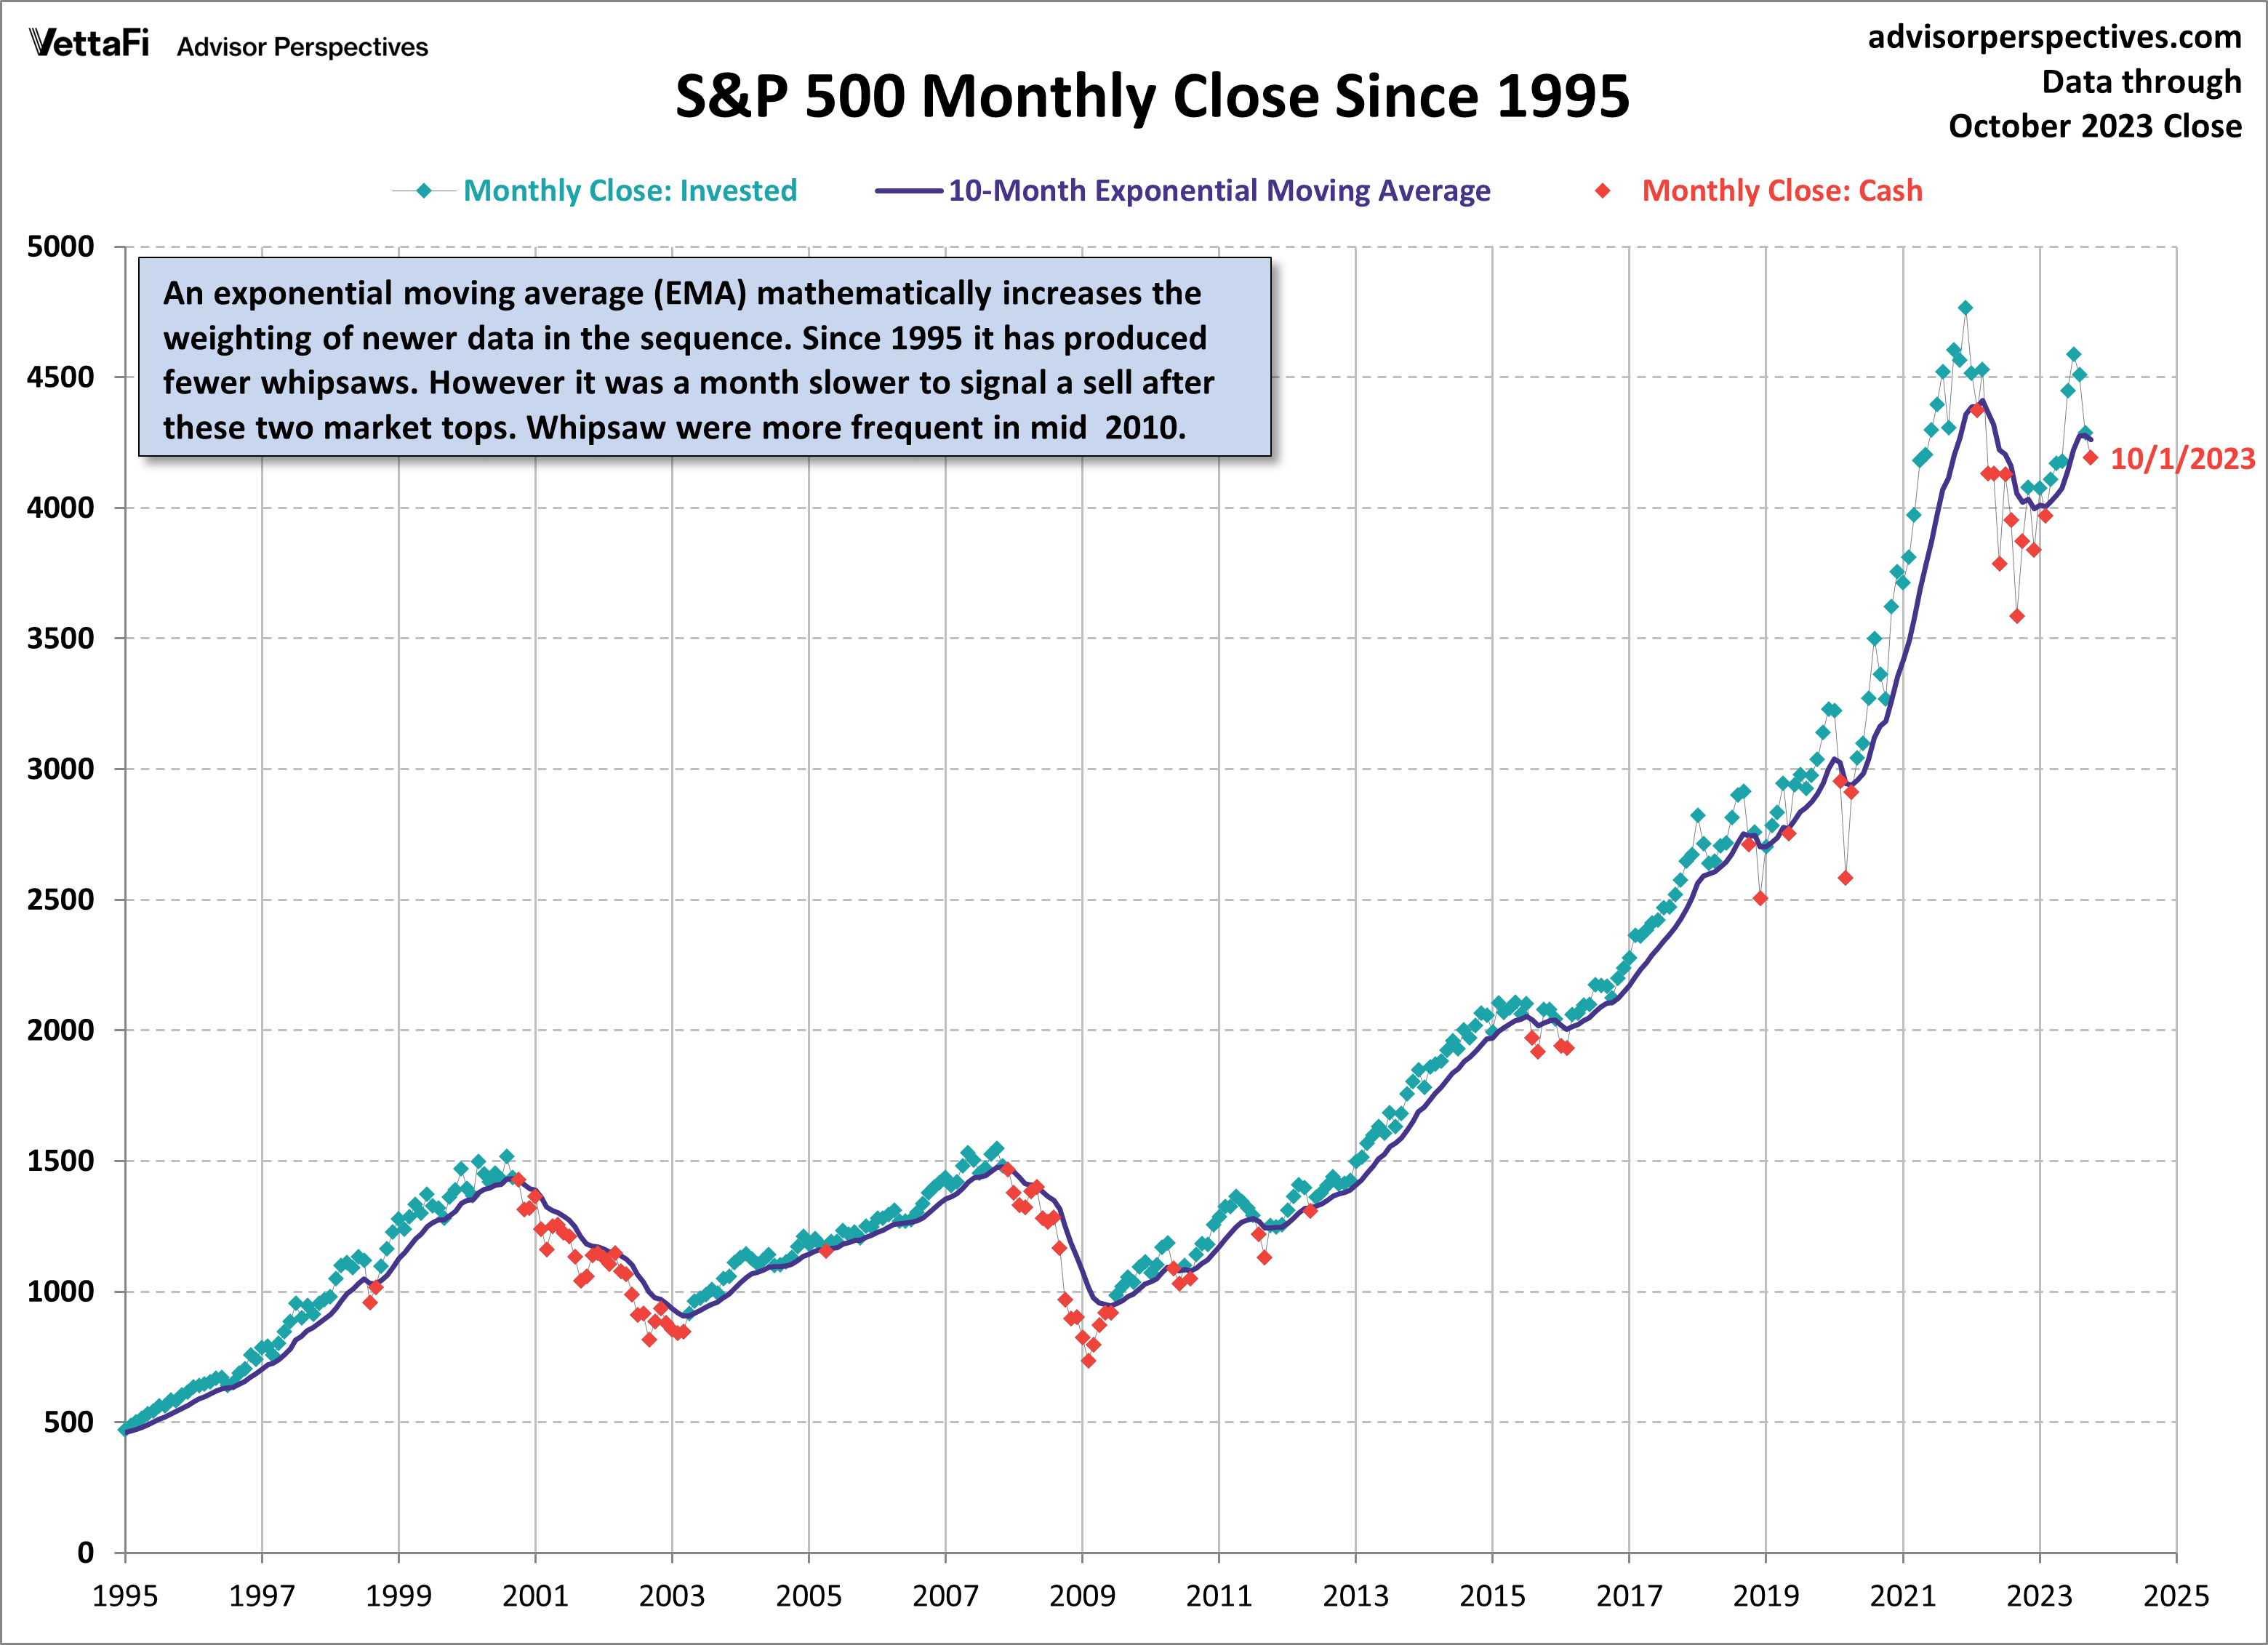
The 10-month exponential moving average (EMA) is a slight variant on the simple moving average. This version mathematically increases the weighting of newer data in the 10-month sequence. Since 1995, it has produced fewer whipsaws than the equivalent simple moving average. However, it was a month slower to signal a sell after these two market tops.
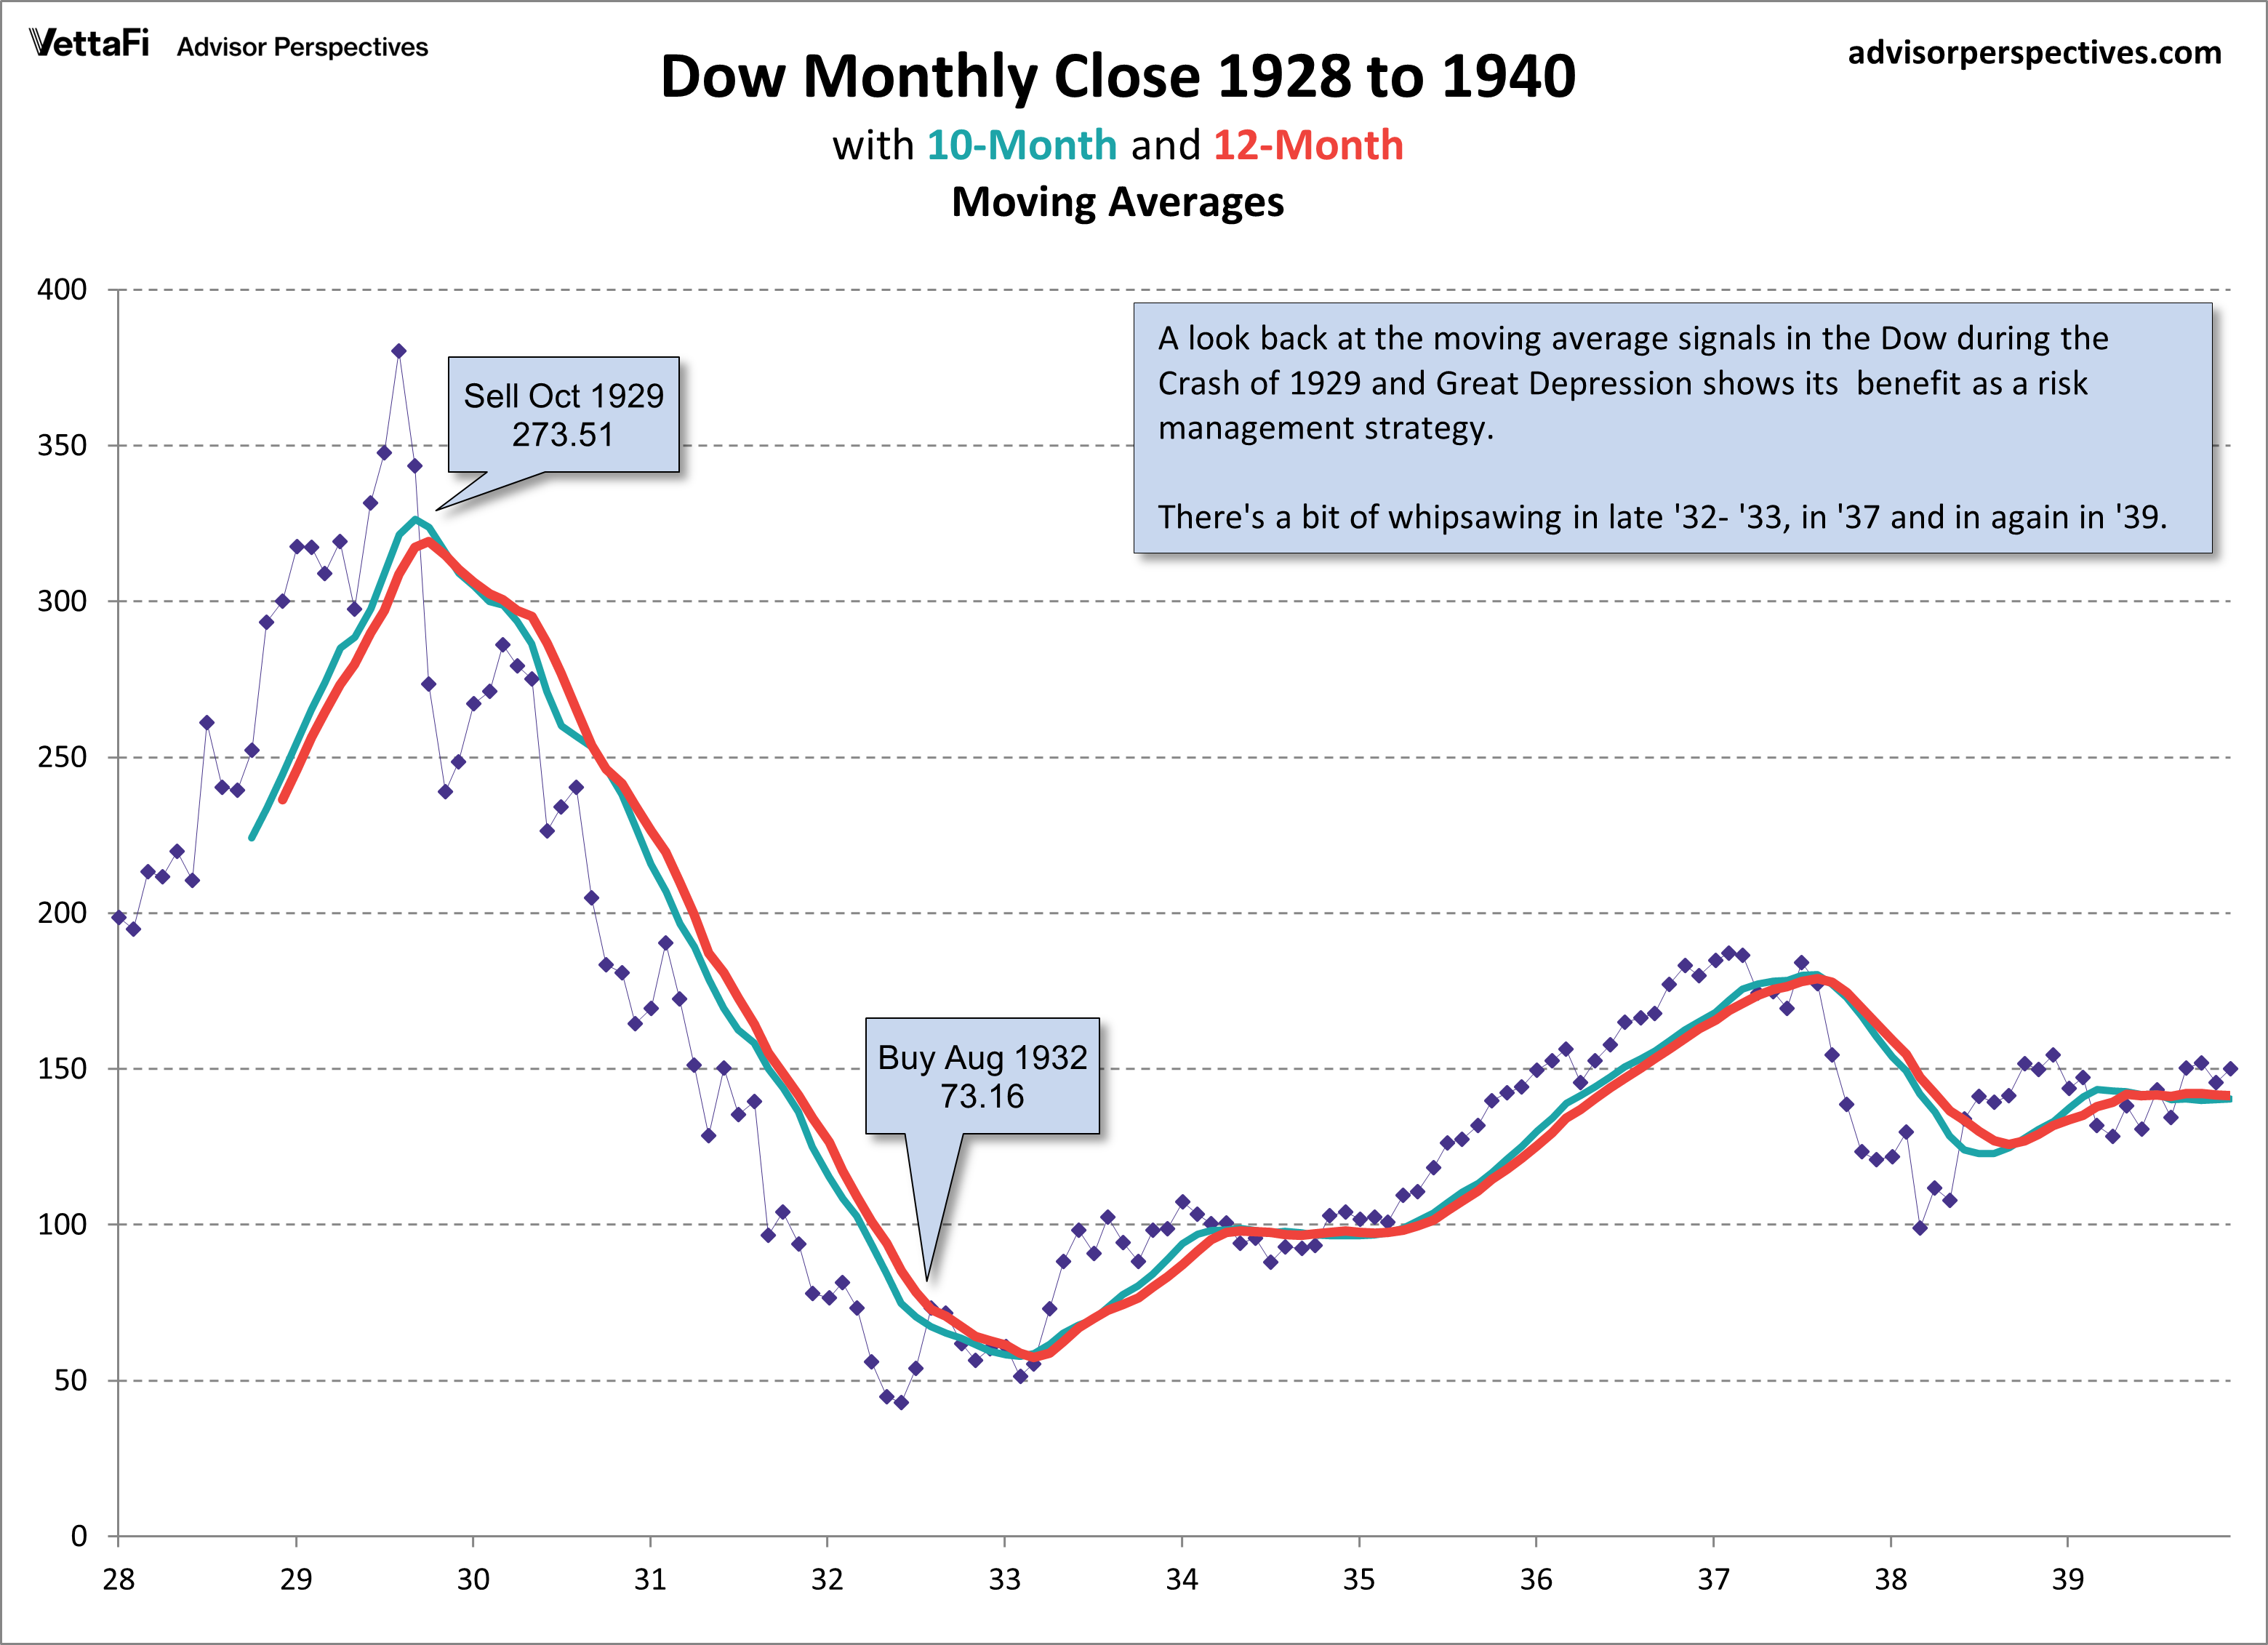
A look back at the 10- and 12-month moving averages in the Dow during the Crash of 1929 and Great Depression shows the effectiveness of these strategies during those dangerous times.
The Psychology of Momentum Signals
Timing works because of a basic human trait. People imitate successful behavior. When they hear of others making money in the market, they buy in. Eventually, the trend reverses. It may be merely the normal expansions and contractions of the business cycle. Sometimes the cause is more dramatic — an asset bubble, a major war, a pandemic, or an unexpected financial shock. When the trend reverses, successful investors sell early. The imitation of success gradually turns the previous buying momentum into selling momentum.
Implementing the Moving Averages Strategy
Our illustrations from the S&P 500 are just that — illustrations. We use the S&P because of the extensive historical data that’s readily available. However, followers of a moving average strategy should make buy/sell decisions on the signals for each specific investment, not a broad index. Even if you’re investing in a fund that tracks the S&P 500 (e.g., Vanguard’s VFINX or the SPY ETF) the moving average signals for the funds will occasionally differ from the underlying index because of dividend reinvestment. The S&P 500 numbers in our illustrations exclude dividends.
The strategy is most effective in a tax-advantaged account with a low-cost brokerage service. You want the gains for yourself, not your broker or your Uncle Sam.
Note: For anyone who would like to see the 10- and 12-month simple moving averages in the S&P 500 and the equity-versus-cash positions since 1950, click here for an Excel file (xlsx format) of the data. Our source for the monthly closes (Column B) is Yahoo! Finance. Columns D and F show the positions signaled by the month-end close for the two SMA strategies.
As a regular feature of this website, we update the signals at the end of each month.
Footnote on calculating monthly moving averages: If you’re making your own calculations of moving averages for dividend-paying stocks or ETFs, you will occasionally get different results if you don’t adjust for dividends. For example, in 2012, VNQ remained invested at the end of November based on adjusted monthly closes. But there was a sell signal if you ignored dividend adjustments. Because the data for earlier months will change when dividends are paid, you must update the data for all the months in the calculation if a dividend was paid since the previous monthly close. This will be the case for any dividend-paying stocks or funds.
Recommended Reading
In the past, I’ve recommended Mebane Faber’s thoughtful article A Quantitative Approach to Tactical Asset Allocation. The article has now been updated and expanded as Part Three: Active Management in his book The Ivy Portfolio, coauthored with Eric Richardson. This is a “must read” for anyone contemplating the use of a timing signal for investment decisions. The book analyzes the application of moving averages of the S&P 500 and four additional asset classes: the Morgan Stanley Capital International EAFE Index (MSCI EAFE), Goldman Sachs Commodity Index (GSCI), National Association of Real Estate Investment Trusts Index (NAREIT), and United States government 10-year Treasury bonds.
For additional insights from Mebane Faber, please visit his website, Mebane Faber Research.
For more news, information, and analysis, visit the Innovative ETFs Channel.
