
Thought to ponder…
“Joy comes to us in moments—ordinary moments. We risk missing out on joy when we get too busy chasing down the extraordinary.”
-Brené Brown Daring Greatly
The View from 30,000 feet
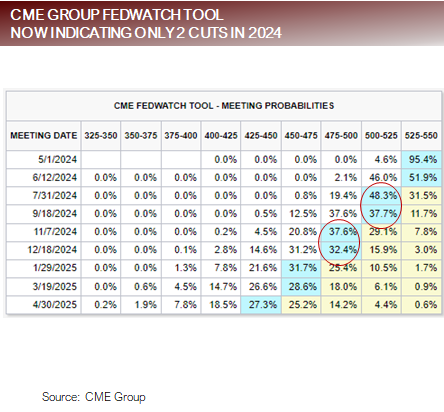
Major events last week included the ISM Purchasing Manager Survey data, that confirmed an acceleration manufacturing, employment data, that signaled a continuation of the robust employment environment that has been driving consumer spending and an escalation of hostilities in the Middle East, which adds to the compounding geopolitical tensions since Putin invaded Ukraine, with the latest moves adding an increased risk premium being built into oil prices. The net effect of strong business survey data and healthy employment reports was lower conviction that disinflationary trends of last year will be sustained, which in turn drove a reevaluation of interest rate expectations, as investors began repricing for fewer rate cuts during the remainder of the year, and even began factoring in the possibility of a rate increase into the pipeline. With a heavy week speaking engagement from Fed Presidents, when the dust settled, the lines between two groups within the Fed became clearer. One group, the majority, is in no hurry for cuts but believes disinflationary trends will persist and is leaning towards getting the rate cutting party started by mid-year. While the other group, the minority, is more skeptical that the disinflationary trends will continue and prefers to take a wait and see attitude towards rate cuts. These competing views are pressurized by the election because the Fed does not want to adjust policy immediately preceding the election for fear of being accused of interfering with the election. With the 10-year Treasury yield flirting with levels that gave the markets indigestion last fall and earning season kicking off in with the banks at weekend, the markets are nervous. Without re-enforcement of a return to disinflationary trends of 2023 the markets could be facing a showdown between dwindling rate cut expectations and the upward trend driven by strong employment and spending patterns combined with a nascent manufacturing recovery.
- Unpacking the relationship between ISM data and PPI
- Employment week continued to feed into Fed labor supply story
- With the 10-year Treasury flirting with the danger zone, will the next move be about fear or acceptance of higher rates?
- 2024 Presidential Election Update
- Focus Point Sector Rotation Update: Unwinding of extreme upward trend signal
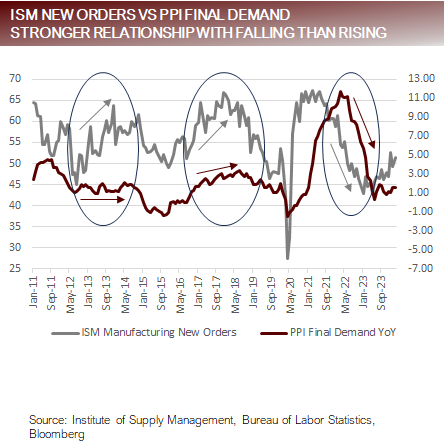
Unpacking the relationship between ISM data and PPI
Manufacturing
-
- Institute of Supply Management (ISM) Manufacturing sector released their purchasing managers survey results showing that the New Orders component, which is thought to lead manufacturing activity, measured 51.4, in expansionary territory for only the second time since mid-2022.
- In addition to New Orders increasing, Production increased sharply, while Customer Inventories drew down. These factors together combine to paint an improving demand picture in Manufacturing that has the hallmarks of an expansion.
Services
-
- The Services picture was not as strong as Manufacturing, with New Orders inching down to 54.4, but still solidly in expansion.
- As with Manufacturing, Production for increased, while Inventories drew down, continuing to paint a strong demand story for Services, although more subdued than the recent momentum in Manufacturing.
- It’s important to keep in mind, although Manufacturing has historically been looked at as a “leading indicator” of the economy, Manufacturing represents only about 20% activity, and did not work as a leading indicator in 2023.
Relationships
- PPI Final Demand has an asymmetrical relationship with ISM Manufacturing New Orders. When New Orders are falling, such as the stretch between 2021 and 2023, PPI has historically followed. However, when New Orders are rising as they are today, the relationship is not as consistent. Between 2012 and 2014 New Orders rose but PPI did not follow, while between 2016 and 2018 New Orders rose, and so did PPI.
- This is important because rising ISM survey data, does not necessarily need to lead to higher PPI, so it may be incorrect to assume the rising manufacturing activity will lead to inflation.
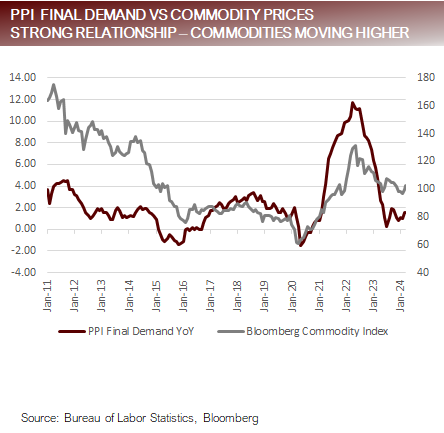
The move in ISM Manufacturing New Orders is not as concerning as the move in Commodities
Employment week continued to feed into Fed labor supply story
- Major employment reports last week included:
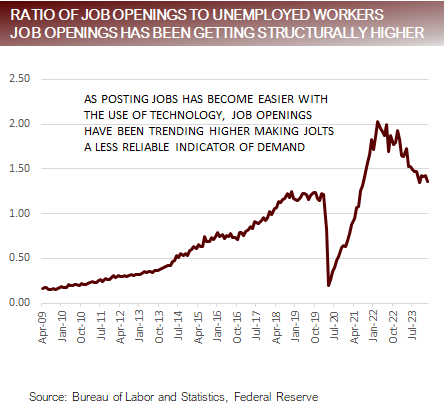
- Job Openings were revised slightly lower last month and were consistent in the current month at 8756k. This leaves the Job Openings to Unemployed Workers Ratio at 1.36, below the peak in March of 2022 of 2.03, but well in excess of the five years prior to the pandemic of0.92. This could possibly reflect the relative easy of adding a job posting with the increased use of technology.
- Nonfarm Payrolls came in very strong at 303k workers. To put this in context, there were 65 economist surveyed by Bloomberg, with an average forecast of 209k. The high forecast was 290k, with second highest at 250k, making 303k a blowout number.
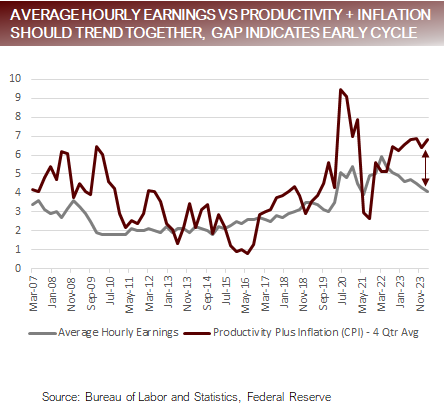
- Average Hourly Earnings year-over-year came in at 4.1%, continuing the trend lower and now at the lowest annual pace of growth since June of 2021. Although this is still elevated versus the pre-pandemic rate of between 3.0% and 3.5%, the argument is that for wage growth to be at steady state it should be equivalent to roughly the rate of inflation plus productivity, which today would be around 4.0%. The current gap in productivity over wage growth is a trend usually exhibited in the early cycle period, immediately following a recession.
- Initial Jobless Claims came in at 221k, well below the level that would be consistent with steady state employment, which is about 260k
- The Unemployment Rate met expectations, falling from 3.9% to 3.8%, and Average Weekly Hours increased a fraction from 34.3 to 34.4.
- The Labor Participation Rate moved higher from 62.5% to 62.7%, beating expectations. This is important because the Fed has stated that they believe increased demand for labor can be sustained without inflationary wage pressures is because there is a corresponding increase in supply of labor.
- Increased supply of labor is being driven by a number of factors, including:
- Larger than expected immigration
- The recent uptick in Labor Participation from the 16-24 year old and 55+ cohorts
- According to ZipRecruiter responses to job applications on their site are up 10% YoY
Accounting for structural factors job opens may be close to normalizing at current levels
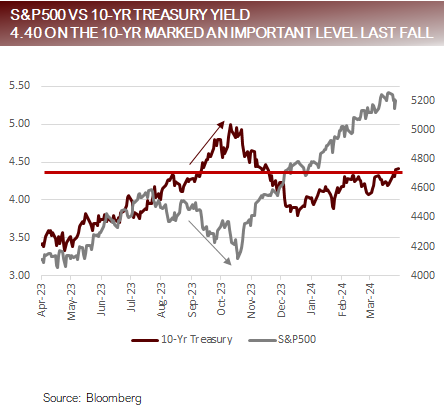
The 10-year Treasury flirts with the danger zone; next move be about fear or acceptance?
- On Friday, the 10-year Treasury closed at 4.40. In September the 10-year Treasury breached 4.40 on 9/20/23. That day the S&P500 was 4402.20. Over the course of the next month and change, the S&P500 traded to an ultimate interim low of 4117.37, down about -6.5%.
- The move lower in equities was triggered by a rapid move in expectations interest rate cuts by the Fed driven by a short-term resurgence in inflation. On 8/8/23, the WIRP function on Bloomberg, which tracks the forward curve structure of Fed Funds using a proprietary futures model, indicated that the expected rate cuts through the end of 2024 were 5.43. By 9/20/23 those expectations had been cut to 2.26. If each cut represents 25 bps, that means market participants were expecting between 5 and 6 cuts, and that fell to between 2 and 3 cuts. This induced a selloff in bonds and a corresponding selloff in equities.
- The selloff in bonds in the August / September market tantrum saw the 10-year Treasury yield move from 4.02 on 8/8/23 to 4.99 on 10/19/23.
- Fast forward to March of 2024. The WIRP function on Bloomberg, reached as high as 6.71 on 1/12/24, and has since collapsed to 2.50. A similar move to the August / September market tantrum.
- The 10-year Treasury has just breached 4.40. Now the question are:
- Will the 10-year continue on the same course driven by hotter than expected inflation data?
- Will the disinflationary trends resume, opening a door the markets rethinking rate cut expectations?
- Or, will the market accept the notion of higher rates, as the Fed seems to have by beginning to inch up their long-term rate expectations in the last Summary of Economic Projections?
As expectations for rate cuts have fallen Treasury rates have drifted into danger zone
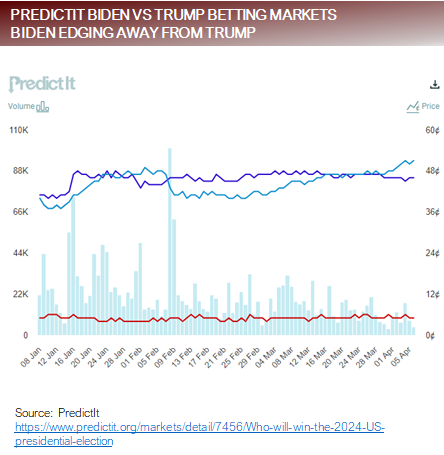
Presidential Election 2024 Update
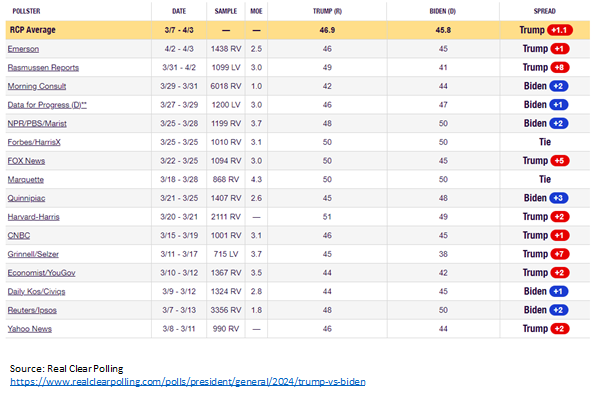
- The summary from Real Clear Polling indicates, with third-party candidates on the ballot, Trump currently in the lead with 46.9% going to Trump and 45.8% going to Biden.
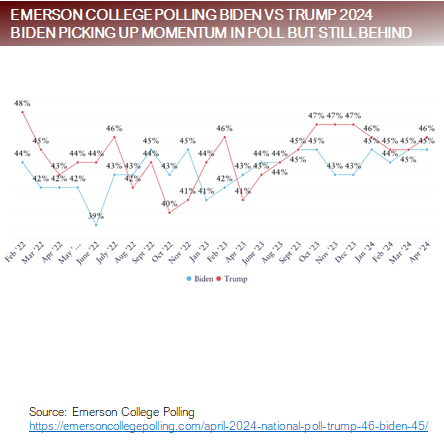
- This week Emerson College noted in their commentary that including people who were termed “very likely voters”, that Biden comes out with a 1% edge over Trump.
- There are two wildcards: The 6% of voters who are undecided and the 8% who are supporting Robert Kennedy, who are thought to be drawing votes from Biden.
- Betting markets on the other hand, including, Betfair, PredictIt, Bet365 and William Hill, have to odds tipping slightly toward Biden.
Polling and betting markets both showing trend of Biden gaining momentum
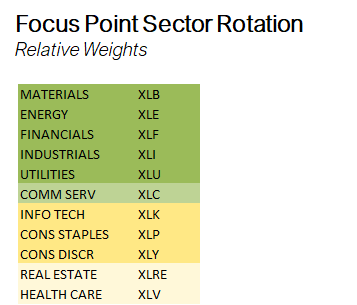
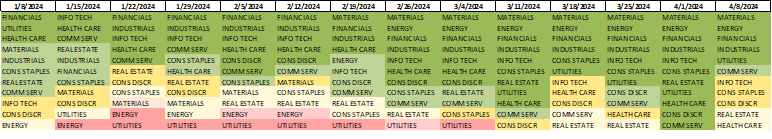
Sector Rotation Heat Map
- The Focus Point Sector Rotation Model is a combined trend following and mean reversion model that utilizes seven factors to analyze daily price data on sectors to determine the strength of upward trends.
- The S&P500 had its second worst week of 2024 last week, generating a significant falloff of positive trends in multiple sectors.
- Materials, Energy, Financials and Industrials have been the bell weather positive trending sectors all year.
- A common theme is emerging for top trending sectors, commodity inflation and manufacturing resurgence.
Putting it all together
- The trends that are driving markets right now include:
- A vibrant labor market that is supporting spending
- A revival in the manufacturing sector combined with supply concerns boosting commodities and their stock proxies
- Dissipating disinflationary trends of late 2023
- Questioning of the Fed’s resolve to cut rates in the face of stable employment and unstable price stability
- The Fed has a dual mandate of full employment and price stability. The data, as it’s unfolding today, indicates the scale tips toward being more vigilant about price stability than concerned about full employment.
- Today’s markets are setting up almost identically to the fall of 2023, when inflation jitters caused investors to regauge expectations for rate cuts in 2024, sending Treasury yields higher and the S&P500 lower. At the time we continually used the metaphor that the equity markets were following the bond markets around like a star struck lover, every time rates spiked higher the equity markets would follow lower.
- What’s may be different this time is that markets may be following the Feds lead and are quietly coming to consider baseline higher rates a possibility. It’s too early to tell if this will be the change that keeps the equity rally alive this round.
- With the 10-year tittering on at ledge at 440, CPI on Wednesday, PPI on Thursday, and the banks, including JPMorgan, Citi, Wells Fargo and State Street reporting on Friday, the markets will get a lot of information on inflation and trajectory of earnings in Q1 this week and likely begin to shift the narrative one way or the other.
For more news, information, and analysis, visit the Innovative ETFs Channel.
DISCLOSURES AND IMPORTANT RISK INFORMATION
Performance data quoted represents past performance, which is not a guarantee of future results. No representation is made that a client will, or is likely to, achieve positive returns, avoid losses, or experience returns similar to those shown or experienced in the past.
Focus Point LMI LLC
For more information, please visit www.focuspointlmi.com or contact us at [email protected] Copyright 2024, Focus Point LMI LLC. All rights reserved.
The text, images and other materials contained or displayed on any Focus Point LMI LLC Inc. product, service, report, e-mail or web site are proprietary to Focus Point LMI LLC Inc. and constitute valuable intellectual property and copyright. No material from any part of any Focus Point LMI LLC Inc. website may be downloaded, transmitted, broadcast, transferred, assigned, reproduced or in any other way used or otherwise disseminated in any form to any person or entity, without the explicit written consent of Focus Point LMI LLC Inc. All unauthorized reproduction or other use of material from Focus Point LMI LLC Inc. shall be deemed willful infringement(s) of Focus Point LMI LLC Inc. copyright and other proprietary and intellectual property rights, including but not limited to, rights of privacy. Focus Point LMI LLC Inc. expressly reserves all rights in connection with its intellectual property, including without limitation the right to block the transfer of its products and services and/or to track usage thereof, through electronic tracking technology, and all other lawful means, now known or hereafter devised. Focus Point LMI LLC Inc. reserves the right, without further notice, to pursue to the fullest extent allowed by the law any and all criminal and civil remedies for the violation of its rights.
All unauthorized use of material shall be deemed willful infringement of Focus Point LMI LLC Inc. copyright and other proprietary and intellectual property rights. While Focus Point LMI LLC will use its reasonable best efforts to provide accurate and informative Information Services to Subscriber, Focus Point LMI LLC but cannot guarantee the accuracy, relevance and/or completeness of the Information Services, or other information used in connection therewith. Focus Point LMI LLC, its affiliates, shareholders, directors, officers, and employees shall have no liability, contingent or otherwise, for any claims or damages arising in connection with (i) the use by Subscriber of the Information Services and/or (ii) any errors, omissions or inaccuracies in the Information Services. The Information Services are provided for the benefit of the Subscriber. It is not to be used or otherwise relied on by any other person. Some of the data contained in this publication may have been obtained from The Federal Reserve, Bloomberg Barclays Indices; Bloomberg Finance L.P.; CBRE Inc.; IHS Markit; MSCI Inc. Neither MSCI Inc. nor any other party involved in or related to compiling, computing or creating the MSCI Inc. data makes any express or implied warranties or representations with respect to such data (or the results to be obtained by the use thereof), and all such parties hereby expressly disclaim all warranties of originality, accuracy, completeness, merchantability or fitness for a particular purpose with respect to any of such data. Such party, its affiliates and suppliers (“Content Providers”) do not guarantee the accuracy, adequacy, completeness, timeliness or availability of any Content and are not responsible for any errors or omissions (negligent or otherwise), regardless of the cause, or for the results obtained from the use of such Content. In no event shall Content Providers be liable for any damages, costs, expenses, legal fees, or losses (including lost income or lost profit and opportunity costs) in connection with any use of the Content. A reference to a particular investment or security, a rating or any observation concerning an investment that is part of the Content is not a recommendation to buy, sell or hold such investment or security, does not address the suitability of an investment or security and should not be relied on as investment advice.
This communication reflects our analysts’ current opinions and may be updated as views or information change. Past results do not guarantee future performance. Business and market conditions, laws, regulations, and other factors affecting performance all change over time, which could change the status of the information in this publication. Using any graph, chart, formula, model, or other device to assist in making investment decisions presents many difficulties and their effectiveness has significant limitations, including that prior patterns may not repeat themselves and market participants using such devices can impact the market in a way that changes their effectiveness. Focus Point LMI LLC believes no individual graph, chart, formula, model, or other device should be used as the sole basis for any investment decision. Focus Point LMI LLC or its affiliated companies or their respective shareholders, directors, officers and/or employees, may have long or short positions in the securities discussed herein and may purchase or sell such securities without notice. Neither Focus Point LMI LLC nor the author is rendering investment, tax, or legal advice, nor offering individualized advice tailored to any specific portfolio or to any individual’s particular suitability or needs. Investors should seek professional investment, tax, legal, and accounting advice prior to making investment decisions. Focus Point LMI LLC’s publications do not constitute an offer to sell any security, nor a solicitation of an offer to buy any security. They are designed to provide information, data and analysis believed to be accurate, but they are not guaranteed and are provided “as is” without warranty of any kind, either express or implied.
FOCUS POINT LMI LLC DISCLAIMS ANY AND ALL EXPRESS OR IMPLIED WARRANTIES, INCLUDING, BUT NOT LIMITED TO, ANY WARRANTIES OF MERCHANTABILITY, SUITABILITY OR FITNESS FOR A PARTICULAR PURPOSE OR USE.
Focus Point LMI LLC, its affiliates, officers, or employees, and any third-party data provider shall not have any liability for any loss sustained by anyone who has relied on the information contained in any Focus Point LMI LLC publication, and they shall not be liable to any party for any direct, indirect, incidental, exemplary, compensatory, punitive, special or consequential damages, costs, expenses, legal fees, or losses (including, without limitation, lost income or lost profits and opportunity costs) in connection with any use of the information or opinions contained Focus Point LMI LLC publications even if advised of the possibility of such damages.
