
As the S&P 500 has flip-flopped between red and green, the timing couldn’t be more auspicious for the Invesco S&P 500 Low Volatility ETF (SPLV), which now has 10 years of performance under its belt.
The fund is based on the S&P 500® Low Volatility Index and seeks to invest at least 90% of its total assets in common stocks that comprise the Index. The index is compiled, maintained, and calculated by Standard and Poor’s and consists of the 100 stocks from the SP 500 Index with the lowest realized volatility over the past 12 months.
Volatility is a statistical measurement of the magnitude of up-and-down asset price fluctuations over time. The fund and the index are re-balanced and reconstituted quarterly in February, May, August, and November.
Since the fund’s inception date of May 5, 2011, the fund has reached some major milestones. For one, SPLV has exhibited 19% less volatility (11.03% v. 13.65%), a beta of 0.65, versus the S&P 500.
The fund’s low volatility strategy during a downturn doesn’t mean it sacrifices performance in an upturn. SPLV can perform during market rallies while mitigating risk during extreme sell-offs with a 69.7% up capture and 55.9% down capture ratio.
With 10 years of performance data available, the fund has proven its mettle in the past. SPLV has outperformed the S&P 500 by an average of 3.90% (-6.24% to -10.14%) in 19 of 21 periods where the S&P 500 declined by 5% or more with a 90.5% win rate (19 of 21 occurrences).

A Time-Tested Strategy
If the last 10 years of performance wasn’t enough, an Indexology blog by S&P Dow Jones Indices, back-tested the viability of the index that SPLV tracks all the way to the early 70s. What they found was that the low volatility index was able to stand the test of time.
“We recently extended the returns history for the S&P 500 Low Volatility Index back to February 1972, giving us nearly five decades of insight into the factor’s performance and characteristics,” the blog noted.
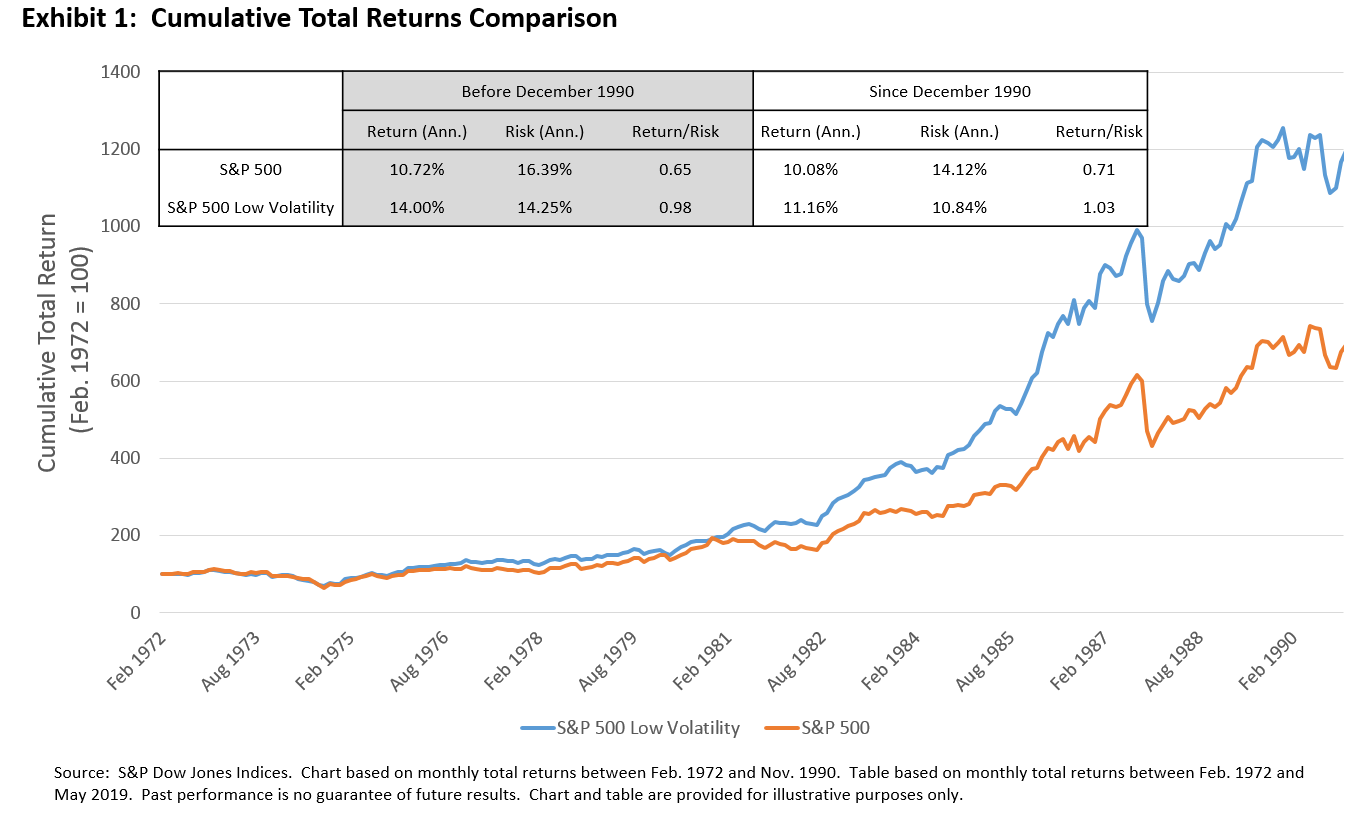
“Exhibit 1 shows that S&P 500 Low Volatility Index outperformed the U.S. equity benchmark between February 1972 and November 1990, both in absolute terms and on a risk-adjusted basis,” the blog explained. “Its higher annualized returns and lower volatility than the S&P 500 resulted in a risk/reward ratio of 0.98, which was similar to the ratio observed during the latter period. Hence, the S&P 500 Low Volatility’s returns were similarly compensated for the risks being taken in the 1970s and 1980s compared to the period since December 1990.”
Next, the low volatility index’s performance was analyzed within three distinct time periods.
“Exhibit 2 provides a breakdown of the S&P 500 and the S&P 500 Low Volatility indices’ returns over three horizons: from February 1972 to May 2019, between February 1972 and November 1990, and between December 1990 and May 2019. Up and down months are based on S&P 500’s monthly total returns,” the blog added.
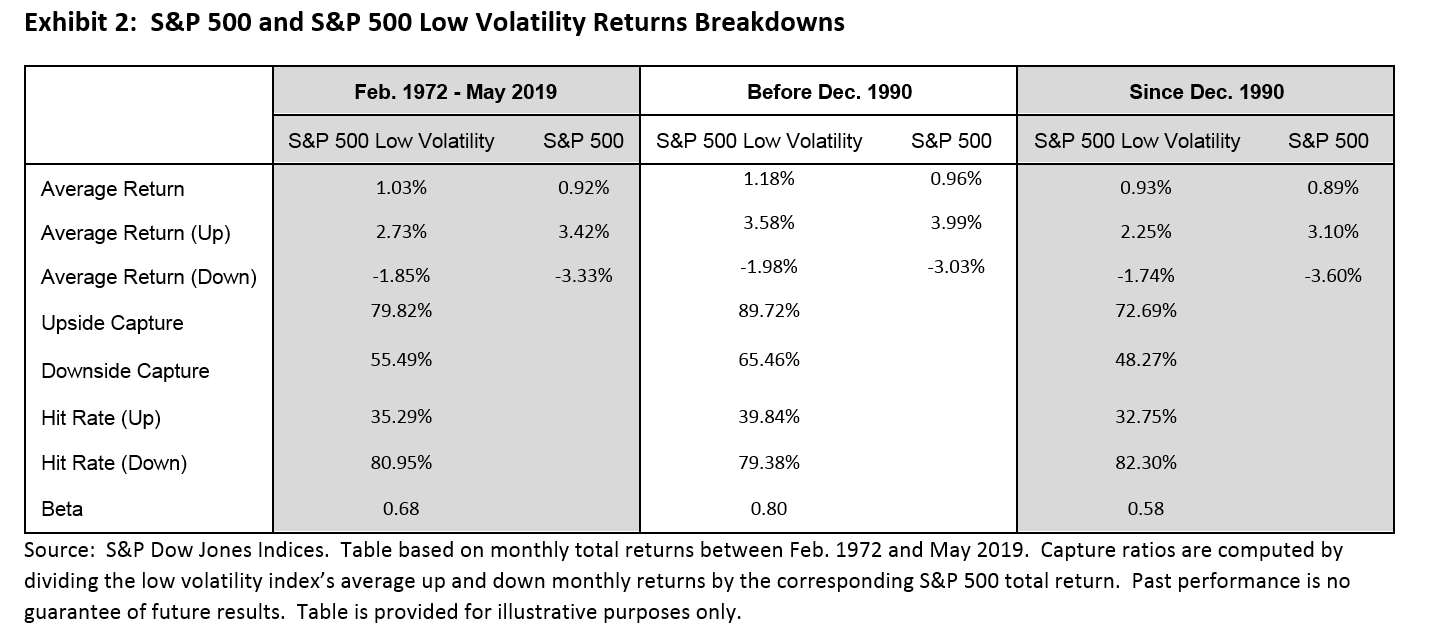
All in all, it shows that a low volatility strategy can hold up over a long-term horizon.
“As a result, the key characteristics of low volatility indices remained intact over the four decades of (back-tested) index history: the S&P 500 Low Volatility Index displayed its usual asymmetric risk/return characteristics of upside participation and downside protection,” the blog concluded.
For more news and information, visit the Innovative ETFs Channel.
