The Invesco S&P 500 Quality ETF (SPHQ) has maintained investor interest throughout 2023 to date.
SPHQ, which has $5.1 billion in assets under management, has seen the third-greatest net flows year-to-date across Invesco’s lineup of ETFs. The fund has accreted $1.1 billion year-to-date as of June 5, hauling in $193 million in net flows over a one-month period.
“Given the market uncertainty, advisors have turned to high-quality companies with consistent earnings and strong balance sheets. A diversified portfolio of blue-chip companies has been in vogue,” Todd Rosenbluth, head of research at VettaFi, said.
Quality was the third top-performing factor in May across the S&P 500 factor index family, lagging growth and high beta. Quality is also the third top-performing factor year-to-date, slightly underperforming the parent index.
SPHQ tracks the S&P 500 Quality index. The index is designed to track the 100 stocks in the S&P 500 with the highest-quality score, which is calculated based on return on equity, accruals ratio, and financial leverage ratio.
How the Quality Factor Influences Returns
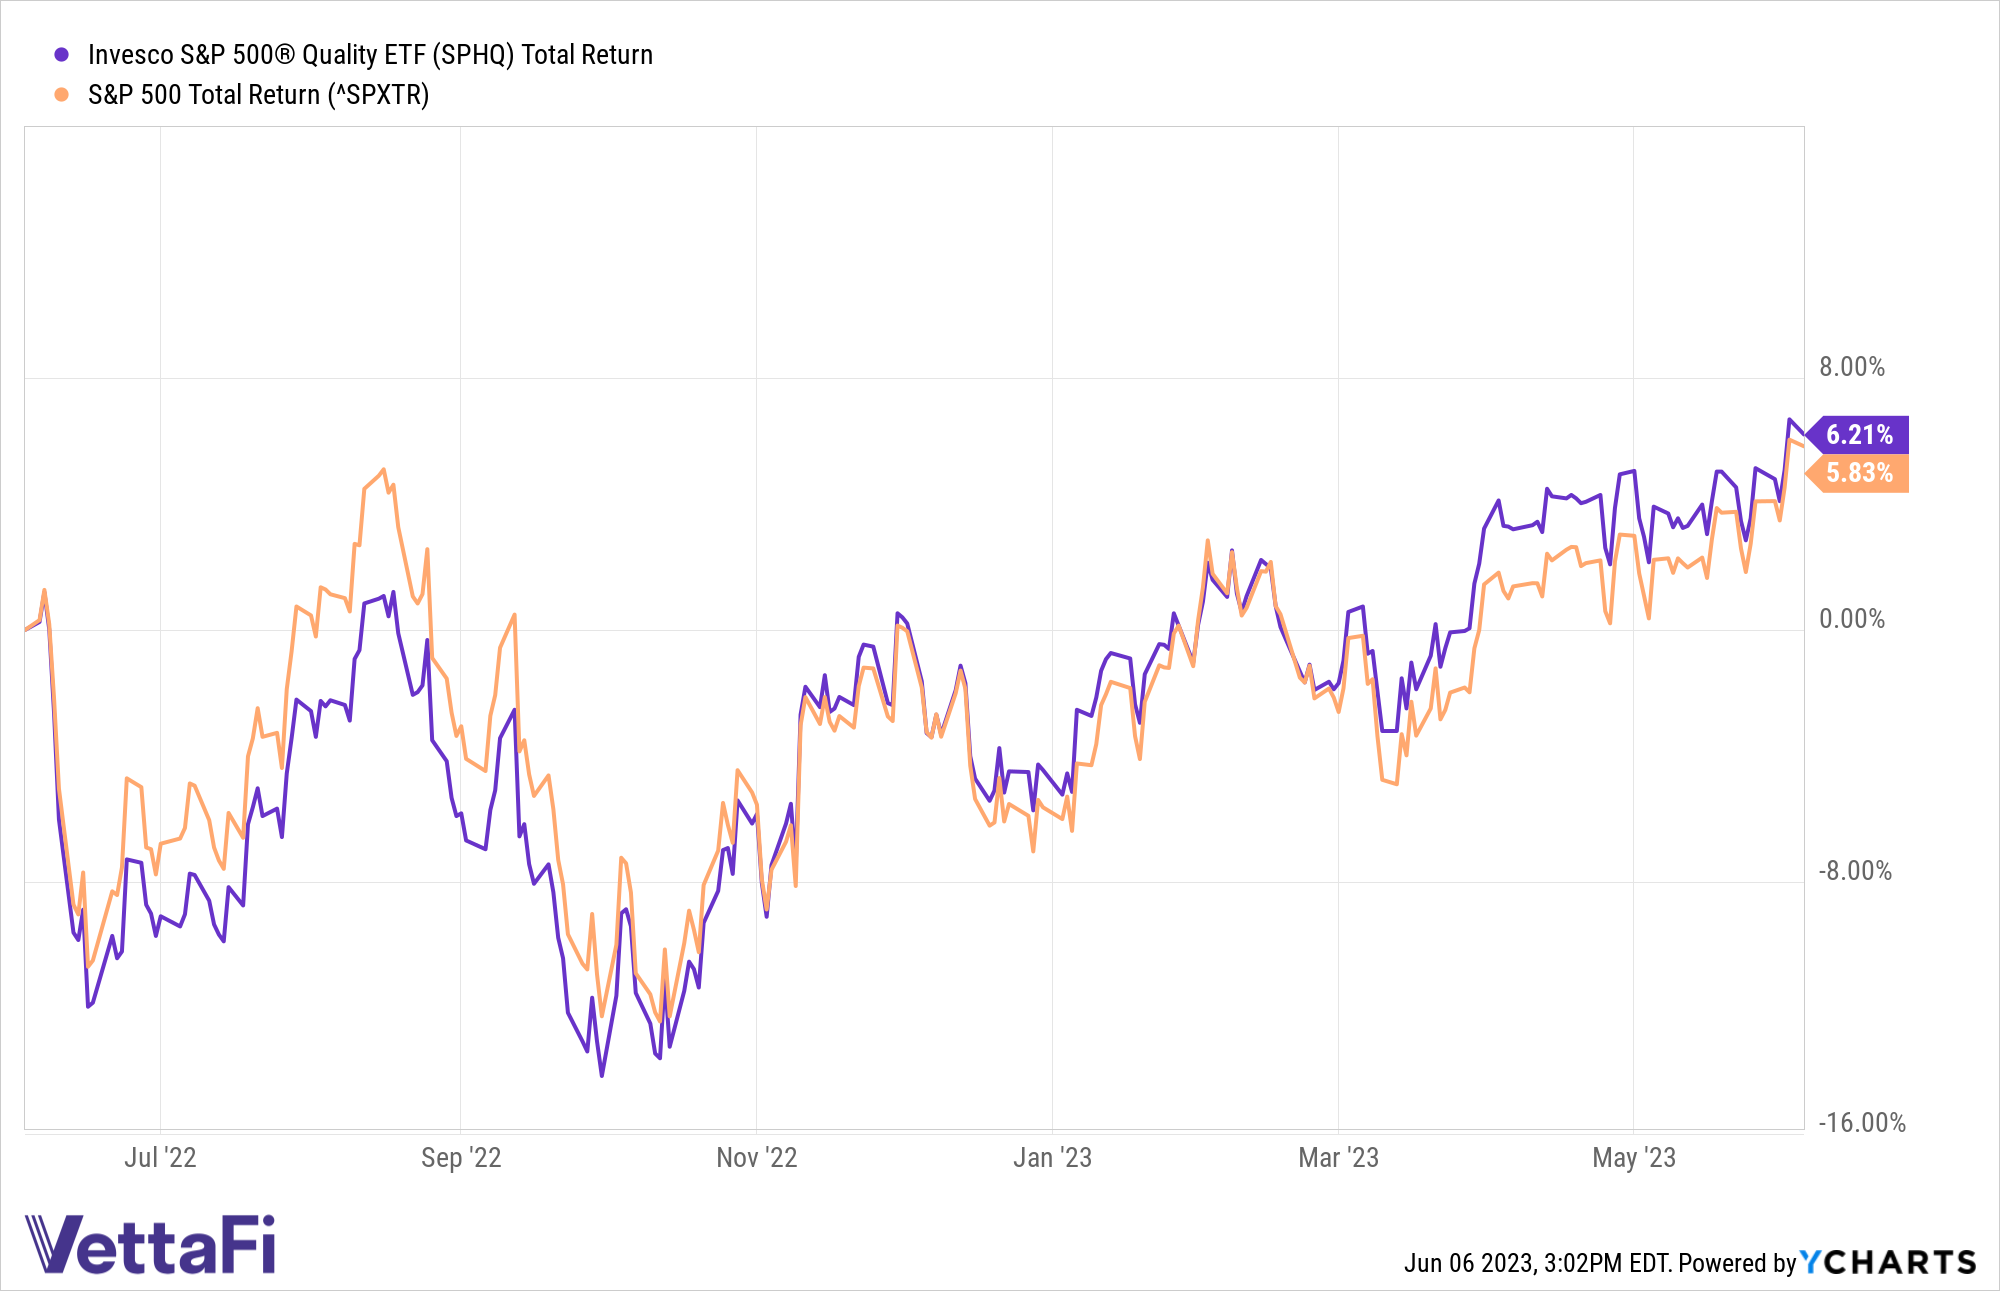
Despite its focused exposure to the quality factor, SPHQ has posted similar returns to the S&P 500 over various periods. Year-to-date as of June 5, SPHQ has climbed 11.2%, while the S&P is up 12.1%. SPHQ is slightly outperforming over a one-year period, up 6.2% compared to the 5.8% climb of the S&P 500.

The Invesco S&P 500 Quality ETF (SPHQ) compared to the benchmark
Returns are similar over longer durations as well. Over a three-year period, SPHQ has climbed 39.5% while the S&P 500 has increased 40.3%. SPHQ is modestly outperforming over a five-year period, as the quality ETF has returned 72% compared to the S&P 500’s 69.7% gain.
SPHQ introduces sector tilts to a portfolio. Compared to the benchmark S&P 500, SPHQ’s underlying index overweights the energy sector (12% versus 5%) and the consumer staples sector (12% versus 7%).
Conversely, SPHQ’s underlying index underweights the consumer discretionary sector (3% in SPHQ versus 10% in the benchmark), as well as the utilities sector (0% in SPHQ versus 3% in the benchmark).
For more news, information, and analysis, visit the Innovative ETFs Channel.


