
Economic indicators are released every week to provide insight into the overall state of the U.S. economy. Policymakers and advisors closely monitor economic indicators to understand recession risk and the direction of interest rates because the data can ultimately impact business decisions and financial markets. In the week ending on September 14th, the SPDR S&P 500 ETF Trust (SPY) rose 1.09% while the Invesco S&P 500® Equal Weight ETF (RSP) was up 0.80%. In this article, we examine indicators from the past week that shed light on both inflationary trends and sentiment within the market.
Consumer Price Index (CPI)
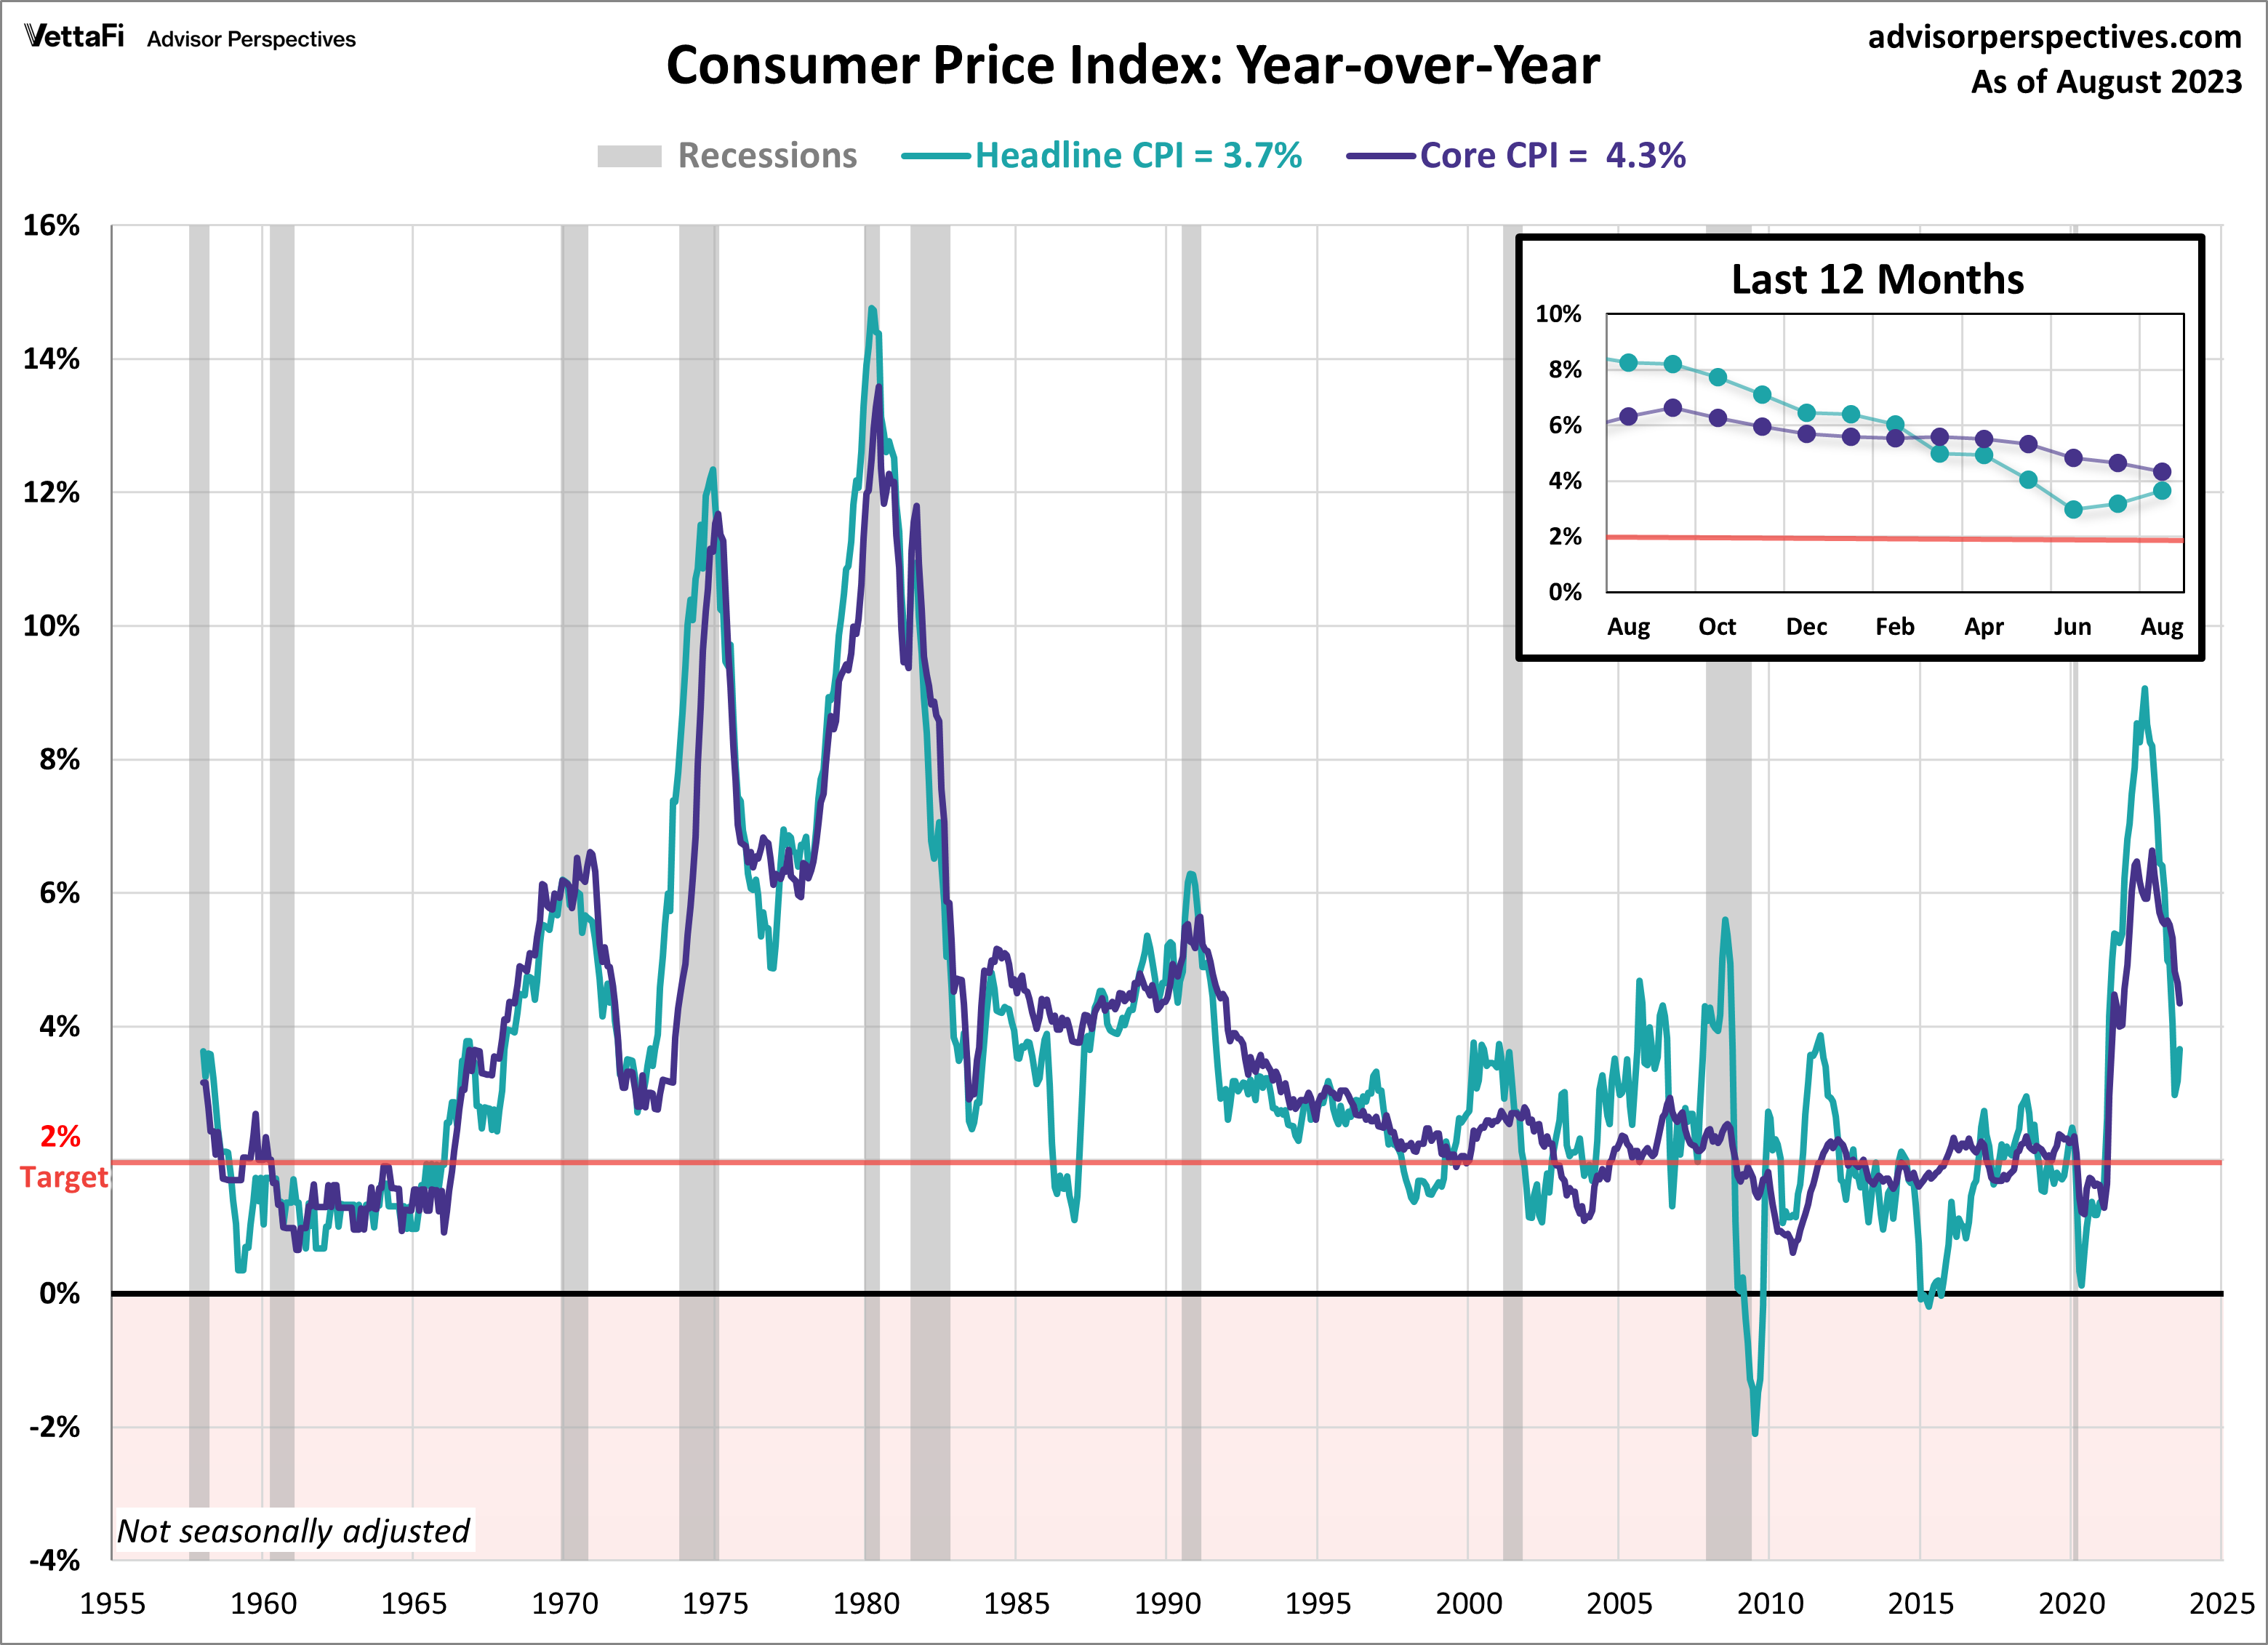
The battle against inflation rages on as consumers grapple with rising prices, particularly at the gas pump. In August, the consumer price index (CPI) rose 0.6% from July and 3.7% from one year ago, an acceleration from July’s 3.2% annual change. While an uptick in consumer prices was anticipated, the latest data revealed a slightly higher rate than the expected 3.6% forecast. The primary driver of this month’s increase can be attributed to soaring energy costs, notably the sharp spike in gas prices.
While headline CPI paints a picture of inflation heating up—this being the second consecutive month of acceleration—core CPI offers a somewhat different perspective. Core CPI, which excludes food and energy prices, slowed down in August, dropping from 4.7% to 4.3% on an annual basis. This marks the fifth consecutive month of deceleration and the lowest level since September 2021. On a monthly basis, core prices increased by 0.3% compared to July.
With headline inflation on the rise and core inflation showing a decline, all eyes remain on the Fed. At the time of writing, the CME Fed Watch tool indicates a 97% probability that the Fed will maintain rates at their current level during their September meeting. With that being said, the possibility of another rate hike later this year remains very real if the resurgence in inflation continues to gather strength.
Producer Price Index (PPI)
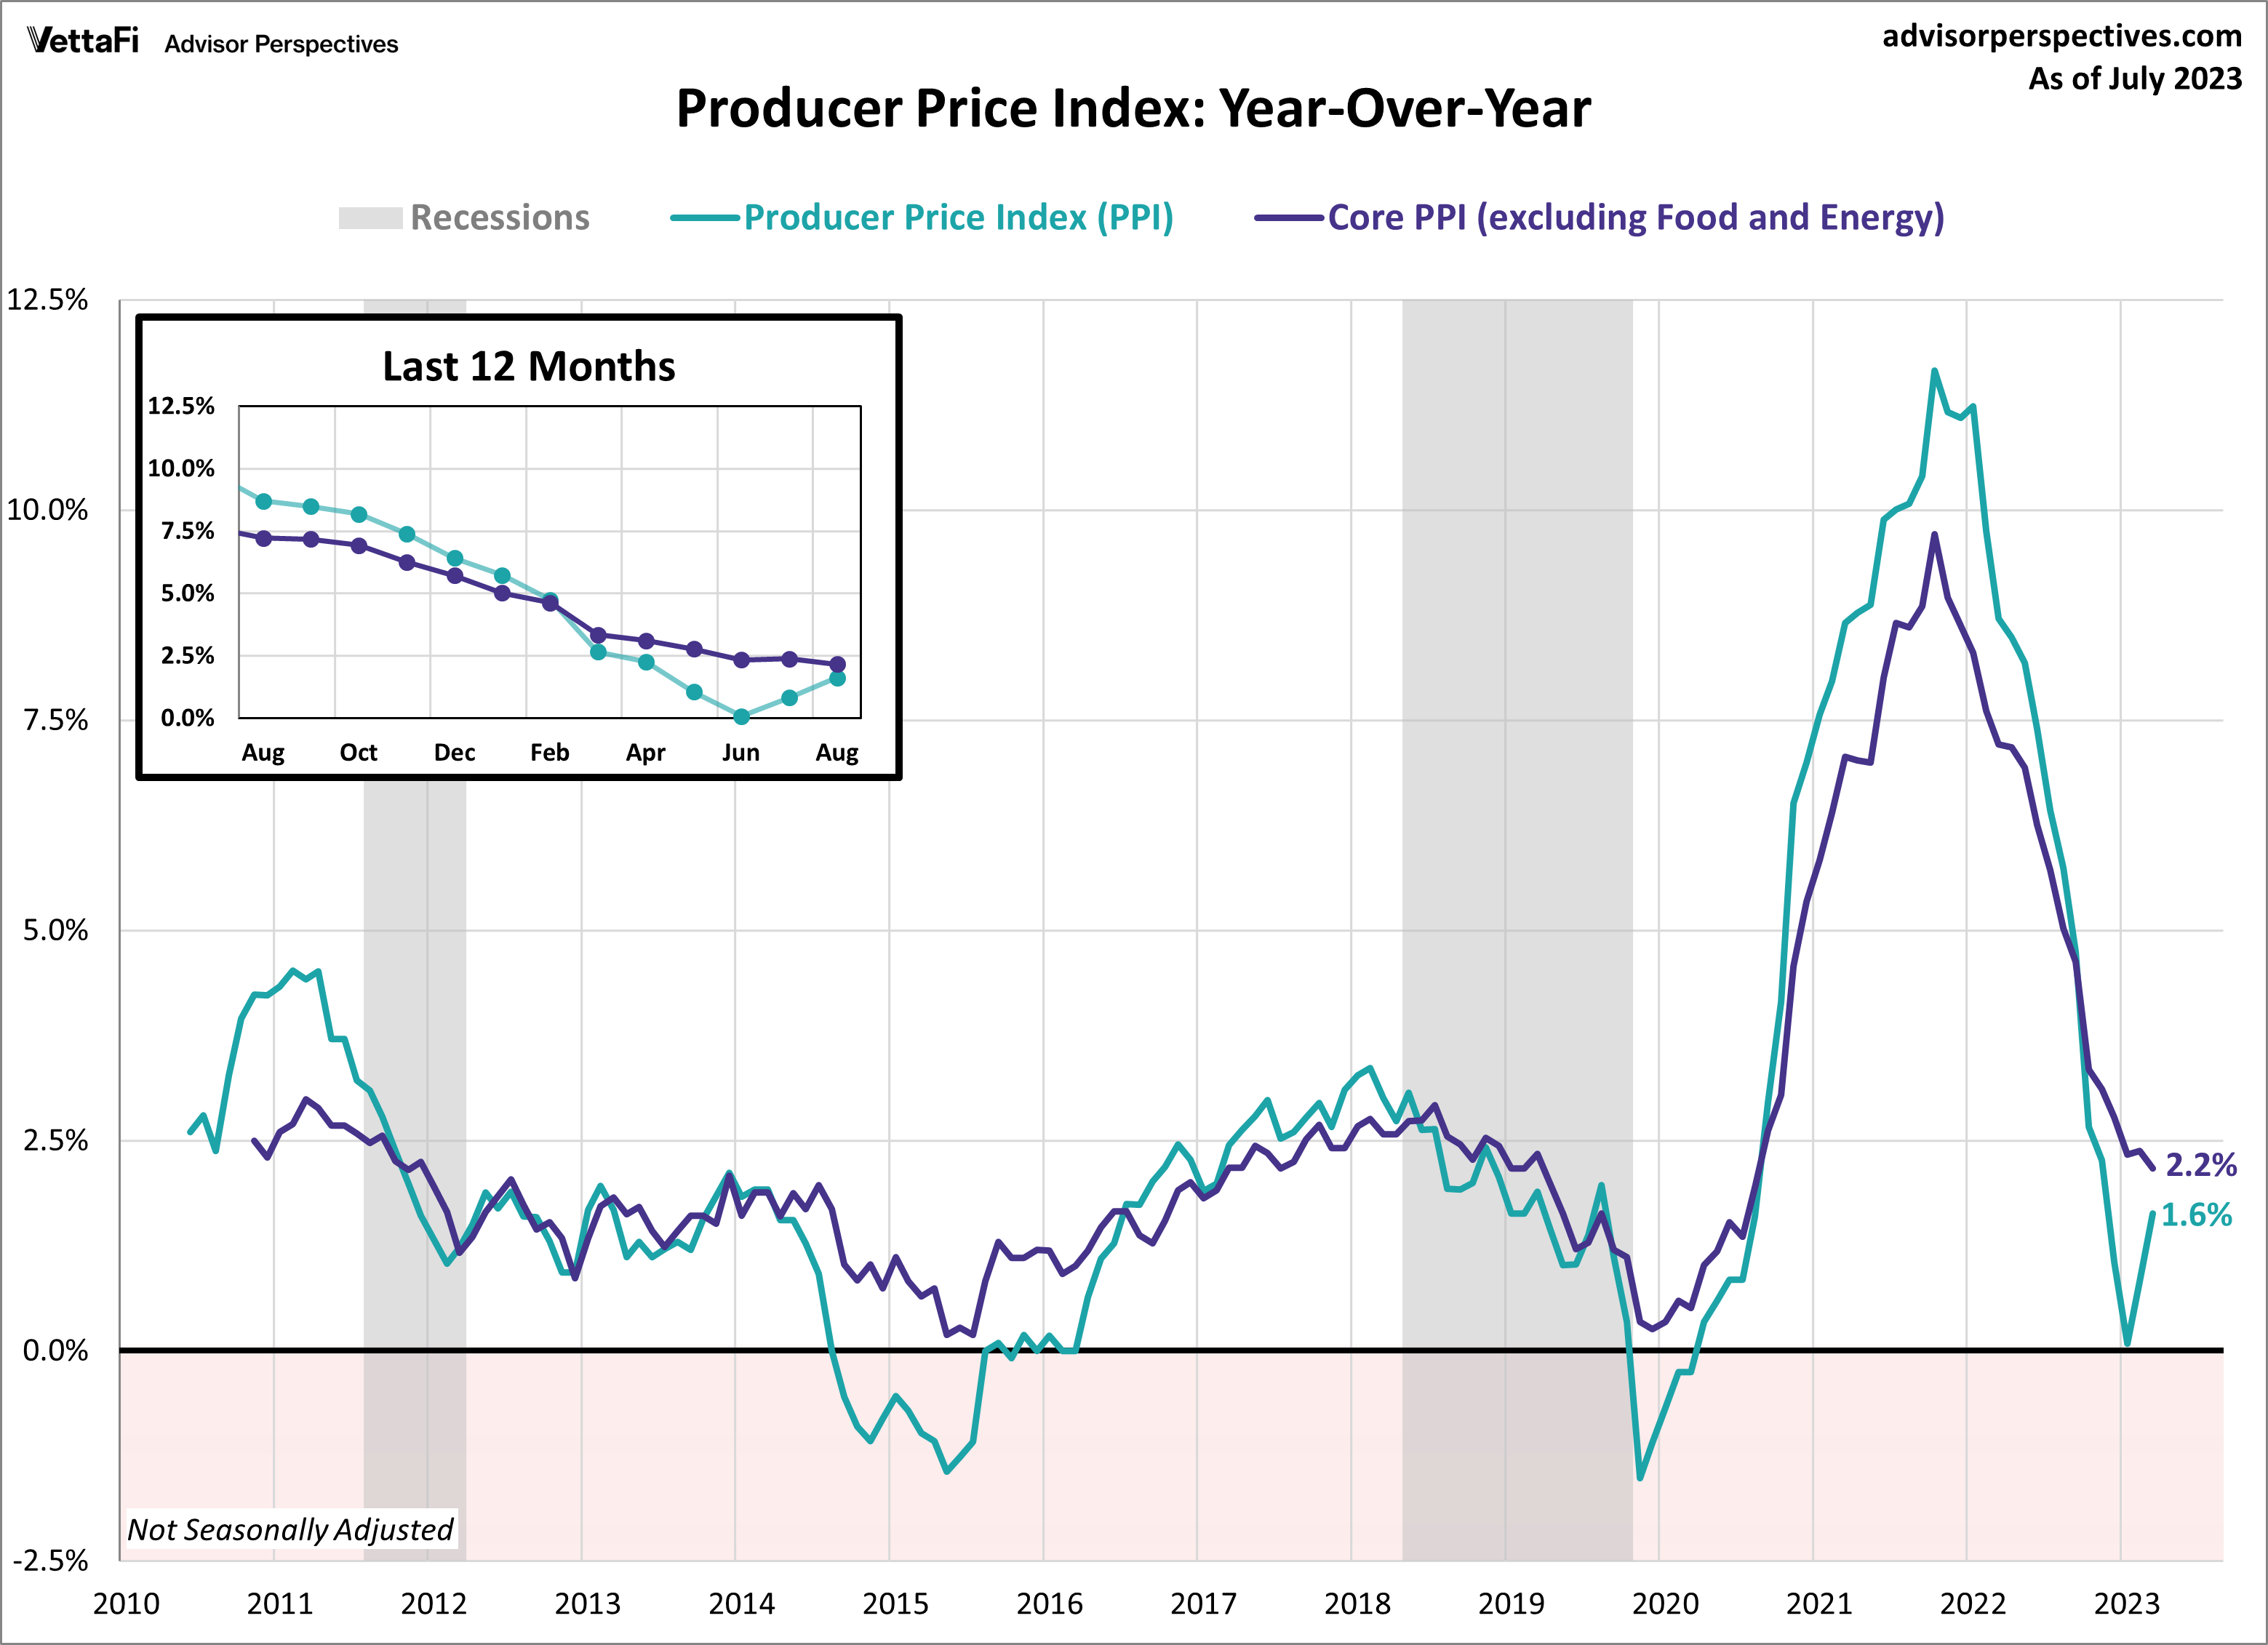
The August producer price index (PPI) provided further evidence that inflation will not go quietly into the night. Wholesale prices rose 1.6% compared to the previous year, up from last month’s 0.8% increase and higher than the projected 1.2% rise. This marked the second consecutive month of acceleration for headline PPI, a trend not witnessed since early 2022. On a monthly basis, headline PPI exhibited a 0.7% increase in wholesale prices, exceeding expectations of a 0.4% monthly rise. Meanwhile, core PPI, which excludes food and energy, met expectations with a 2.2% annual increase, down from last month’s 2.4% increase, and a 0.2% monthly rise.
The producer price index is a widely regarded leading indicator of consumer inflation, as price shifts at the producer level often trickle down to consumers. While both the PPI and the Consumer Price Index (CPI) have retreated from their peak levels in early 2022, recent months have seen a resurgence in the headline figures, largely fueled by surging energy prices. This resurgence underscores the likelihood that inflation will continue to be a prominent concern in the foreseeable future.
Michigan Consumer Sentiment
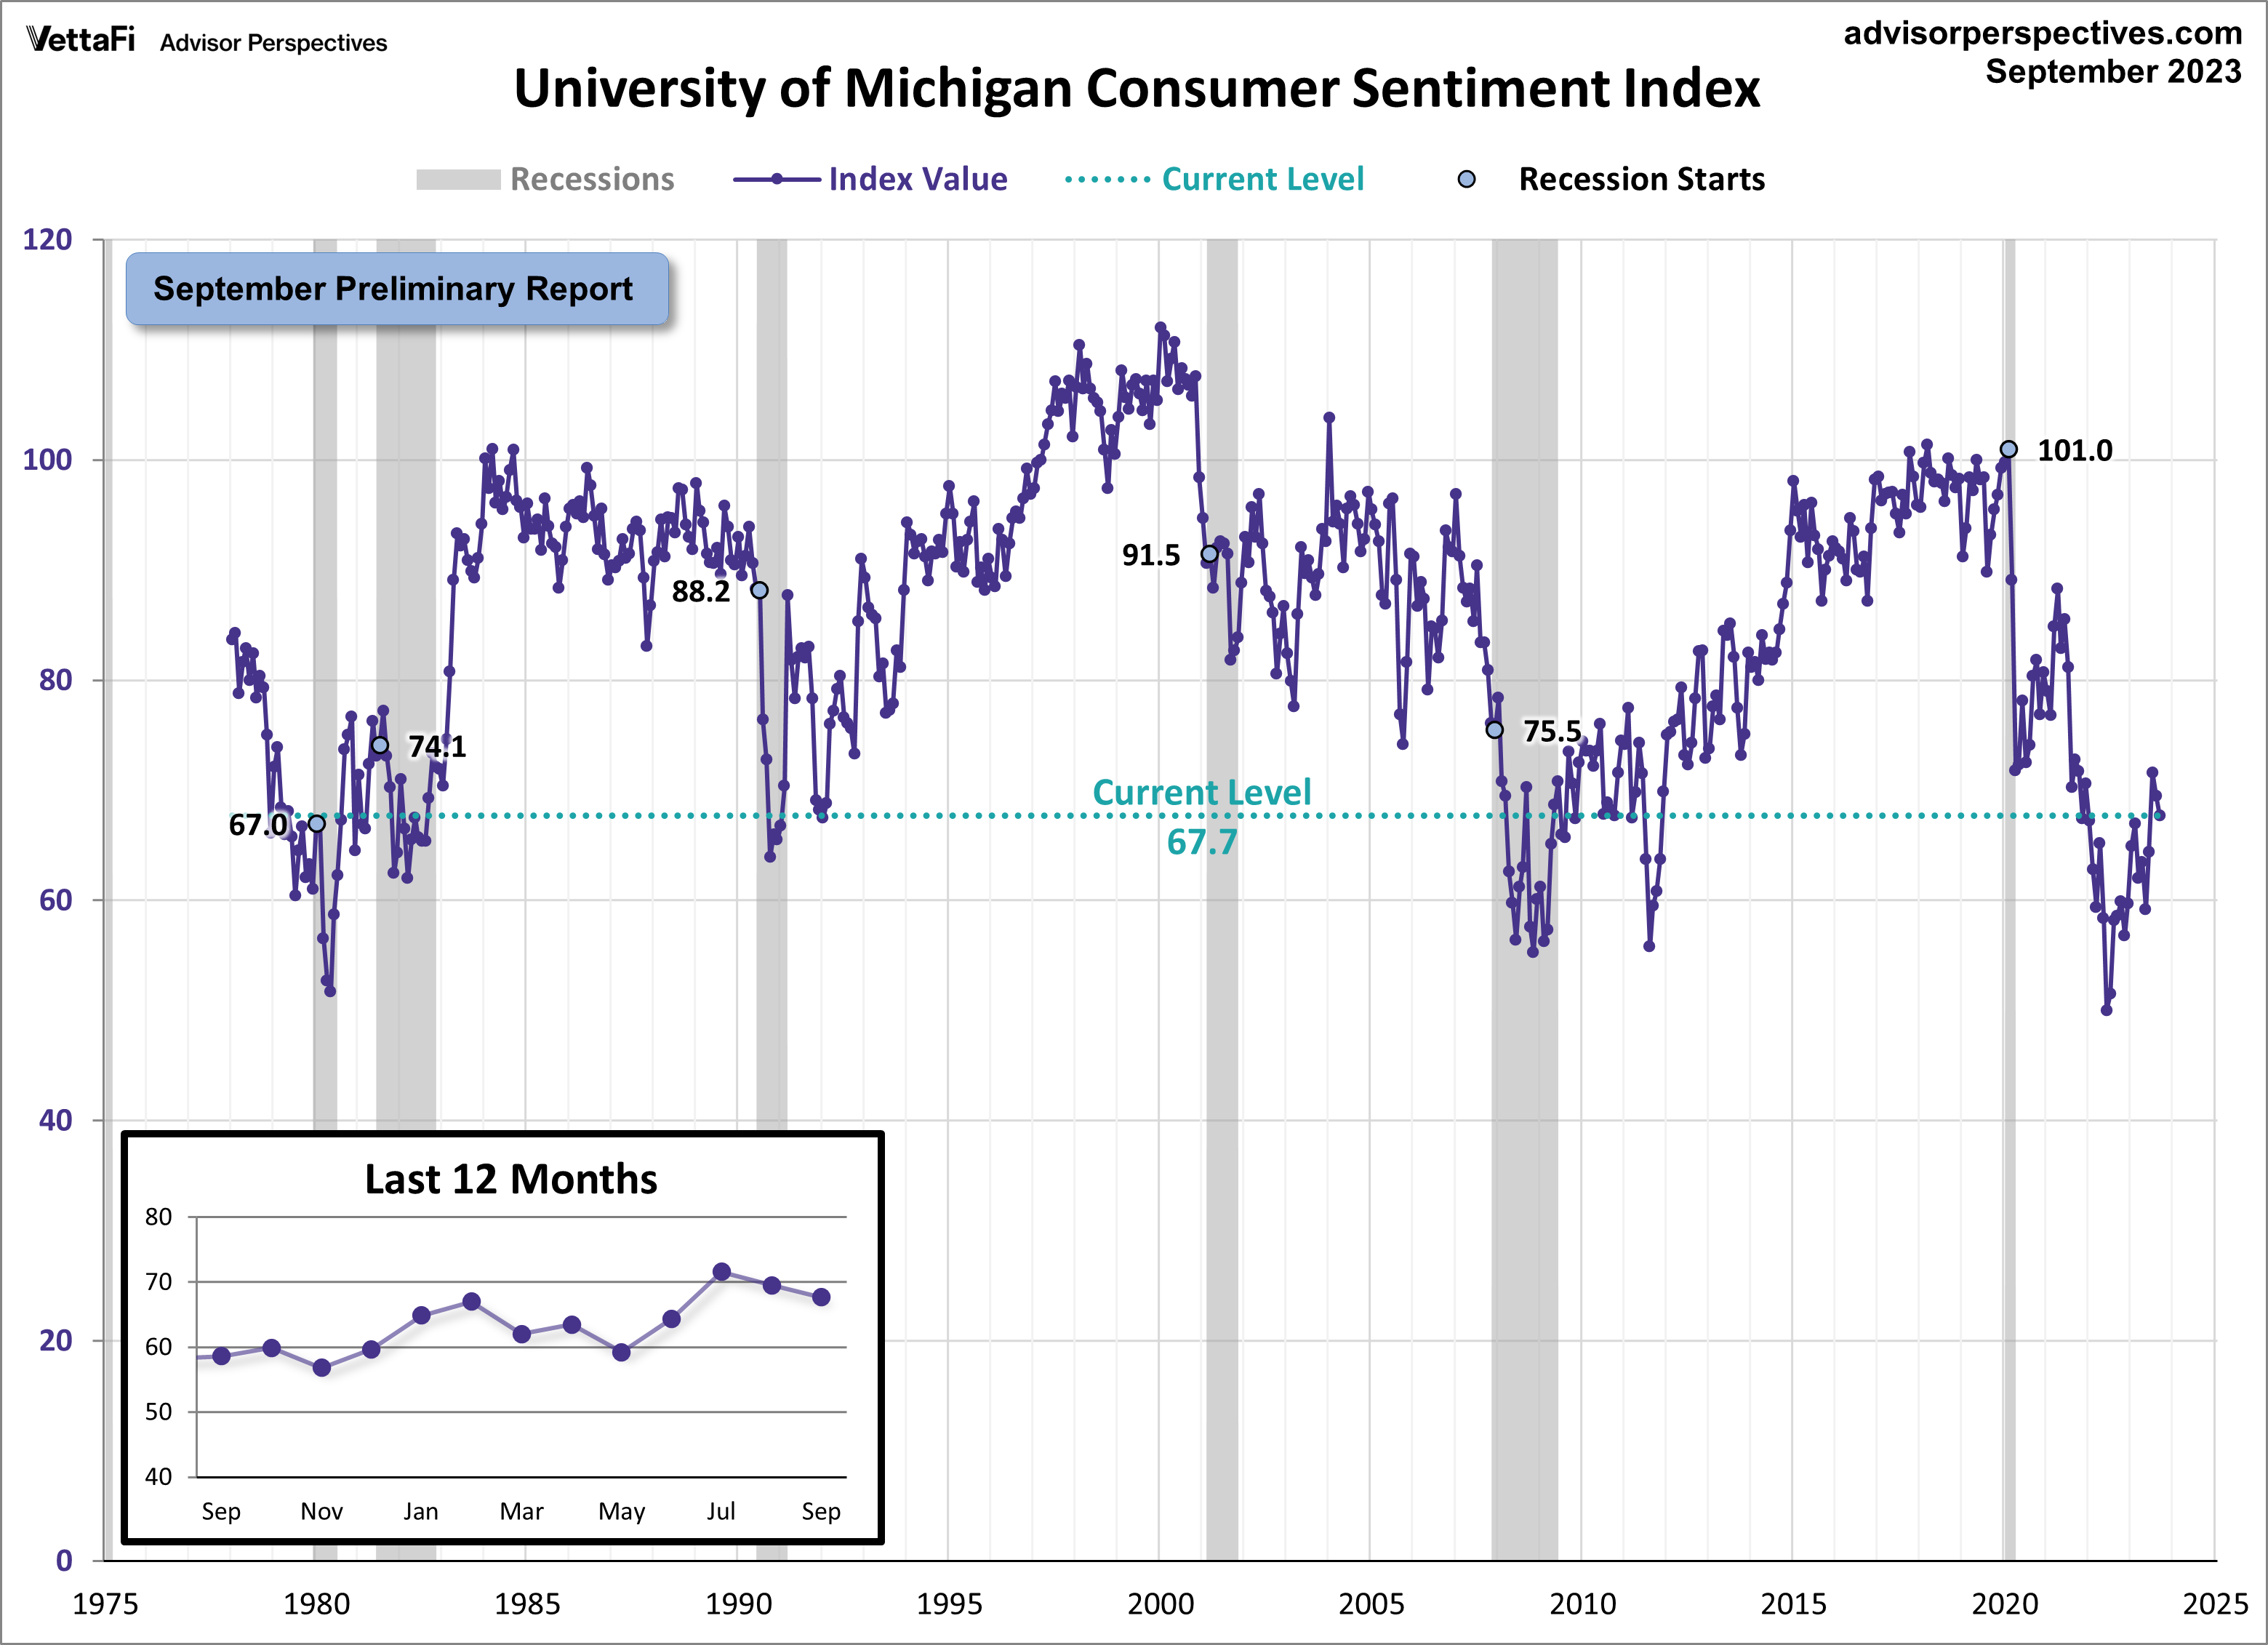
Consumers are growing more uncertain about the economy, as evidenced by the second consecutive monthly decline in the Michigan Consumer Sentiment Index. According to the September preliminary report, the index recorded a reading of 67.7, marking a 2.6% decline from August’s final reading and falls short of the forecasted value of 69.1. While consumer attitudes have improved over the past year, now standing 35% above the all-time low reached in June of the previous year, sentiment remains historically low, with the index currently situated at the 14th percentile of its historical series.
The Michigan Consumer Sentiment Index is a monthly survey measuring consumers’ opinions with regards to the economy, personal finances, business conditions, and buying conditions. In the latest report, consumers expressed increased optimism about the possibility of inflation slowing down in the coming year. However, uncertainty lingers regarding the trajectory of the economy and the potential for a government shutdown.Given that consumer spending accounts for approximately 70% of the economy, consumer attitudes are closely monitored, as their confidence levels directly impact their spending behavior and, consequently, economic growth.
The Consumer Discretionary Select Sector SPDR ETF (XLY) is tied to consumer sentiment.
NFIB Small Business Optimism Index
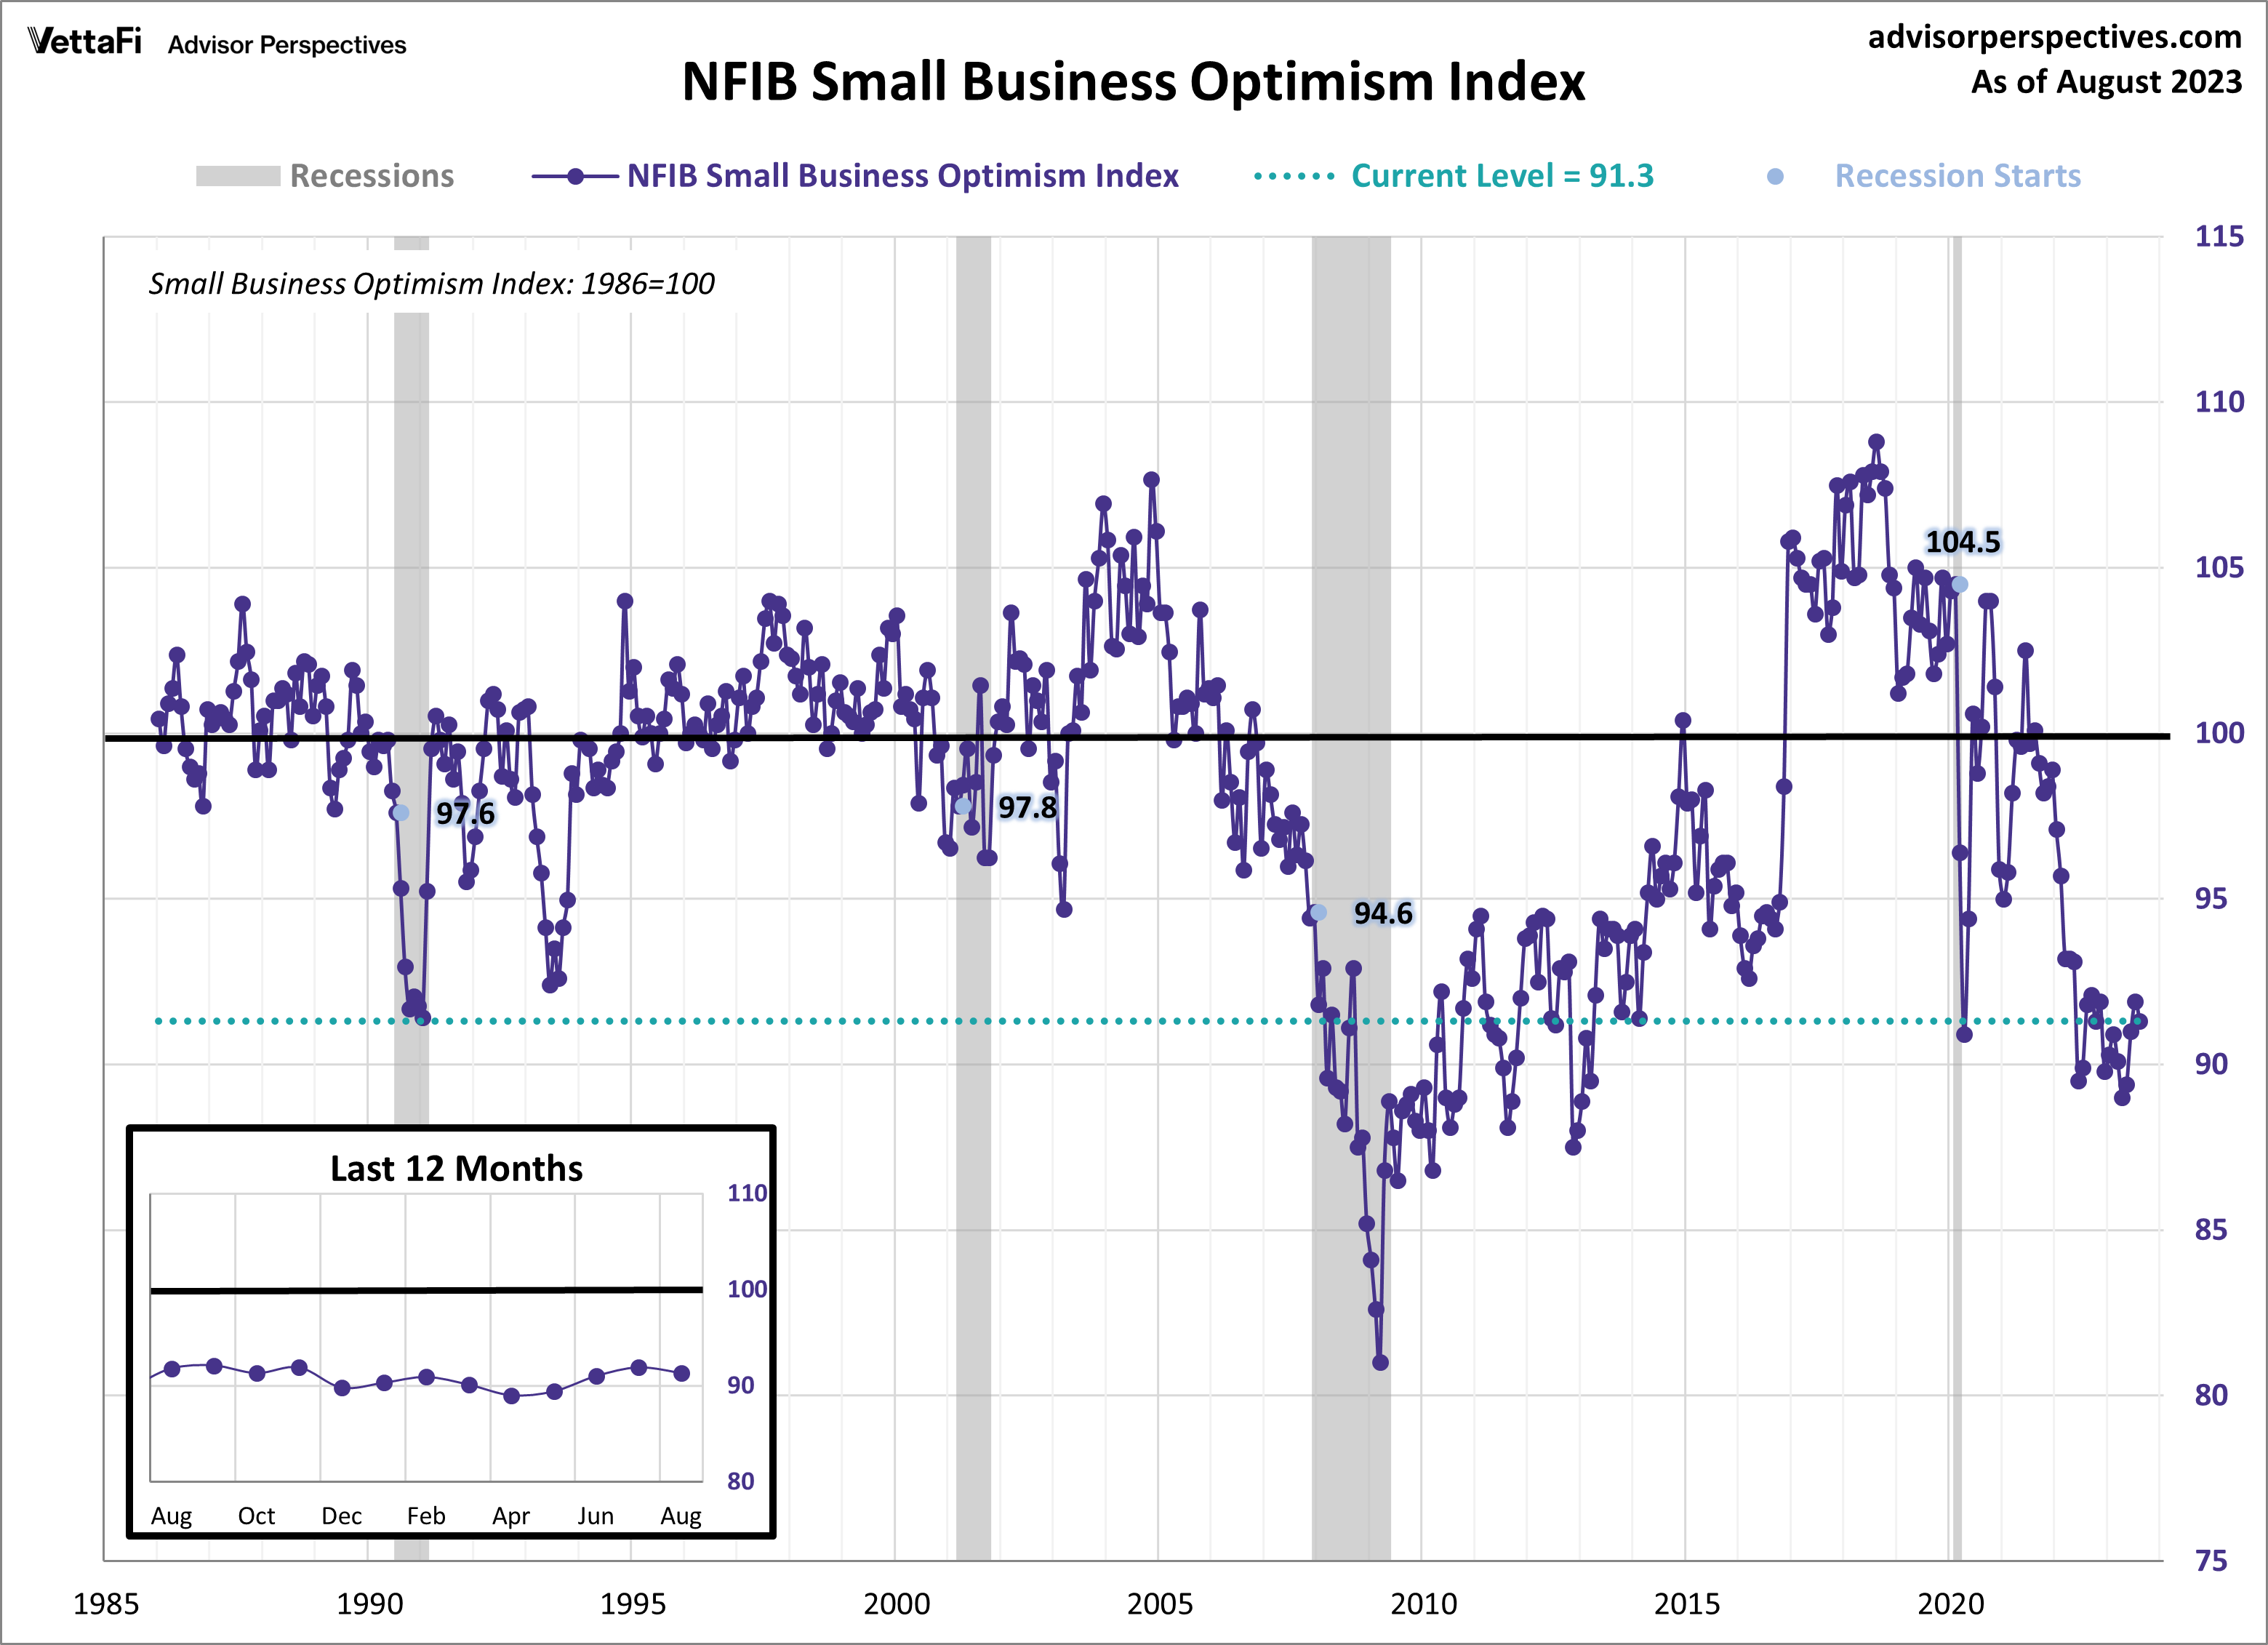
In August, optimism among small business owners continued to wane, with the NFIB Small Business Optimism Index slipping by 0.6 points to 91.3. This marks the first decline in the past four months, pushing the index down to the 11th percentile of the series and keeping it below the series average of 98.1 for the past 20 months, highlighting a prolonged period of subdued optimism.
The NFIB index serves as a composite gauge that aims to provide insight into the overall health of small businesses in the country. In the latest report, inflation and labor shortages continued to be the top concerns plaguing small business owners. Additionally, the survey unveiled a growing sense of pessimism regarding future business conditions and sales prospects.
Given that small businesses account for approximately 50% of the U.S. workforce, the well-being of the small business sector can significantly impact the wellbeing of the overall economy. Moreover, small businesses tend to be more attuned to economic shifts, offering early insights into the future trajectory of the broader economy.
Economic Indicators and the Week Ahead
All eyes will be on the housing market in the week ahead as we eagerly await the release of key housing data for August. Over the course of the week, we will receive the latest news on builder confidence in home sales, building permits, housing starts, and existing home sales. These housing market indicators will have an impact on homebuilders and residential real-estate ETFs such as iShares U.S. Home Construction ETF (ITB), SPDR S&P Homebuilders ETF (XHB), and iShares Residential and Multisector Real Estate ETF (REZ).
The National Association of Home Builders housing market index will shed light on builders’ confidence levels regarding home sales, which have recently declined due to the impact of rising mortgage rates, prompting homeowners to remain in their current residences where they’ve locked in lower rates. Building permits are forecasted to be practically unchanged from last month, while housing starts are expected to fall to a seasonally adjusted annual rate of 1.452 million. Finally, existing home sales are projected to veer from their downward trend by inching up to a seasonally adjusted annual rate of 4.10 million units, marking only the 3rd monthly increase over the last 19 months.
For more news, information, and analysis, visit the Innovative ETFs Channel.
