
Economic indicators are released every week to provide insight into the overall health and performance of an economy. They are essential tools for policymakers, advisors, investors, and businesses because they allow them to make informed decisions regarding business strategies and financial markets. In the week ending November 16, the S&P SPDR S&P 500 ETF Trust (SPY) rose 3.78 %, while the Invesco S&P 500 Equal Weight ETF (RSP) was up 4.07%.
This article highlights three important indicators from the past week: consumer price index, producer price index, and retail sales. Inflation has been an ongoing topic of conversation for the past few years. Examining these data points provides valuable information about the latest trends in inflation and consumers’ response to it.
Consumer Price Index
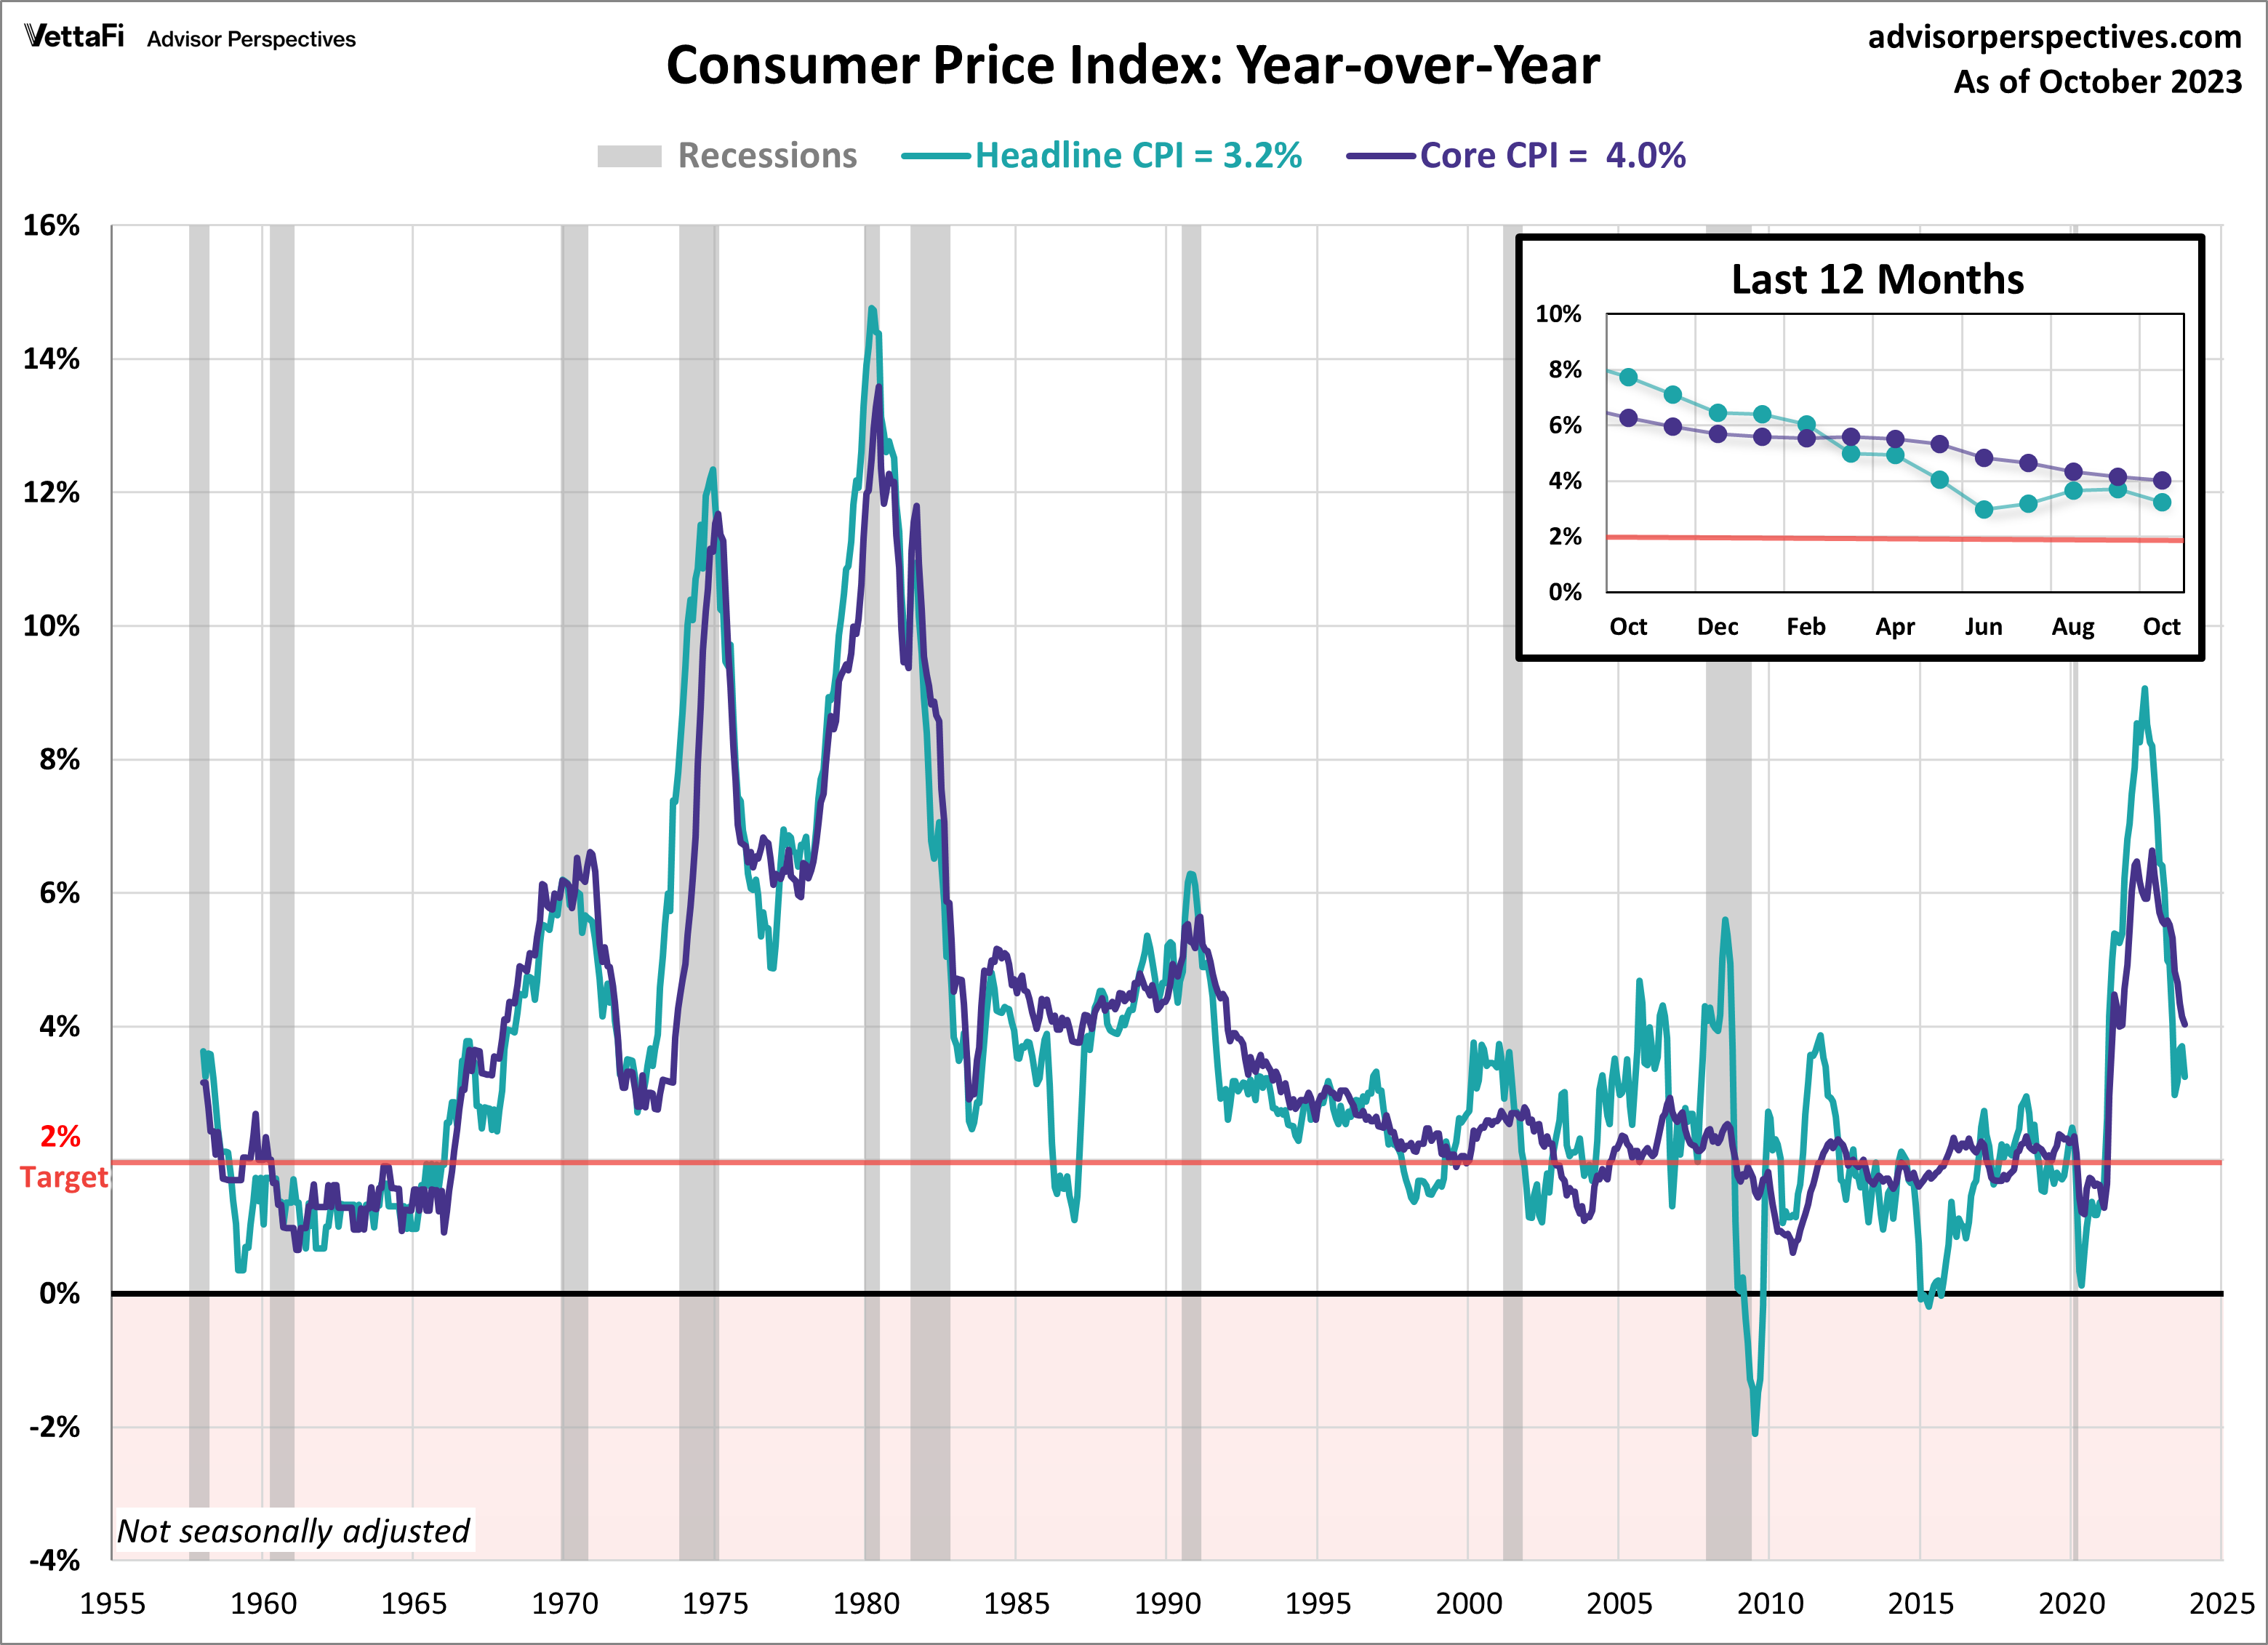
Consumer prices rose slower than expected last month, spurring hopes that the Fed may be done raising rates. In October, the Consumer Price Index (CPI) was flat compared to the previous month and rose 3.2% from one year ago, down from 3.7% in September. The latest data was below the expected 0.1% monthly increase and 3.3% annual increase. The unchanged monthly prices for consumers were the smallest monthly change since December 2022. The primary driver of this month’s drop can be attributed to a decline in gas and energy prices.
Core inflation, which excludes food and energy prices, slowed for a seventh consecutive month, reaching its lowest level since September 2021. Core CPI fell from 4.2% in September to 4.0% in October on an annual basis. Additionally, core prices increased 0.2% from the previous month. Both readings were below their respective forecasts.
The latest data is a welcome sign that inflation is easing and that the Fed can potentially stop raising rates. At the time of writing, the CME Fed Watch tool indicates a 99.8% probability that the Fed will maintain rates at its current level during its next meeting on December 12-13. That said, uncertainty remains regarding how long the Fed will keep rates elevated.
Producer Price Index
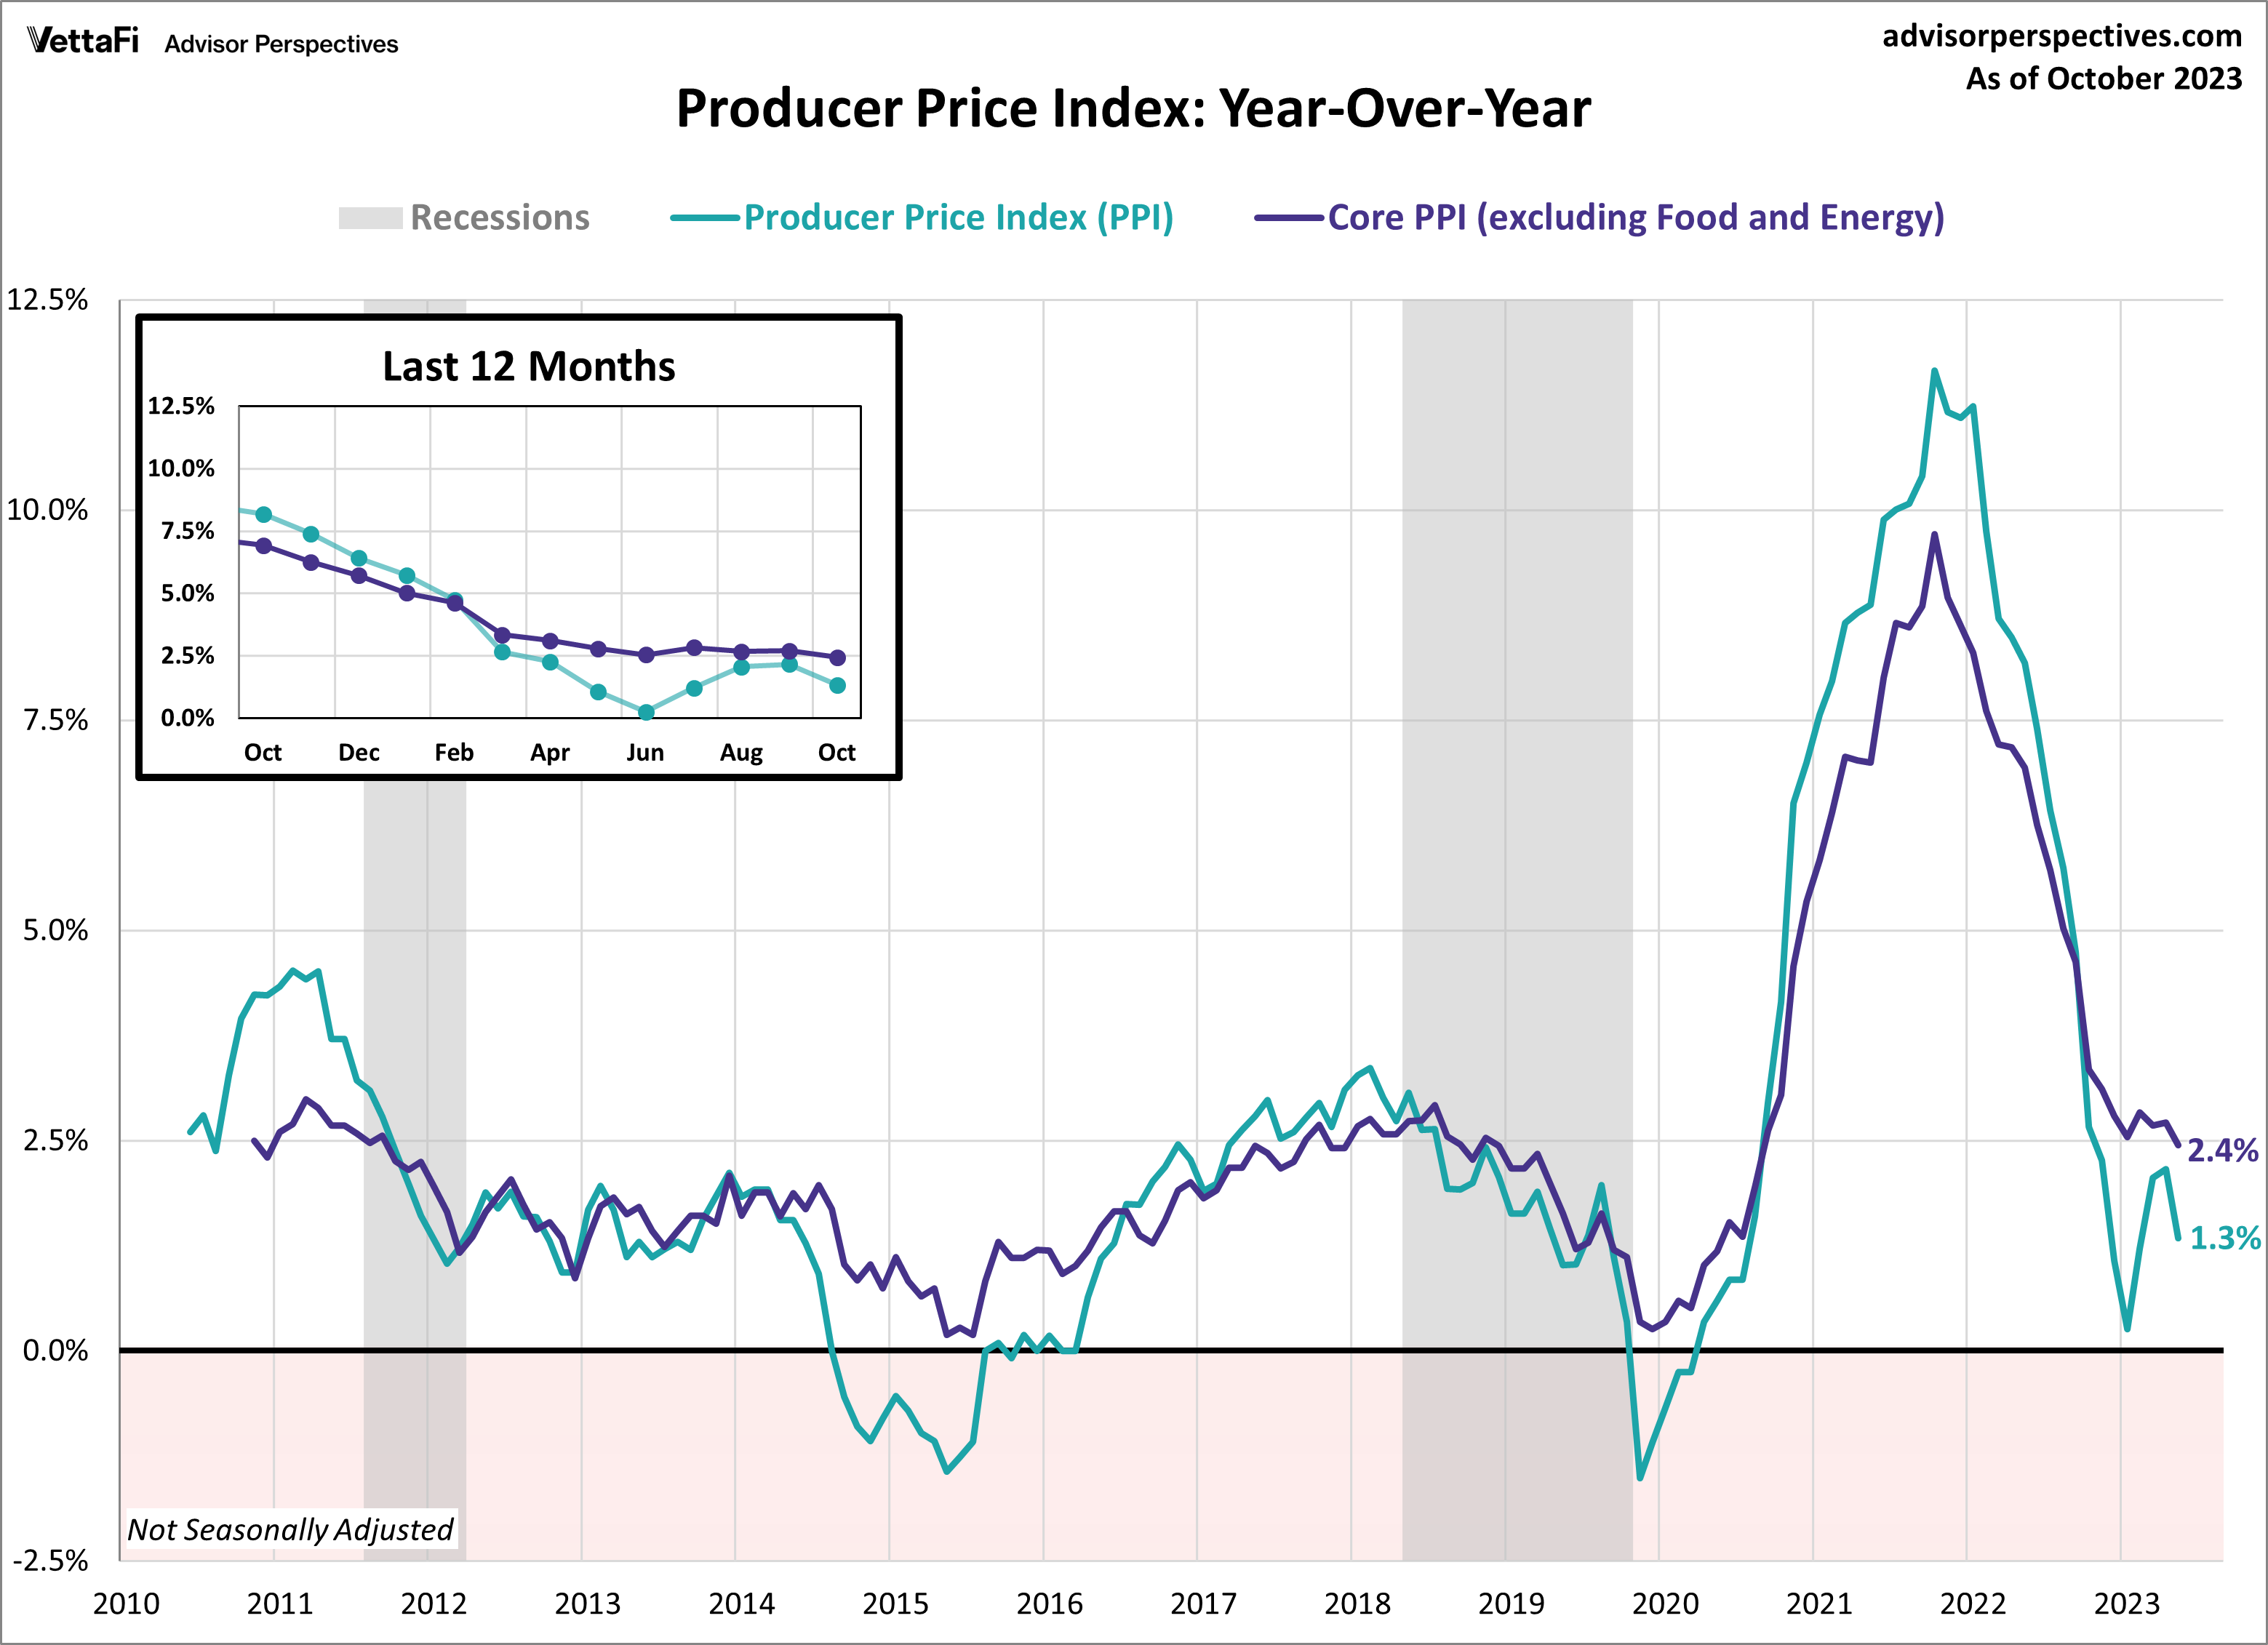
Wholesale prices fell for the first time in four months. That is in large part due to a drop in gas and energy costs. In October, the Producer Price Index (PPI) fell 0.5% from the previous month, marking the largest monthly decline since the beginning of the COVID-19 pandemic in April 2020. Wholesale prices were projected to increase 0.1% from September. On an annual basis, the PPI rose 1.3%. That’s a slowdown from September’s 2.2% annual increase and below the expected 1.9% increase.
Additionally, the Core Producer Price Index (PPI), which excludes food and energy, also came in lower than expected, showing a 2.4% annual increase, down from last month’s 2.7% rise in prices and falling below the projected 2.7% increase. On a monthly basis, core wholesale prices were unchanged, which was lower than the expected 0.3% monthly increase.
The producer price index is widely considered a leading indicator of consumer inflation, as shifts in producer-level prices often trickle down to consumers. The latest PPI report should bring relief to consumers. That suggests price hikes may be tapering off and serving as a positive sign for the Fed that inflationary pressures are easing.
Economic Indicators in Retail Sales
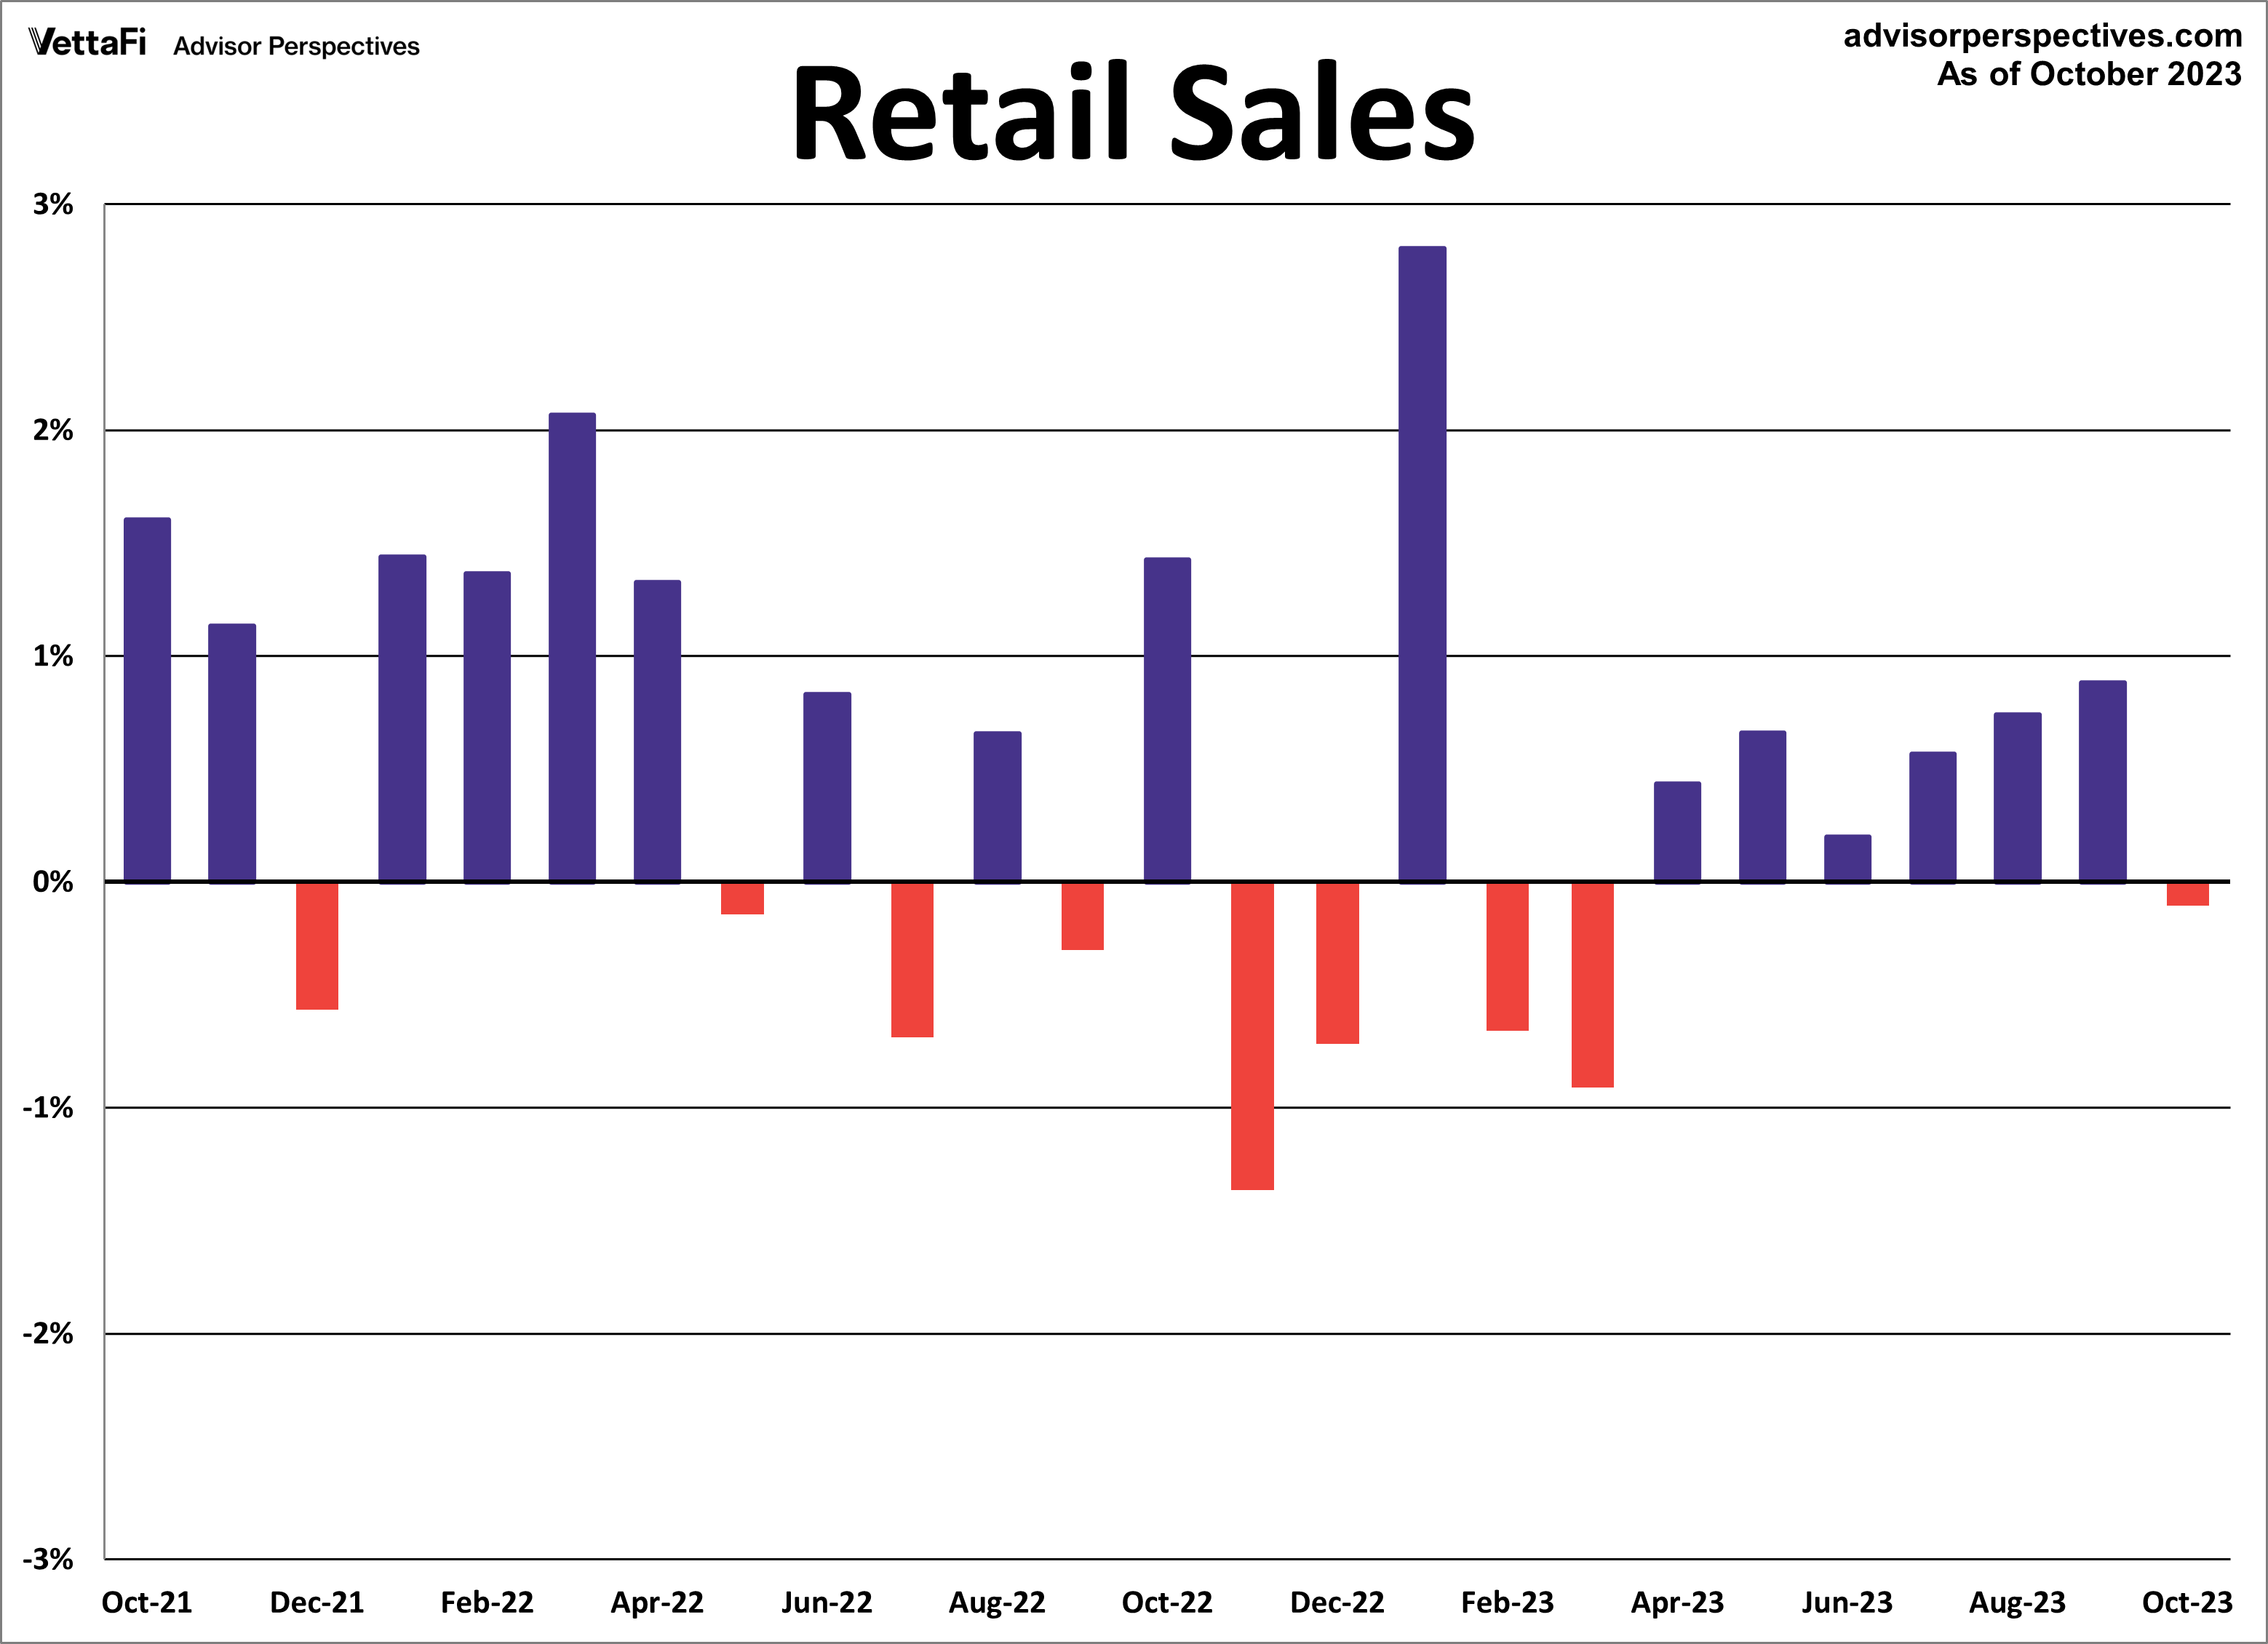
American consumers cut back on spending for the first time since March. That’s due to high interest rates seeming to finally be working their way through the economy. In October, retail sales fell 0.1%. Retail sales fell 0.1% in October, less than the anticipated 0.3% decline. Core retail sales (excluding automobiles) were up 0.1% from the previous month, exceeding expectations of a 0.2% decline. Lastly, control purchases, which is thought to be an even more “core” view of retail sales, were up 0.1% from last month.
While this series typically does not garner as much attention as the headline and core figures, control purchases are a more consistent and reliable reading of the economy. In general, the most recent figures indicate a modest deceleration in spending, offering some reassurance to the Fed that inflationary pressures are easing. However, as the holiday season is underway, only time will tell whether the recent decline transforms into a lasting trend.
Retail sales will have an impact on the interest in the SPDR S&P Retail ETF (XRT).
Economic Indicators and the Week Ahead
The upcoming week may be shortened but there are still a handful of key economic reports on the calendar. On Monday, the Conference Board will release its October data on its Leading Economic Index (LEI). That index is meant to gauge future economic trends. The LEI is forecasted to fall yet again, dropping 0.7% from September, marking the 19 consecutive monthly decline.
Then on Tuesday, the National Association of Realtors will release existing home sales data for October. Existing home sales are expected to have inched down to a seasonally adjusted annual rate of 3.93 million. That marks the fifth consecutive monthly decline and the 18th in the past 20 months.
Finally, on Wednesday, the University of Michigan will release its final reading for November for the Consumer Sentiment Index. Earlier this month, consumer sentiment fell to its lowest level since May, with the index coming in at 60.4.
For more news, information, and analysis, visit the Innovative ETFs Channel.
