
Economic indicators provide insight into the overall health and performance of an economy. They are closely watched and serve as essential tools for policymakers, advisors, investors, and businesses. That’s because they allow them to make informed decisions regarding business strategies and financial markets. In the week ending December 14, the SPDR S&P ETF Trust (SPY) rose 3.01%, while the Invesco S&P 500 Equal Weight ETF (RSP) was up 4.90%.
This article highlights three important indicators from the past week – consumer price index, producer price index, and retail sales. Inflation has been an ongoing topic of conversation over the past few years. It climbed to historic levels in 2022 and then slowly eased for much of 2023. A look at these three data points will provide information on the most recent inflationary trends and consumers’ spending response to it.
Economic Indicators: Consumer Price Index
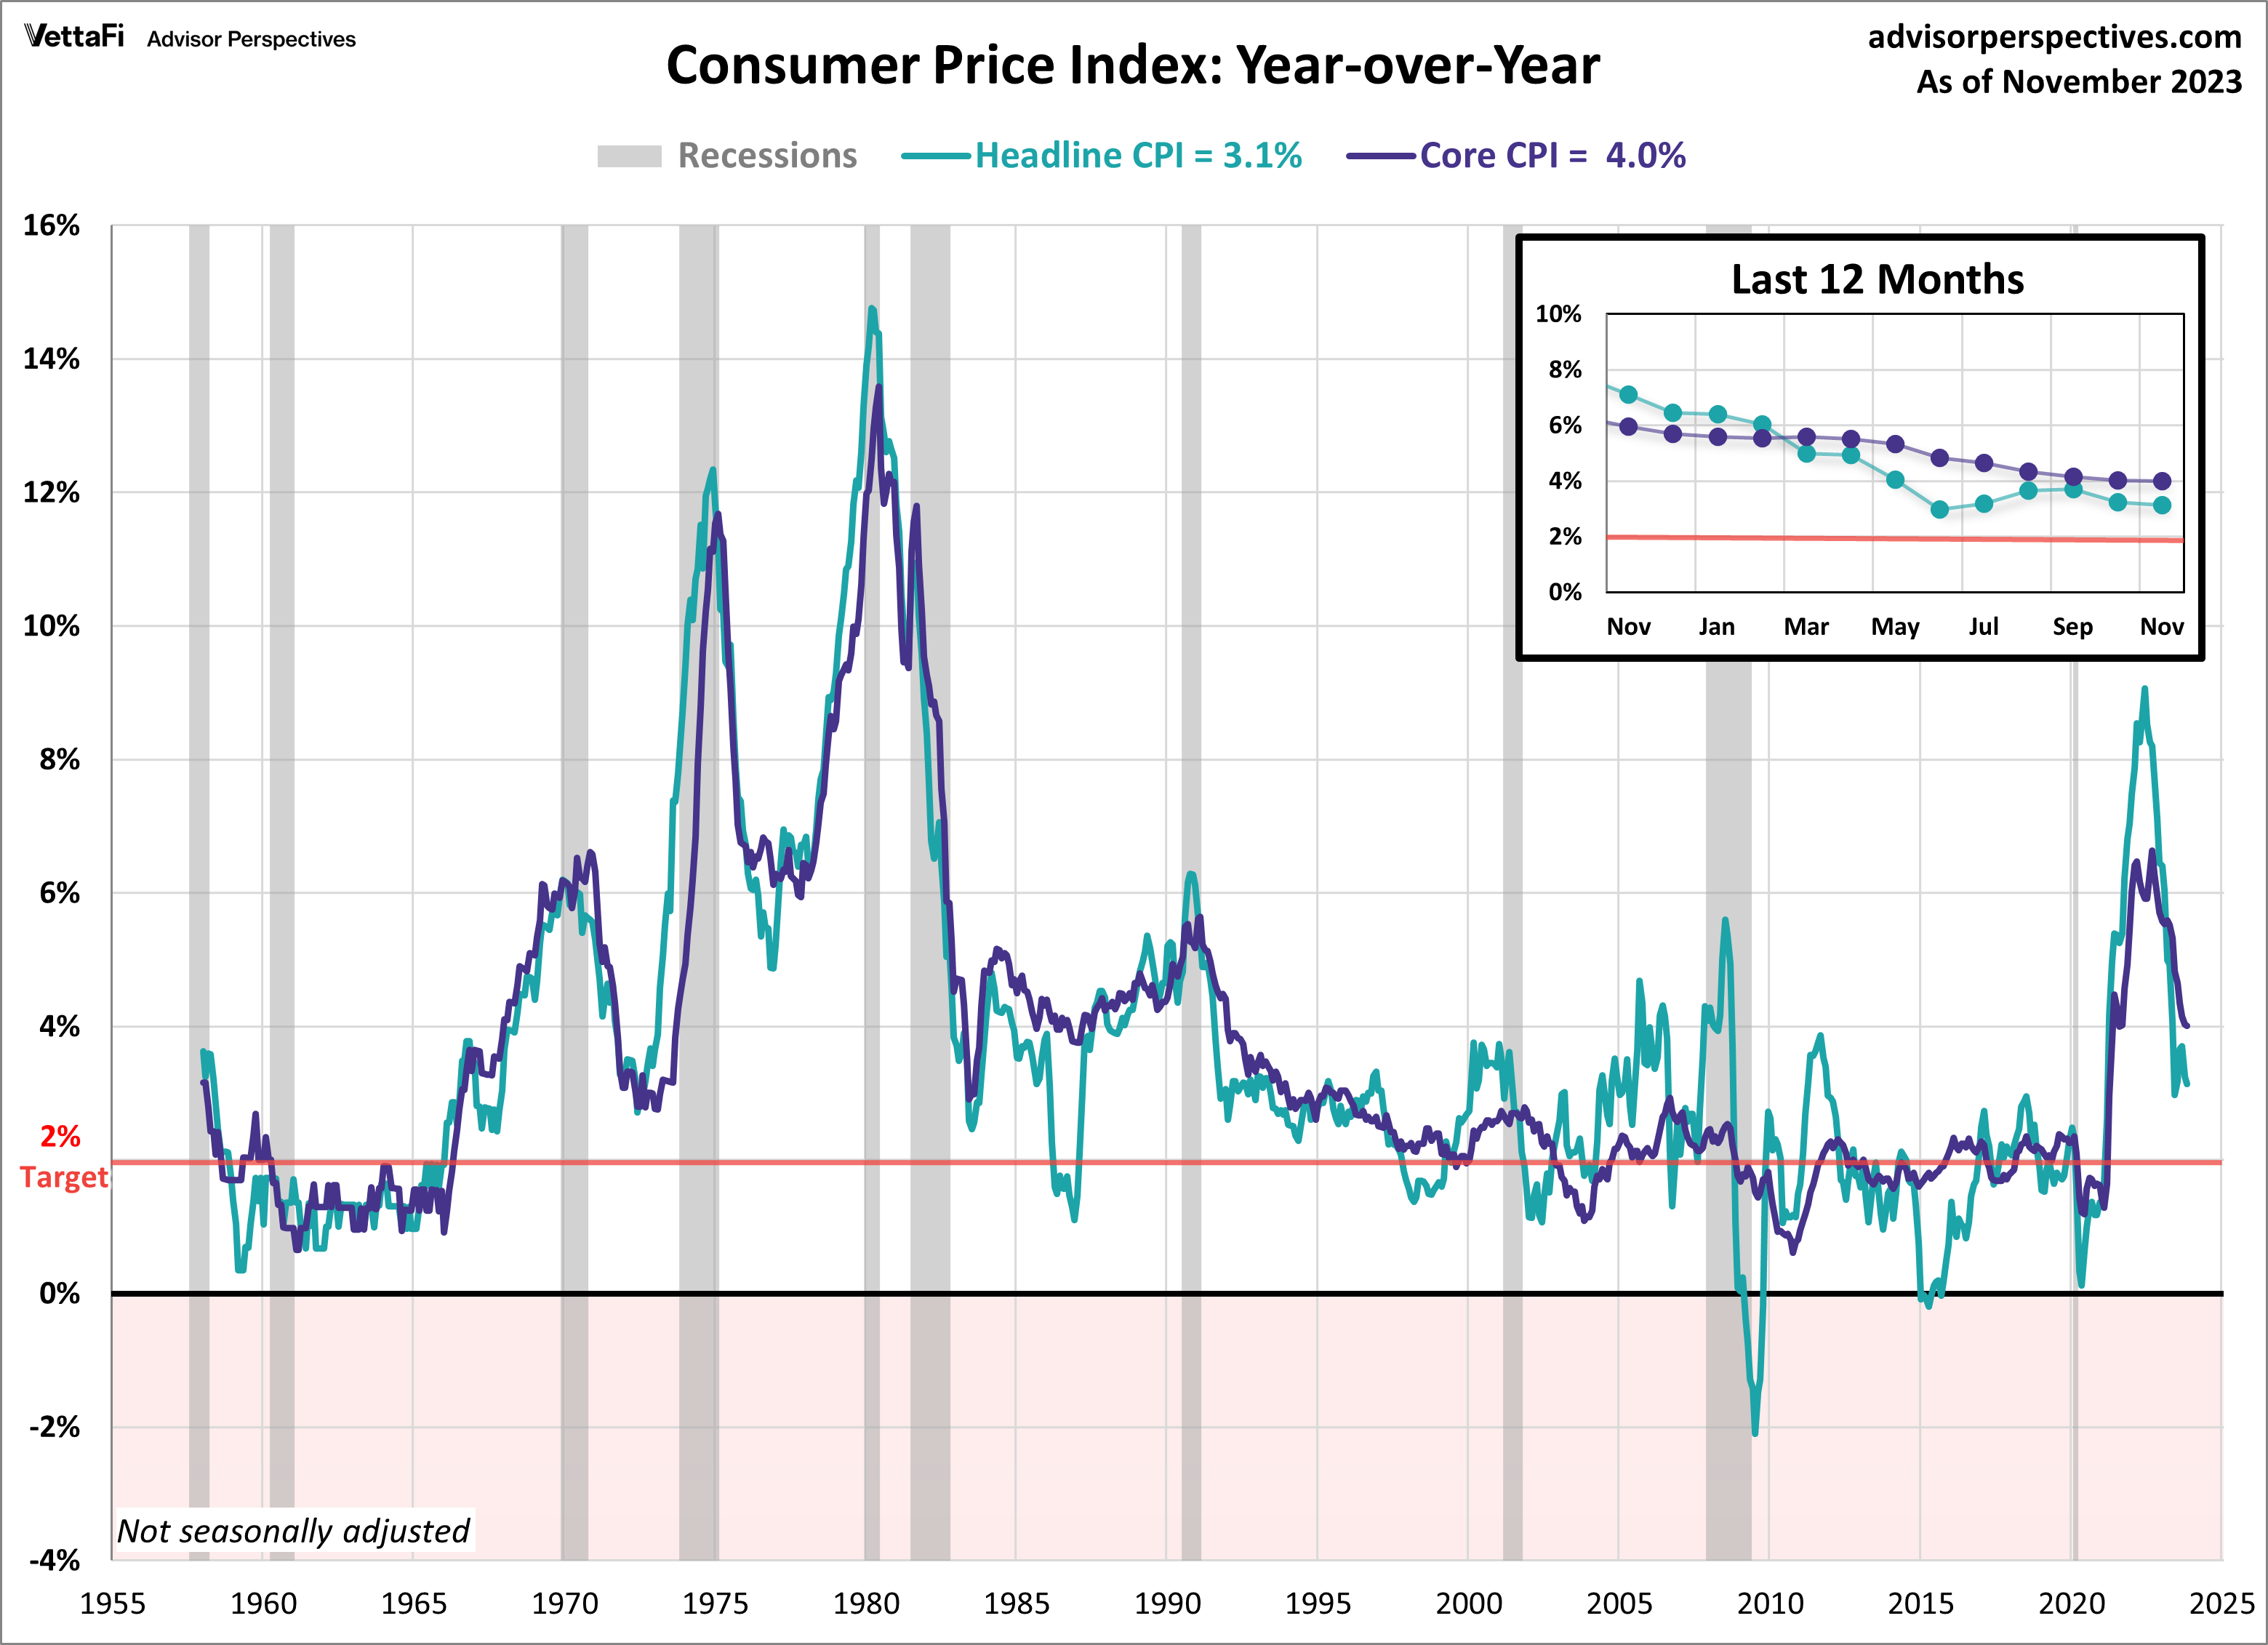
The narrative of easing inflation continued last month as consumer prices slowed for a second straight month. The Consumer Price Index (CPI) rose 3.1% in November, as expected. That’s down from 3.2% in October. This is the second-lowest reading for headline CPI since March 2021. Compared to the previous month, consumer prices rose 0.1%. That’s higher than the expected 0.0% change. The primary driver for the monthly increase was a rise in rental costs. That more than offset the continuous decline in gas prices seen over the past few months.
Core inflation, which excludes food and energy prices, was practically unchanged in November. It inched down to its lowest level since August 2021. To two decimal places, core CPI fell from 4.03% in October to 4.01% in November on an annual basis. Additionally, core prices increased 0.3% from the previous month. Both readings were below their respective forecasts.
Last week, the Fed indicated it was done raising rates and will begin to pivot in 2024. It hinted at only three rate cuts for next year. However, the CME Fed Watch tool currently has six, with a 64% probability that the first one will occur at its March meeting. Inflation has come a long way since its mid-2022 peak and the Fed’s most recent comments may hint at victory. Yet it is important to note that inflation remains above the Fed’s 2% target.
Economic Indicators: Producer Price Index
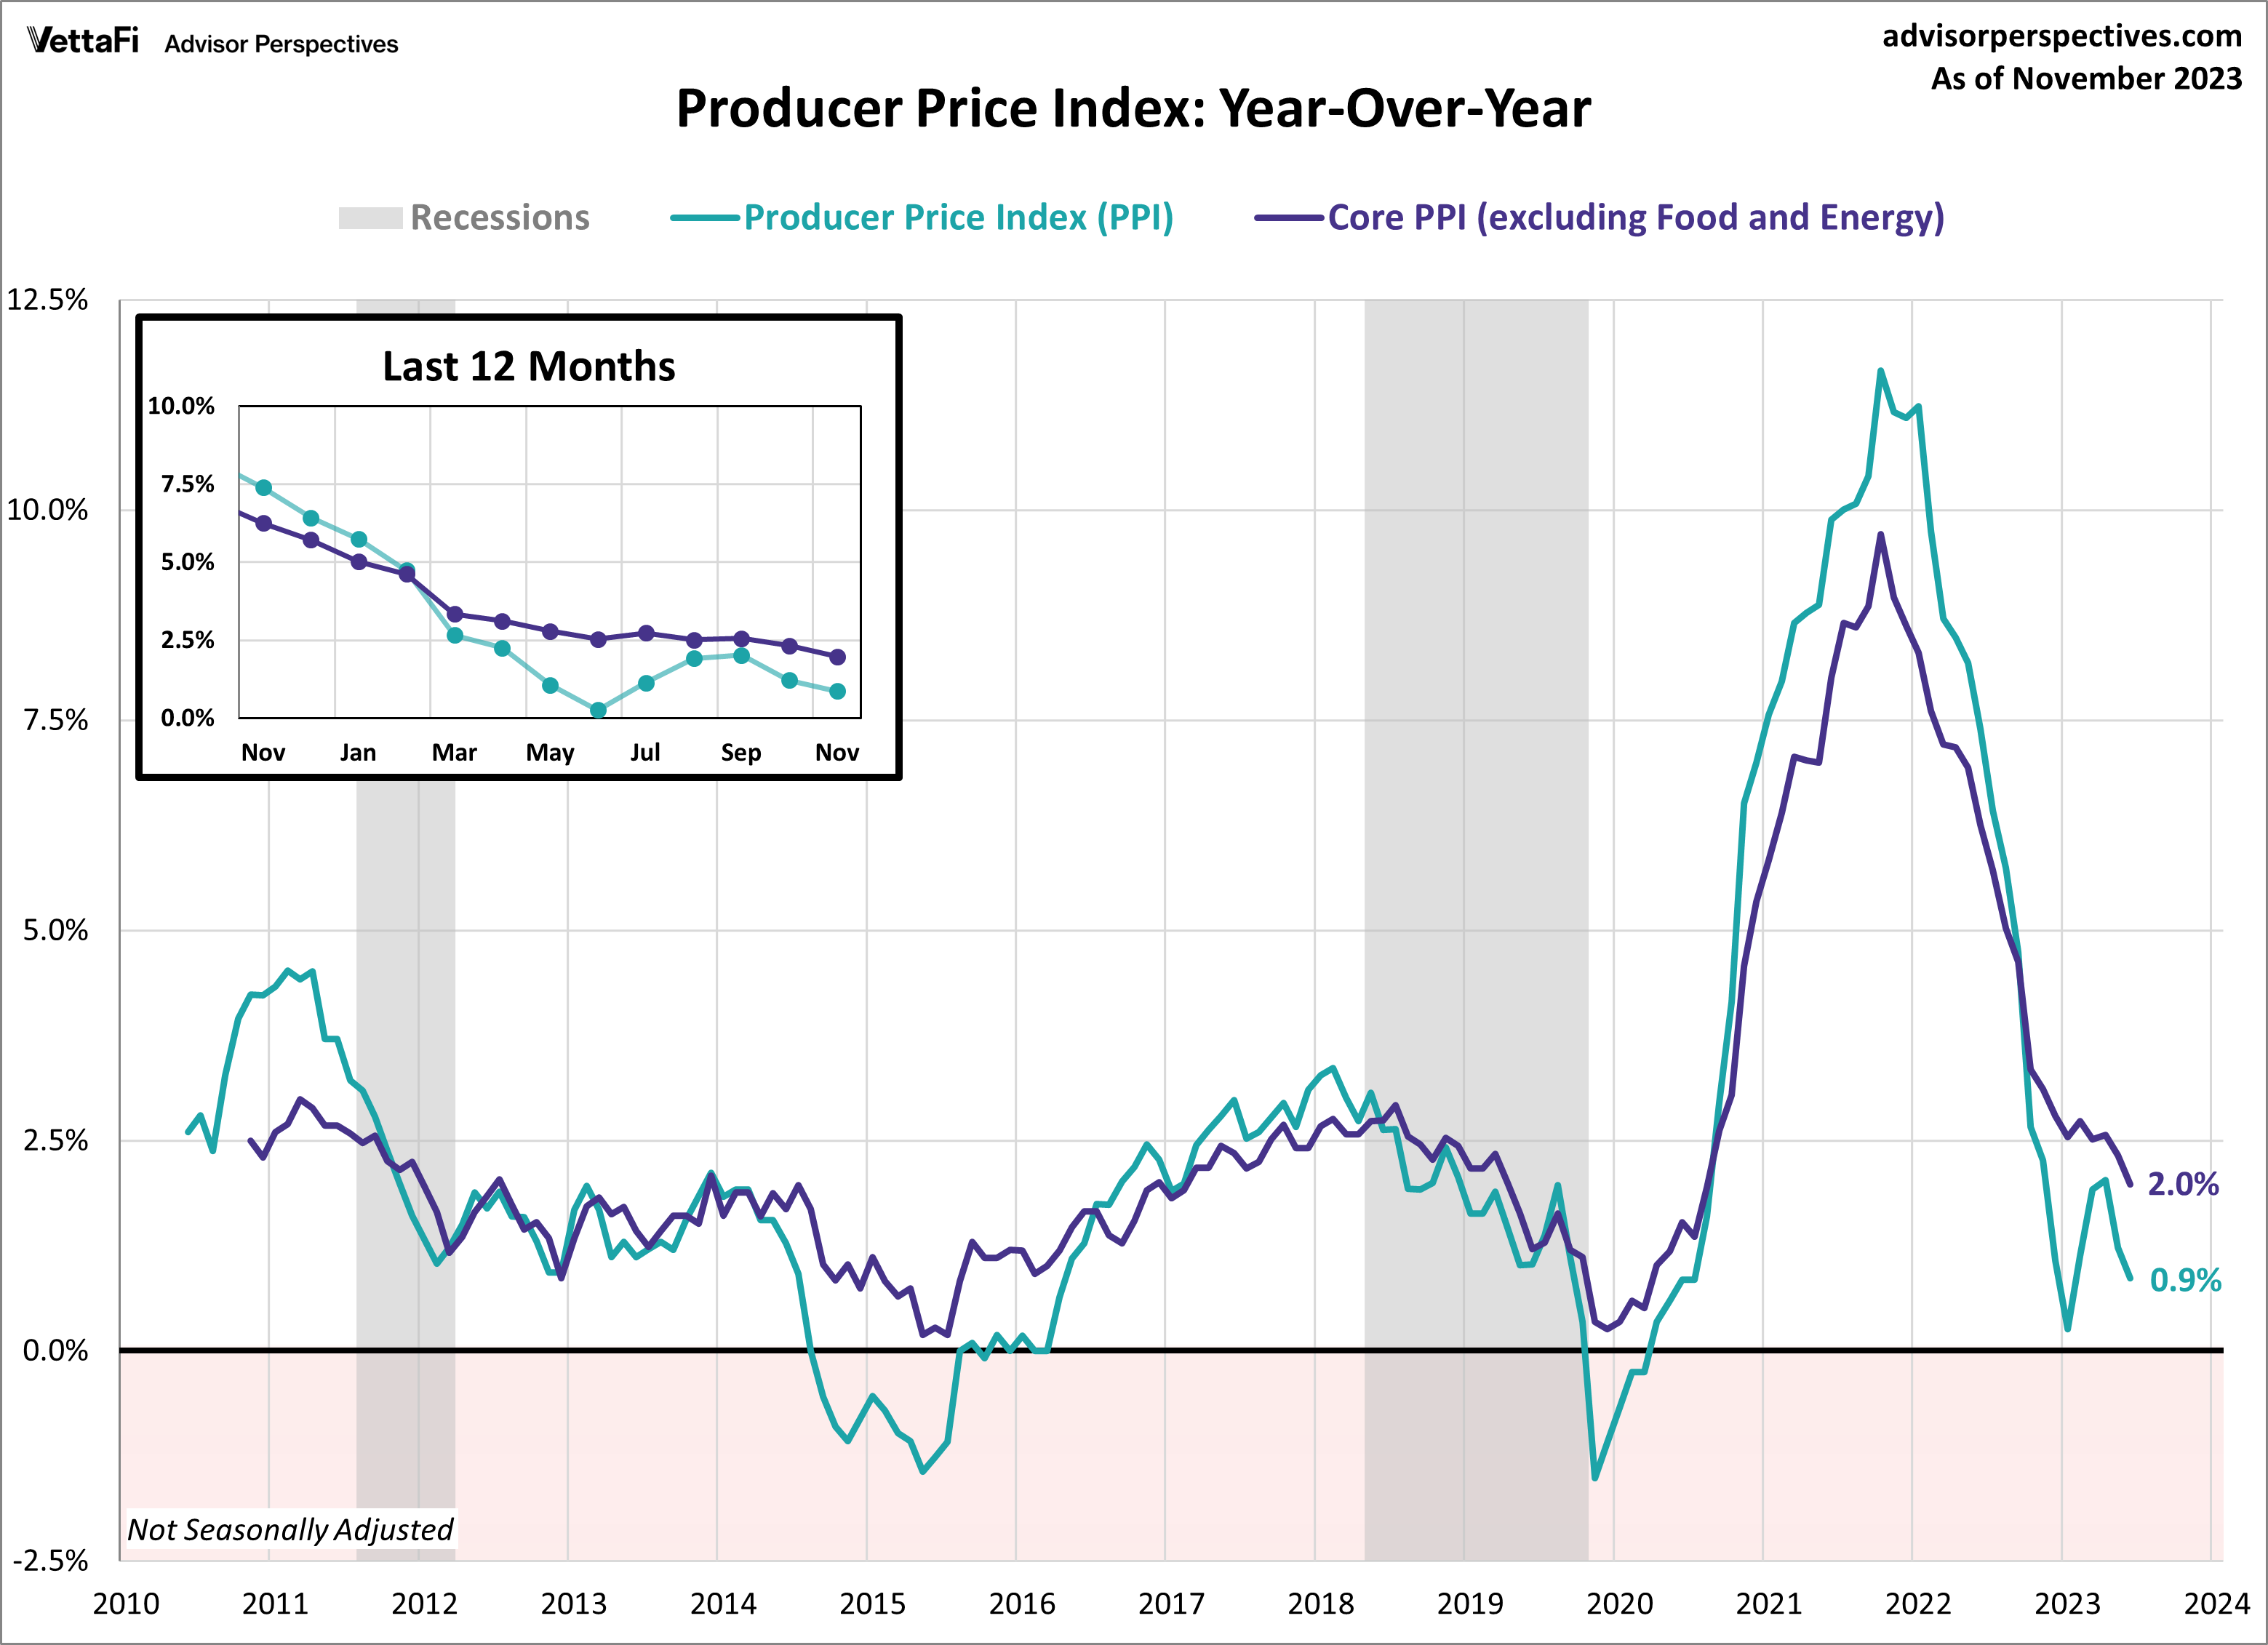
Wholesale prices were flat last month, in large part from falling energy prices. That’s yet another sign of easing inflation. Last month, the Producer Price Index (PPI) was unchanged from October. And that is better than the expected 0.1% increase in wholesale prices. On an annual basis, the PPI rose 0.9%. That is a slowdown from October’s 1.2% annual increase and below the expected 1.0% increase.
Additionally, the Core Producer Price Index (PPI), which excludes food and energy, also came in lower than expected. It showed a 2.0% annual increase, down from last month’s 2.3% rise in prices and falling below the projected 2.2% increase. On a monthly basis, core wholesale prices were unchanged for a second straight month. That’s lower than the expected 0.2% monthly increase.
The producer price index is widely considered a leading indicator of consumer inflation, as shifts in producer-level prices often trickle down to consumers. The latest PPI report should provide relief to consumers that since inflation at the wholesale level has softened to pre-pandemic levels, inflation at the consumer inflation is likely to follow suit.
Economic Indicators: Retail Sales
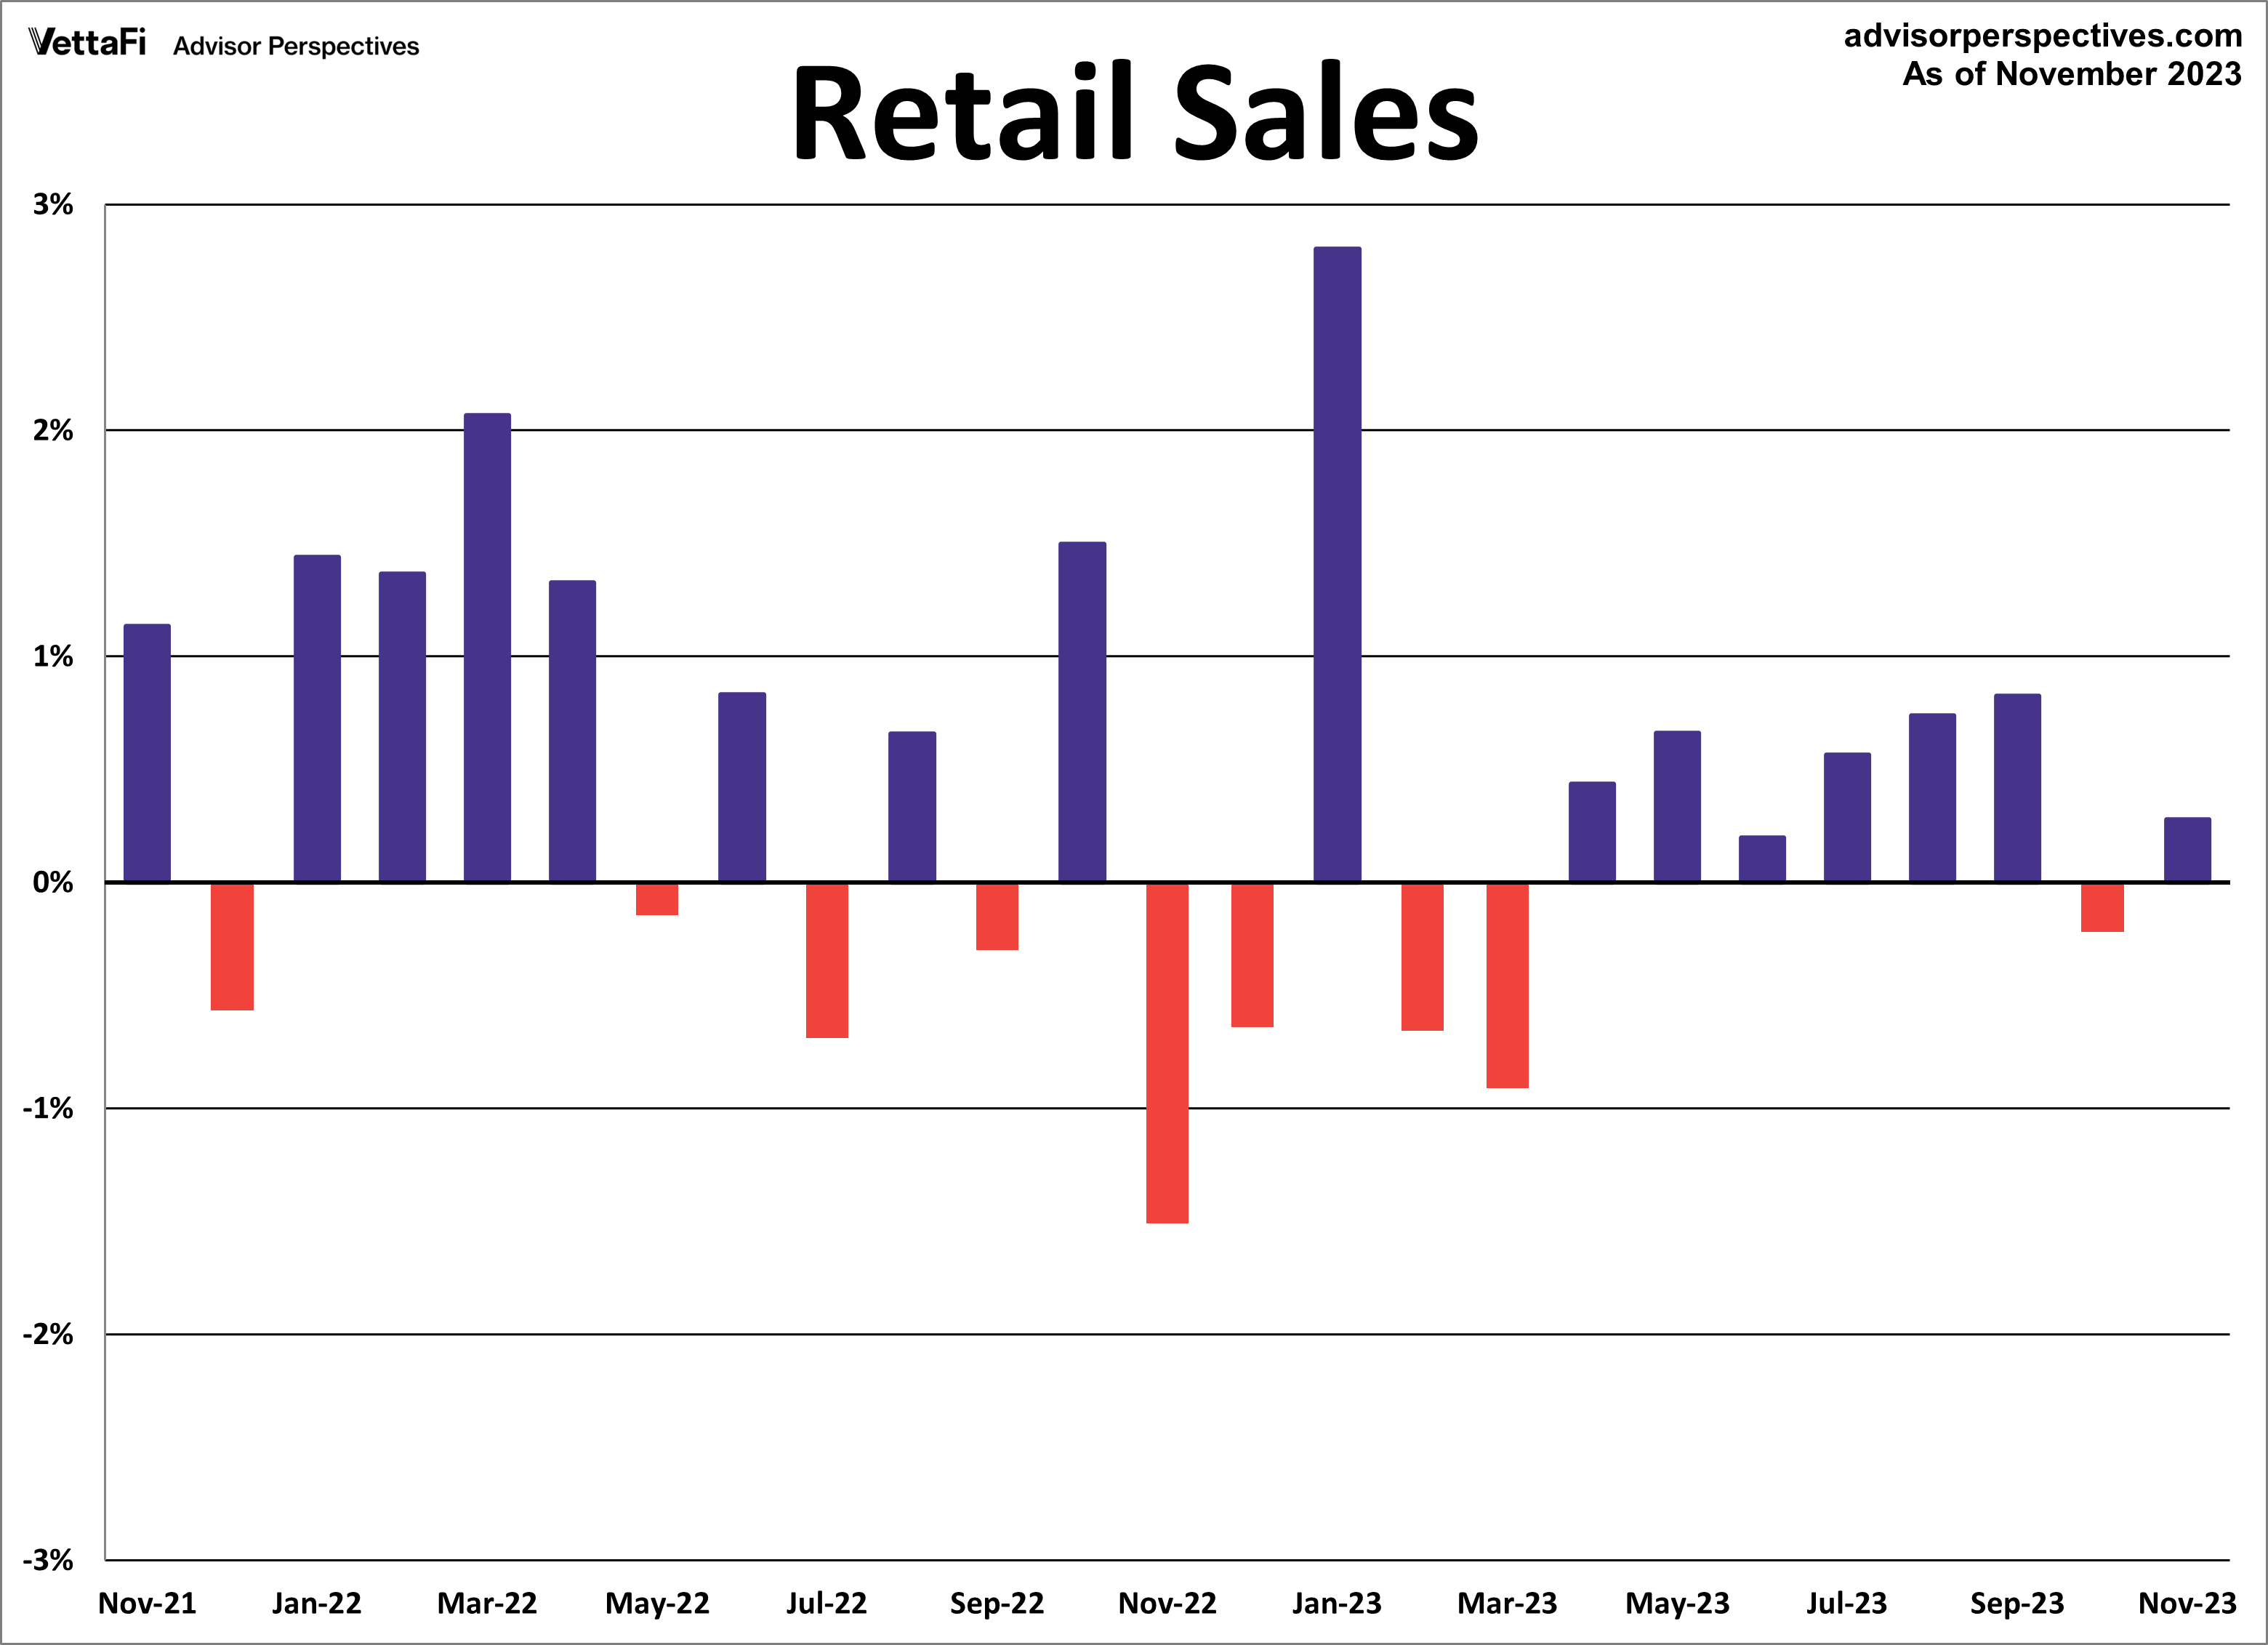
American consumers unexpectedly picked their spending back up as the holiday season kicked off. Retail sales rebounded in November. Sales rose 0.3% from October, more than the anticipated 0.1% decline. The pickup this month was no doubt aided by the consistent decline in gas prices seen in November and which have continued through this past week. Core retail sales (excluding autos) were also up in November. They increased 0.2% from the previous month and exceeded expectations of a 0.1% decline.
Lastly, control purchases, which is thought to be an even more “core” view of retail sales, were up 0.4% from last month. While this series typically does not garner as much attention as the headline and core figures, control purchases are a more consistent and reliable reading of the economy. In 2023, consumers have consistently fueled the economy, with spending increasing for eight of the 11 months thus far. With inflation easing, the job market remaining strong, and rate cuts on the horizon, Americans are expected to continue to open their wallets in 2024.
Retail sales will have an impact on the interest in the SPDR S&P Retail ETF (XRT), VanEck Retail ETF (RTH), Amplify Online Retail ETF (IBUY), and ProShares Online Retail ETF (ONLN).
The Week Ahead
In the upcoming week, the economic landscape will be shaped by insights across various sectors. The housing market will be in focus, with anticipated releases including the NAHB HMI, housing starts, building permits, existing home sales, and new home sales. These housing market indicators will have an impact on homebuilders and residential real estate ETFs such as the iShares U.S. Home Construction ETF (ITB), SPDR S&P Homebuilders ETF (XHB), and iShares Residential and Multisector Real Estate ETF (REZ).
Additionally, consumer attitudes will be gauged through the Conference Board’s Consumer Confidence Index and the University of Michigan’s Consumer Sentiment Index, which could impact the Consumer Discretionary Select Sector SPDR ETF (XLY). Finally, eyes will be on pivotal economic measures with the final GDP estimate for Q3 and November’s PCE price index, both crucial in understanding the broader economic health and consumer behavior.
For more news, information, and strategy, visit the Innovative ETFs Channel.
