
Two of the oldest smart beta funds are value-oriented, and they have been struggling mightily this year. The good news is they’ve been struggling so much that they might be poised to start outperforming the S&P 500.
Rough Run Recently for Smart Beta
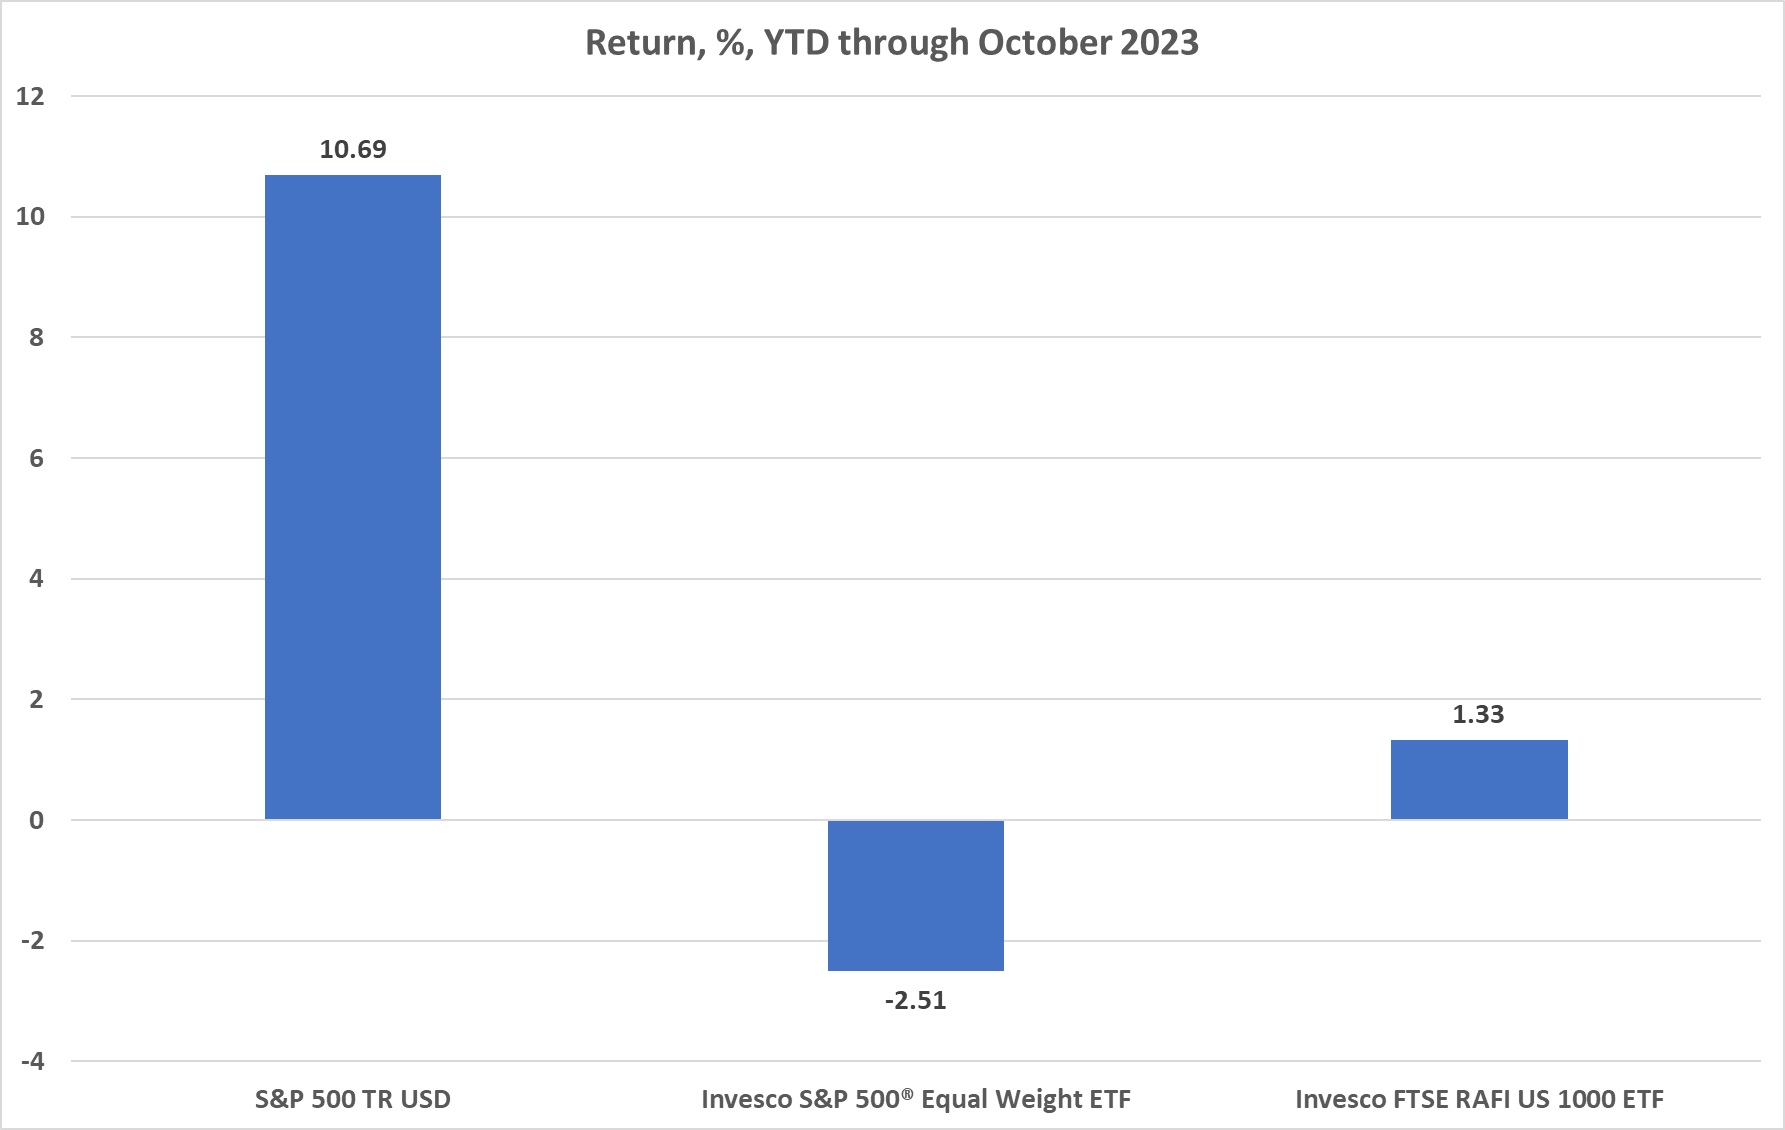
This year marks one of the most brutal runs the funds have had against the plain S&P 500. For the year through October, the S&P 500 was up 10.69%, while the Invesco S&P 500 Equal Weight ETF (RSP) was down 2.51% and the Invesco FTSE RAFI US 1000 ETF (PRF) was up a comparatively anemic 1.33%. The biggest stocks have carried the index to such an extent this year that reducing exposure to them, as these funds do, has been a bad idea.
But the outperformance of the cap-weighted index seems to run in streaks. So, given the vast outperformance of the plain S&P this year, we ran the 6-month rolling tally of it, moving monthly, minus the performances of each of the ETFs going back to the inception of the equal weight fund.
S&P 500 Excess Return Over Smart Beta Strategies
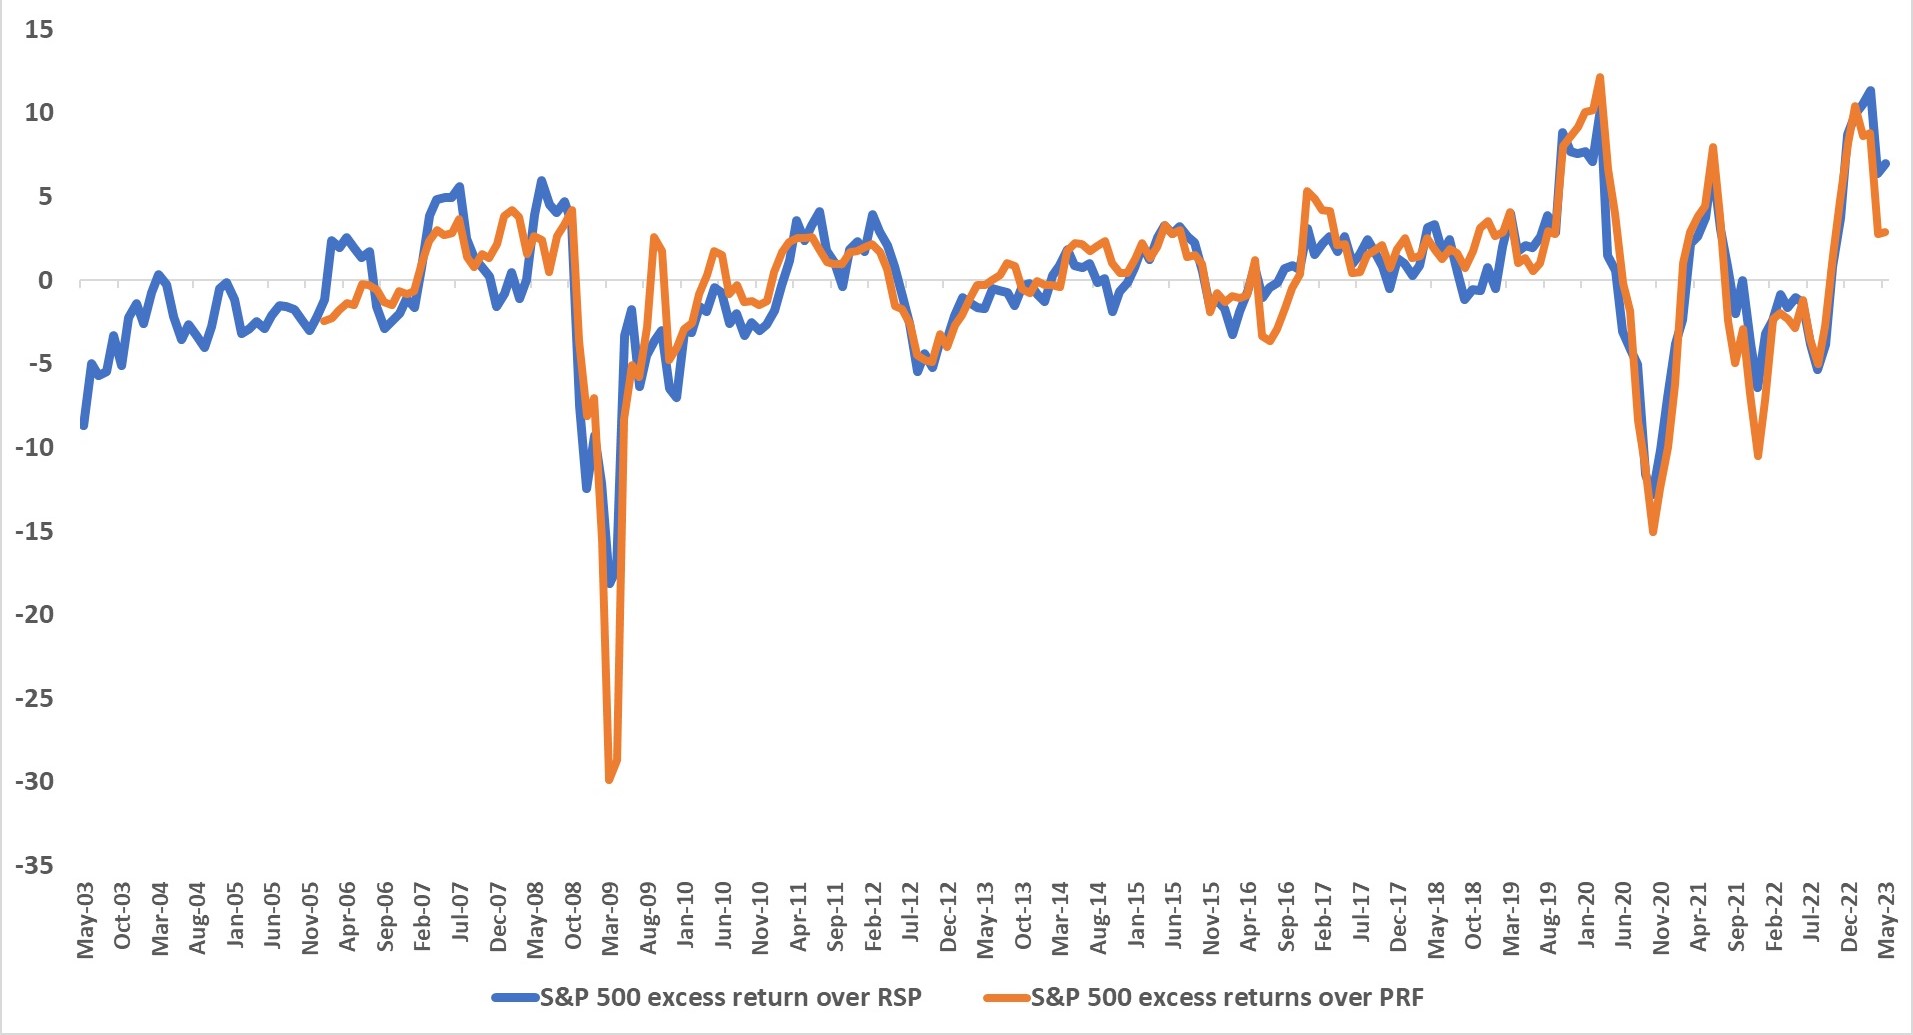
Note: Data represents percentage points over 6-month rolling periods
The results show that the S&P’s trouncing of these two ETFs peaked at the end of August when, over six months, it beat RSP by more than 11 percentage points and PRF by nearly 8.8 percentage points.
From the beginning of May through October that outperformance has declined to a victory over RSP of 6.9 percentage points and over the PRF of 2.9 percentage points.
The end-of-August peak, however, represented the most impressive 6-month trouncing of RSP since its inception. And the second most impressive six-month trouncing of PRF since its inception. During the initial COVID lockdown, from March 2020 through August 2020, the S&P beat RSP by 10.26 percentage points and PRF by 12.13 percentage points.
These two peaks sandwich a smaller peak of around 7%-8% of outperformance by the S&P 500 in the June 2021-November 2021 period. Moreover, these three peaks are within a period of extreme volatility or alternating outperformance and underperformance by the S&P relative to the two ETFs.
Breaking the Link Between Size and Rank
RSP and PRF rearrange the components of capitalization-weighted indices by “breaking the link,” as Research Affiliates founder Rob Arnott, designer of PRF’s index, might say, between stock size and index rank.
The equal weight index, of course, rearranges the 500 names in the S&P 500 by assigning them each weights of 0.2% at each quarterly rebalance. That gives ‘the Magnificent Seven’ a collective weighting of less than 2% of assets. A far cry from the roughly 27% weight they carry in the cap-weighted index.
The RAFI index underlying PRF ranks the top 1000 stocks by sales, book value, dividends, and cash flow. That gives the seven stocks carrying the cap-weighted index this year a collective weighting of around 10%. Nvidia, for example, is the fourth-largest position in the SPDR S&P 500 ETF Trust (SPY), representing 3.25% of assets, but the fifty-second-largest position in PRF, representing 0.36% of assets. The fund and index are reconstituted annually.
Historical Performance
From their inception dates — April 24, 2003 for RSP and December 19, 2005 for PRF — through October of this year, the equal weight fund has beaten the S&P 500, with a 10.21% annualized return versus a 9.86% annualized return. The RAFI fund has lagged slightly, with an 8.62% annualized return versus 9.12% for the S&P 500.
Although it’s only a roughly two-and-one-half year difference in inception dates, RSP has also underperformed since PRF’s inception.
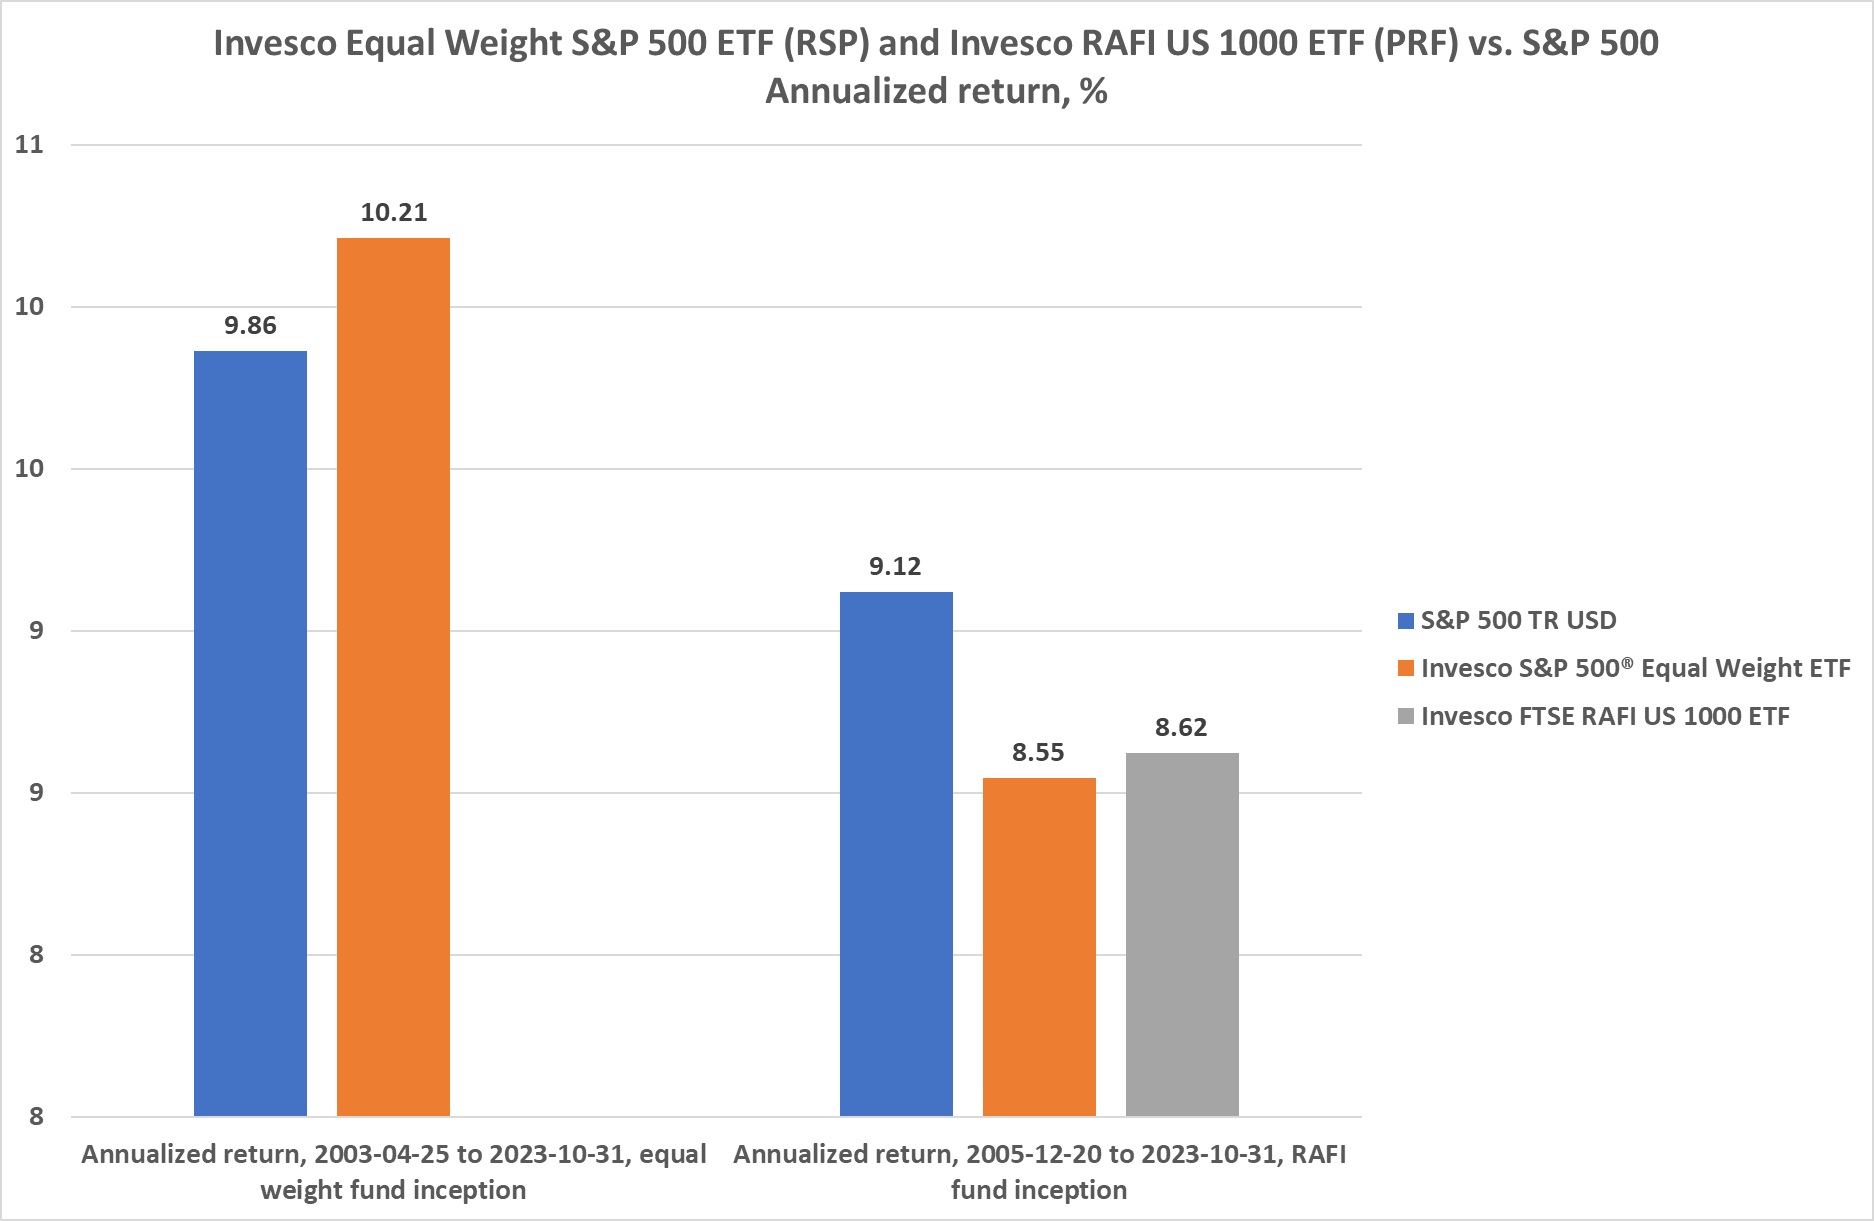
That’s likely because the period from early 2003 until late 2005, when the equal weight fund existed and the RAFI fund didn’t, was an unusually good one for value strategies after the technology bubble had lost its air. During that period, RSP delivered a 22.1% annualized return, and the Russell 1000 Value index posted a 19.1% annualized return against the S&P 500’s 14.98% annualized return.
Volatile Relationship
Besides the streakiness of the relationship between the strategies and the plain index, the volatility (both outperformance and underperformance) of the relationship of the ETFs to the cap-weighted index hasn’t been anywhere near its current levels since the end of the financial crisis. That’s when the S&P 500 underperformed RSP’s index by 18.2 percentage points and PRF’s index by a staggering 29.9 percentage points in the six months from March 2009 through August 2009.
From that point, the graph settles into a long stable period, gently oscillating between cap-weighted victory and smart-beta victory for every six months until the start of the initial COVID lockdown period. It appears it has been haywire ever since.
The most volatile things got in the quiet period between the end of the financial crisis and initial COVID lockdown was when the S&P 500 lost to PRF by more than 3 percentage points and beat it by more than 5 percentage points over 6-month intervals during the two years from 2016 through 2017. Some of that likely had to do with oil’s volatility during that period.
Much of the recent volatility likely has to do with interest rates. The market pattern seems to be that stocks rise – and growth stocks rise especially – when it appears that the Fed is finished cutting rates. Conversely, value stocks seem to outperform when it looks like the Fed might continue on its campaign to lower inflation.
Over the longer term, this rate-factor relationship is harder to prove, as a recent paper by David Blitz of Robeco Investments shows. But that paper also argues that most factors deliver the lion’s share of their outperformance during bear markets. It may take a weaker overall market for RSP and PRF to rebound.
For more news, information, and analysis, visit the Innovative ETFs Channel.
