
This week was packed with several key economic releases that helped provide insight into the overall state of the U.S. economy. Policymakers and advisors closely monitor economic indicators to understand recession risk and the direction of interest rates because the data can ultimately impact business decisions and financial markets. In the week ending on August 31st, the SPDR S&P 500 ETF Trust (SPY) rose 3.08 % while the Invesco S&P 500® Equal Weight ETF (RSP) was up 2.36%.
Analyzing various economic indicators is like assembling pieces of a puzzle. Each indicator, serving as an individual piece, reveals a different facet of economic activity. Alone, these pieces portray a very narrow view of the economy. However, when viewed together, we gain a more comprehensive understanding of the broader economic landscape. For example, in this article, we look at three critical indicators from the past week: employment, GDP, and PCE. By examining these data points together, we gain valuable insights into the economy’s health, with employment serving as a key driver for consumer spending and overall economic activity, as reflected in GDP and PCE data.
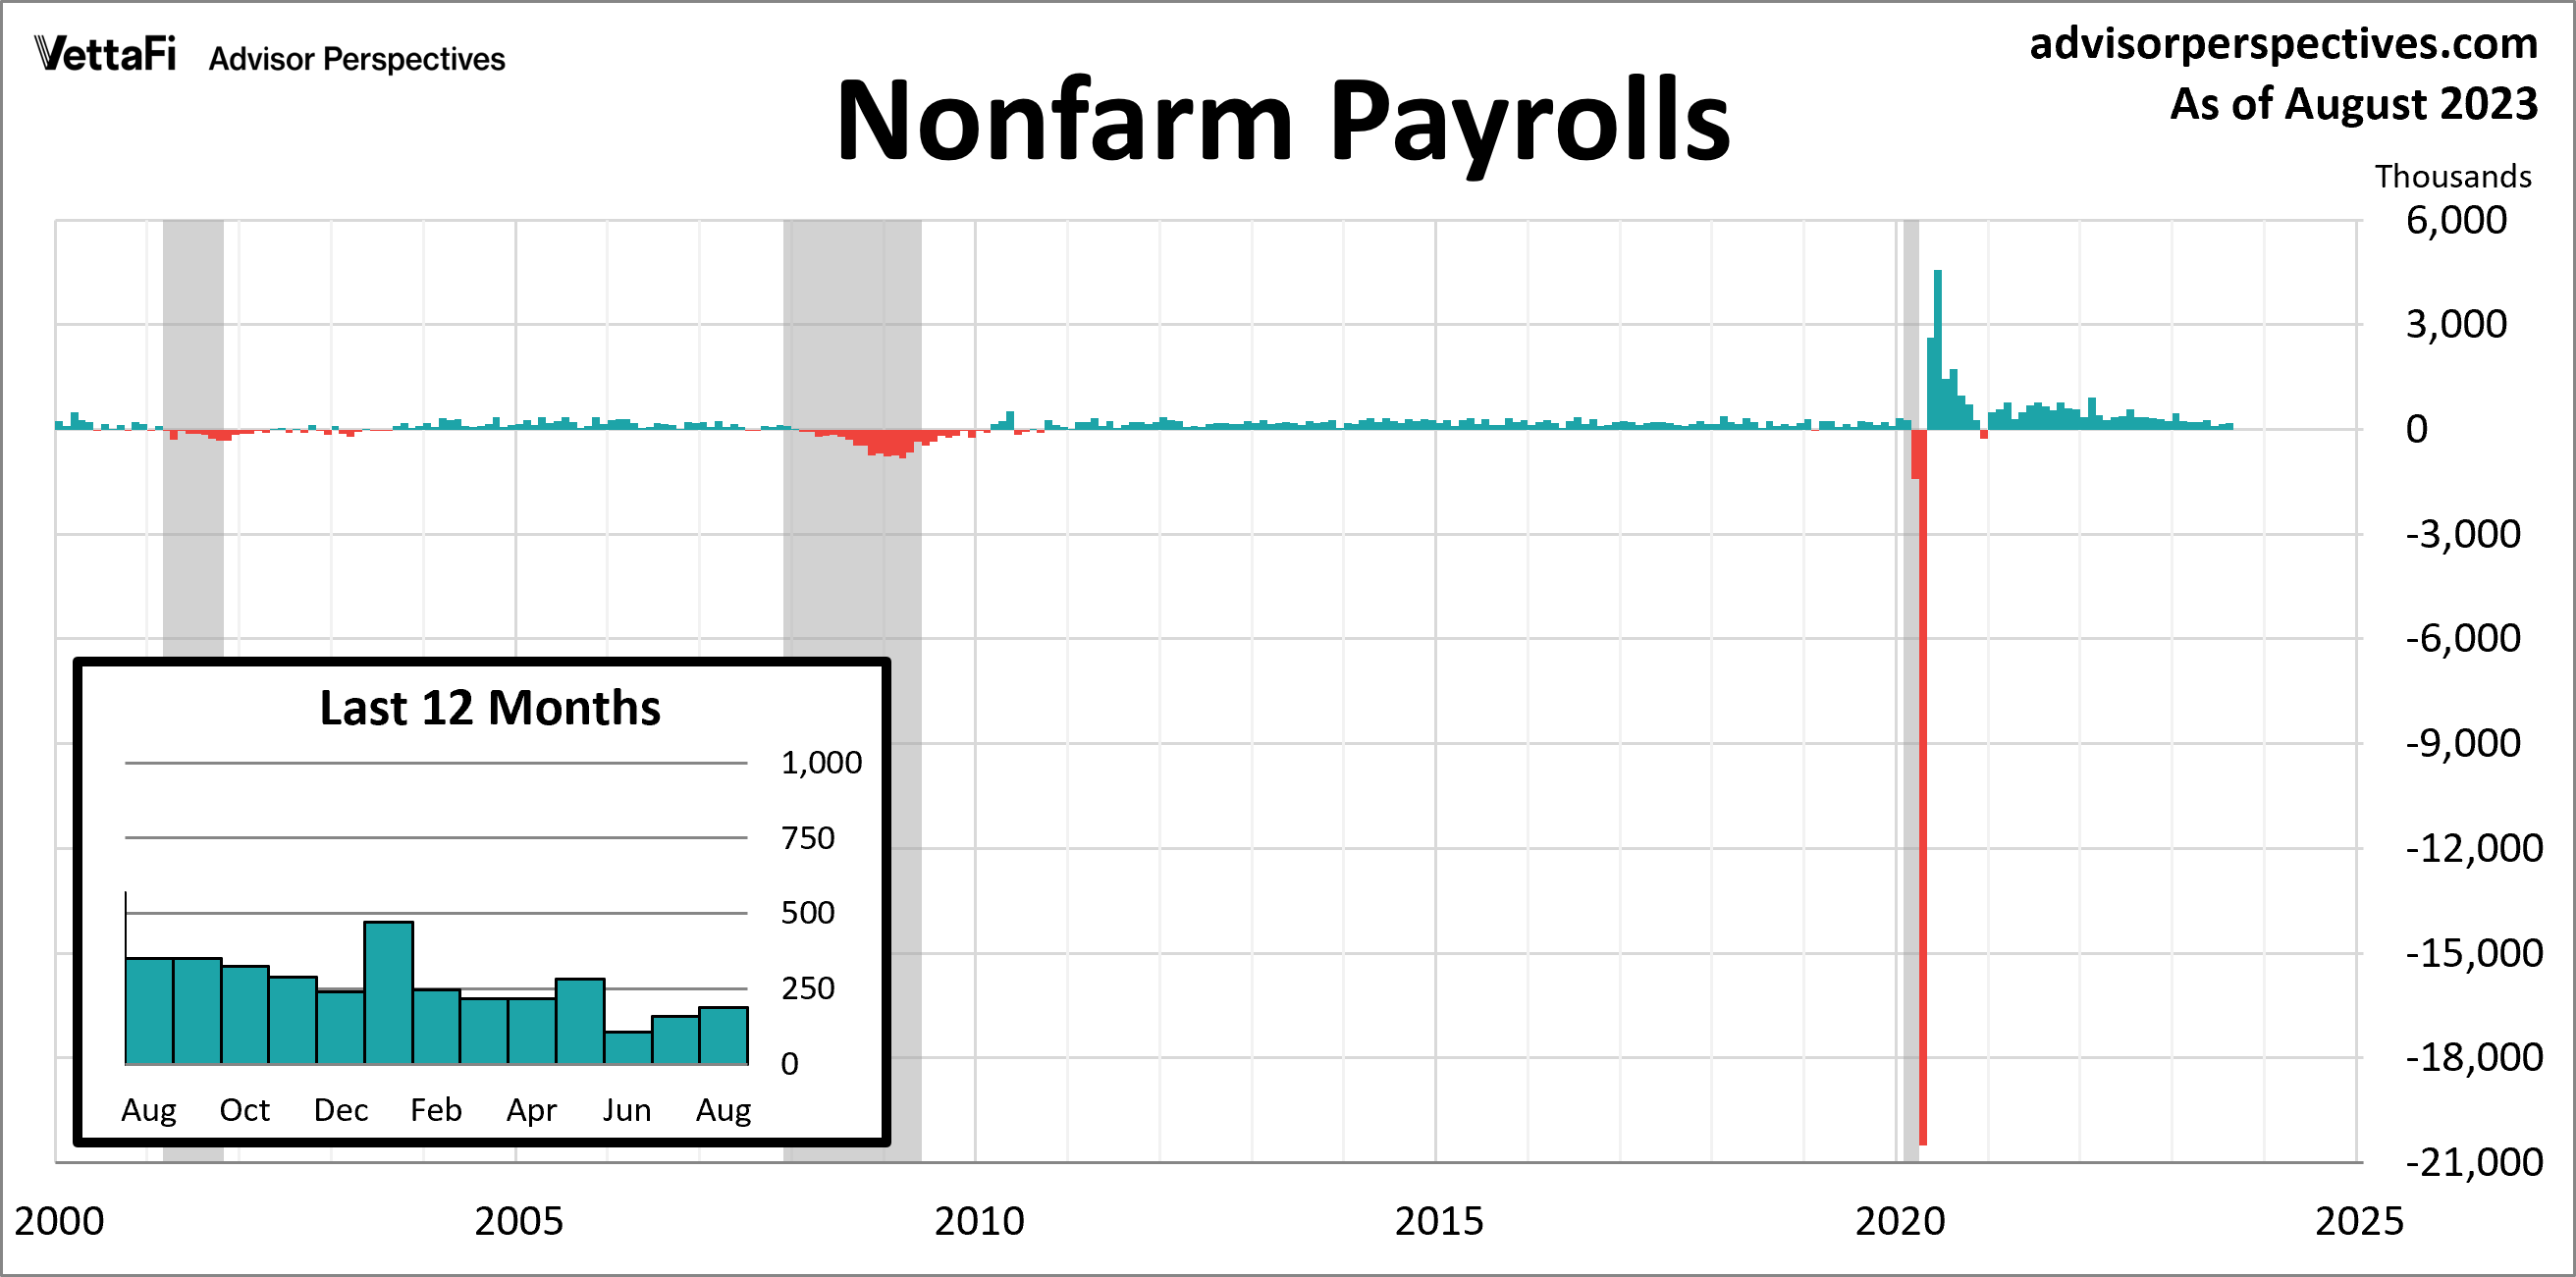
Employment Report
The labor market added jobs for the 32nd consecutive month in August but continued to showed signs of easing. The August employment report revelaed 187,000 jobs were added last month, more than the expected 170,000 addition, and an increase from July’s revised figure of 157,000. Despite the pickup in job growth, the number of jobs added from June to August was the lowest three-month total since early into the pandemic. The report also indicated that the unemployment rate ticked up to 3.8%, its highest level since February 2022 but still low by historical standards. In addition, the labor force participation rate rose for the first time in six months to 62.8%, while wage growth showed signs of easing as it fell to 4.3%. Overall, the jobs report showed signs of a cooling labor market which could help slow the economy and ease inflation, ultimately leading to the sought after “soft landing”. With that being said, the labor market remains resilient, and future rate hikes remain a very real possibility.
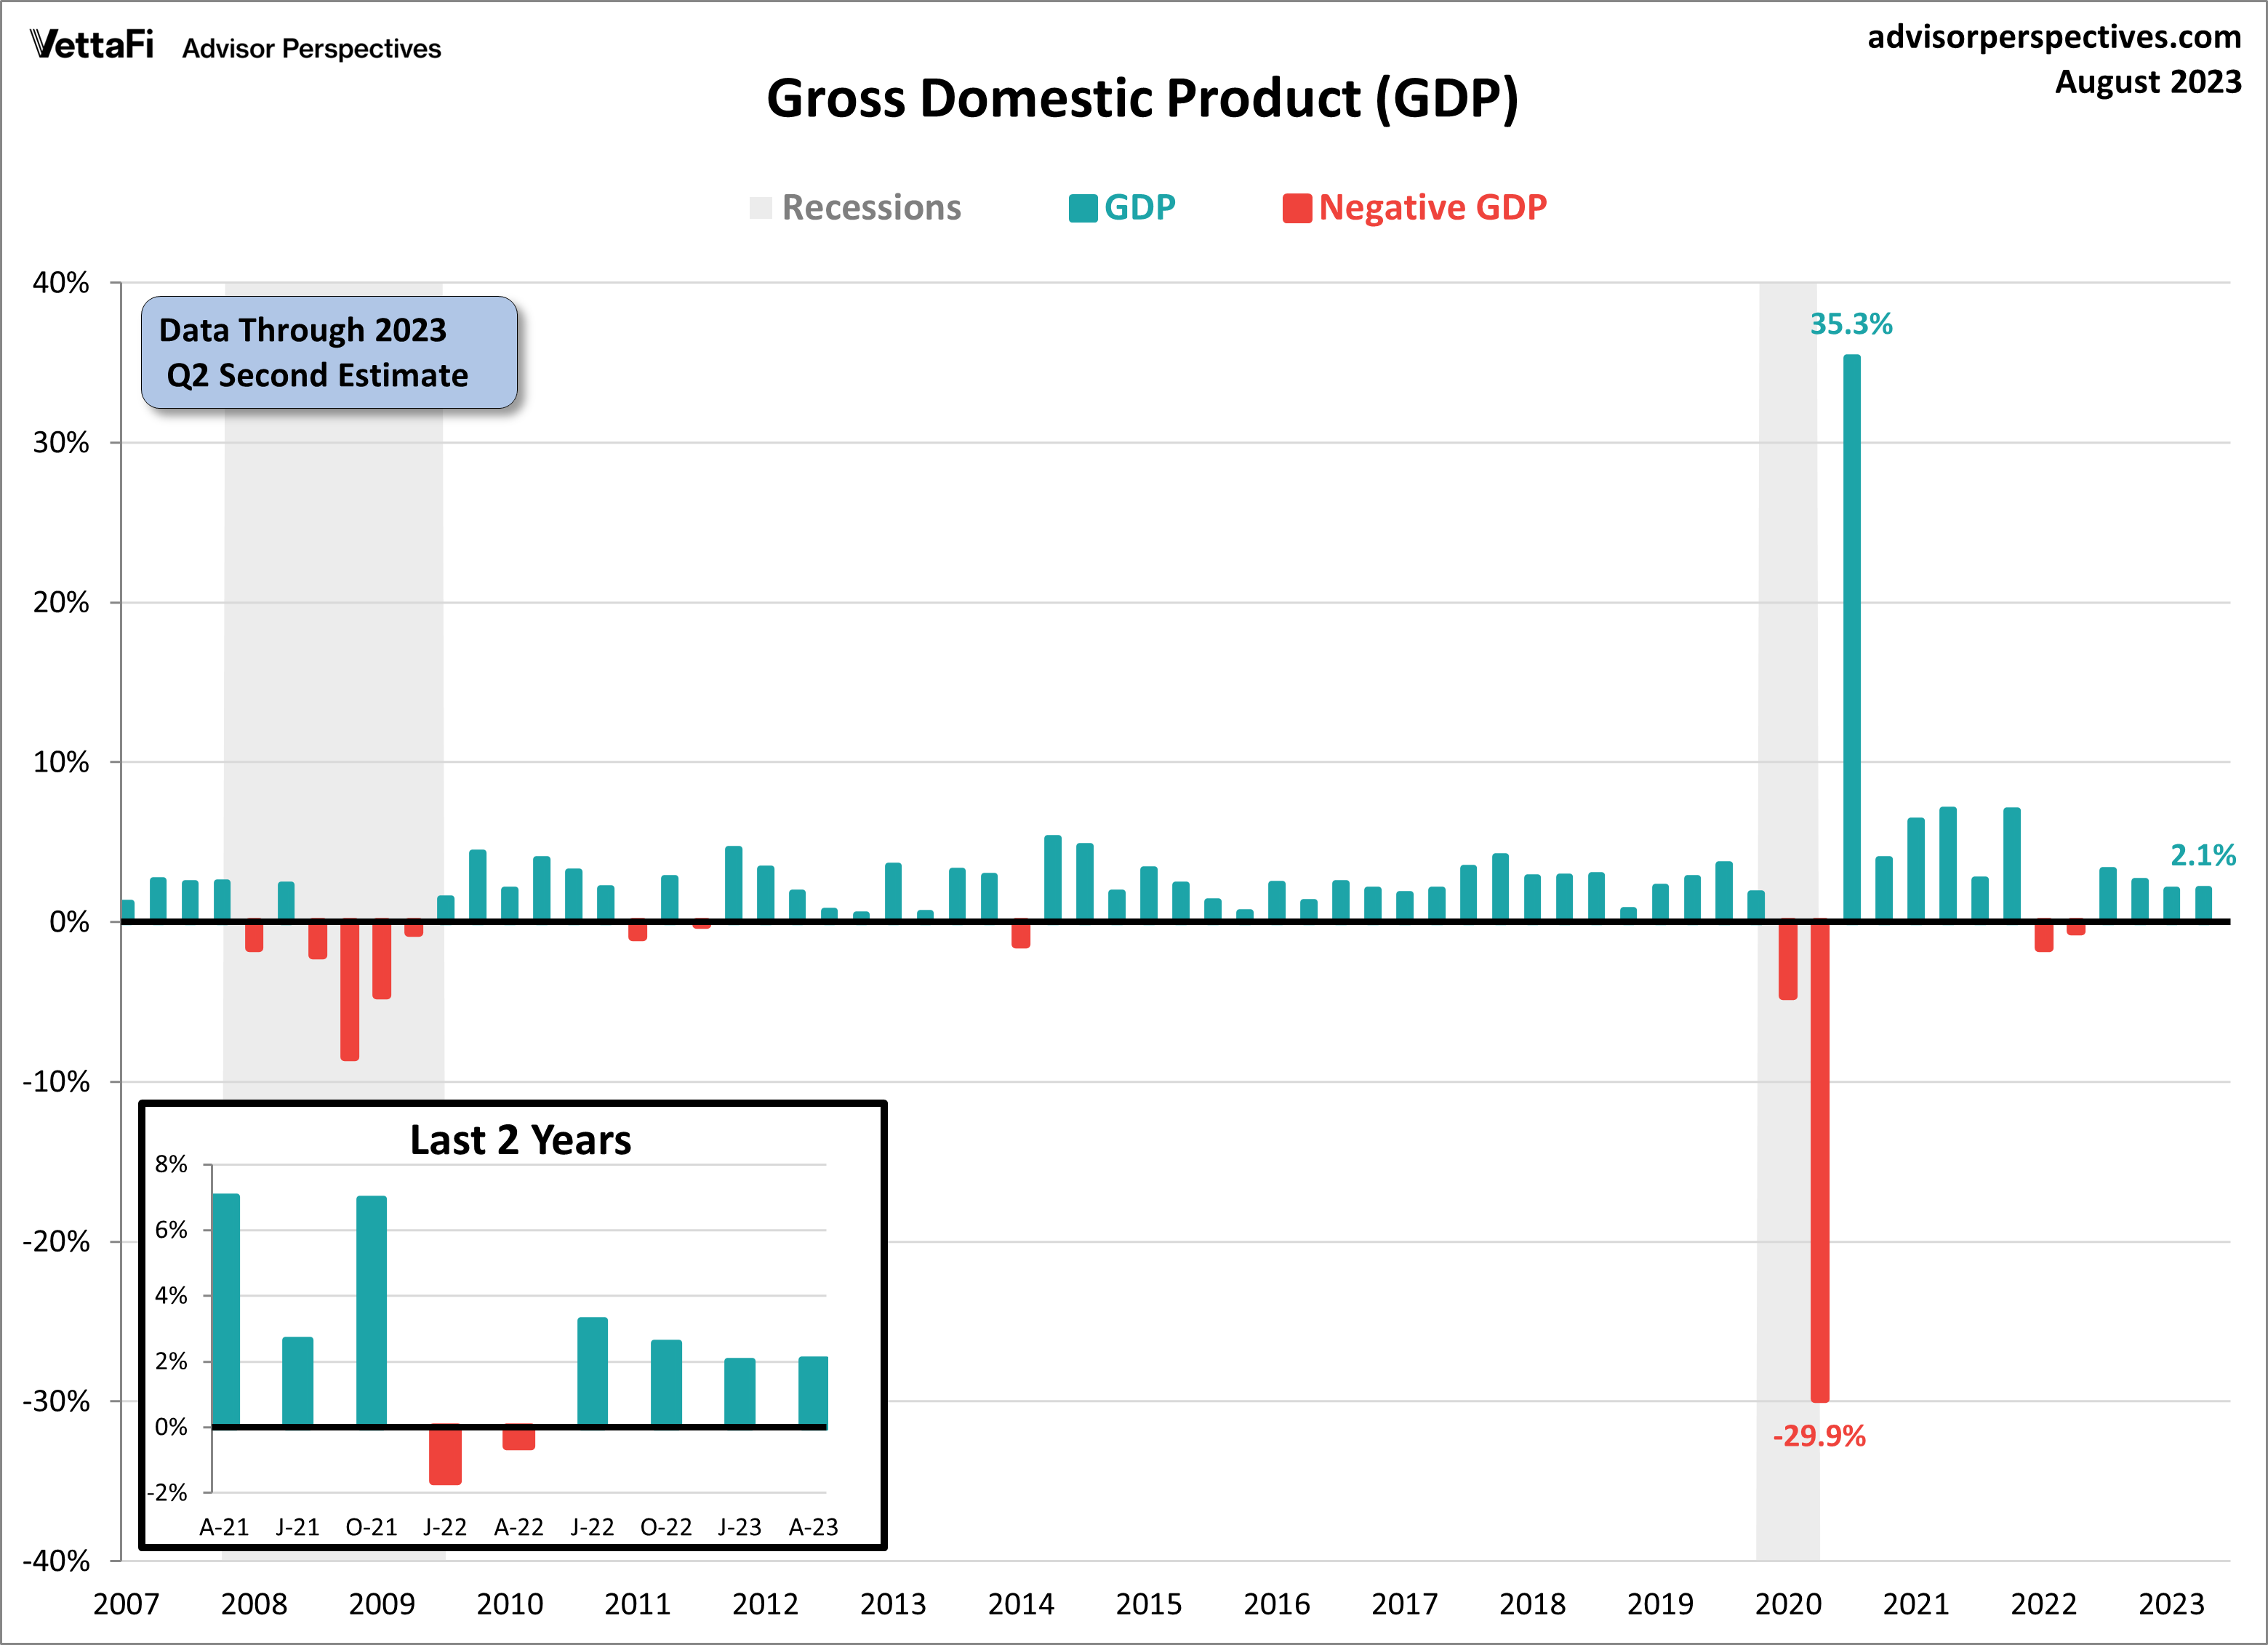
Gross Domestic Product (GDP)
In the second quarter of 2023, the U.S. economy continued to move forward, though at a slower pace than initially thought – a positive sign for the Federal Reserve in their fight against inflation. The second estimate for Q2 2023 Gross Domestic Product (GDP) reveals that the economy expanded at an annual rate of 2.1%, a slight adjustment from the initial estimate of 2.4% growth reported last month. Despite this downward revision, it represents a slight pick-up from the 2.0% growth recorded in the first quarter. In recent quarters, concerns had arisen about the possibility of the economy slowing down and possibly heading into a recession due to the noticeable deceleration in GDP growth. However, the positive GDP figures for the first half of the year underscore the resilience of the economy and bolster confidence that a recession may be avoided after all.
Exploring the factors behind this revision reveals that consumers have displayed remarkable resilience amidst the challenging economic landscape characterized by inflationary pressures and rising interest rates. Consumer spending was revised slightly higher this month, indicating continued strength, and made the largest contribution to real GDP growth among the four subcomponents. Conversely, net exports of goods and services emerged as the sole negative contributor among the four components in Q2. Government spending saw a significant upward revision but was offset by declines in business spending and exports, which ultimately led to the overall downward revision in GDP growth.
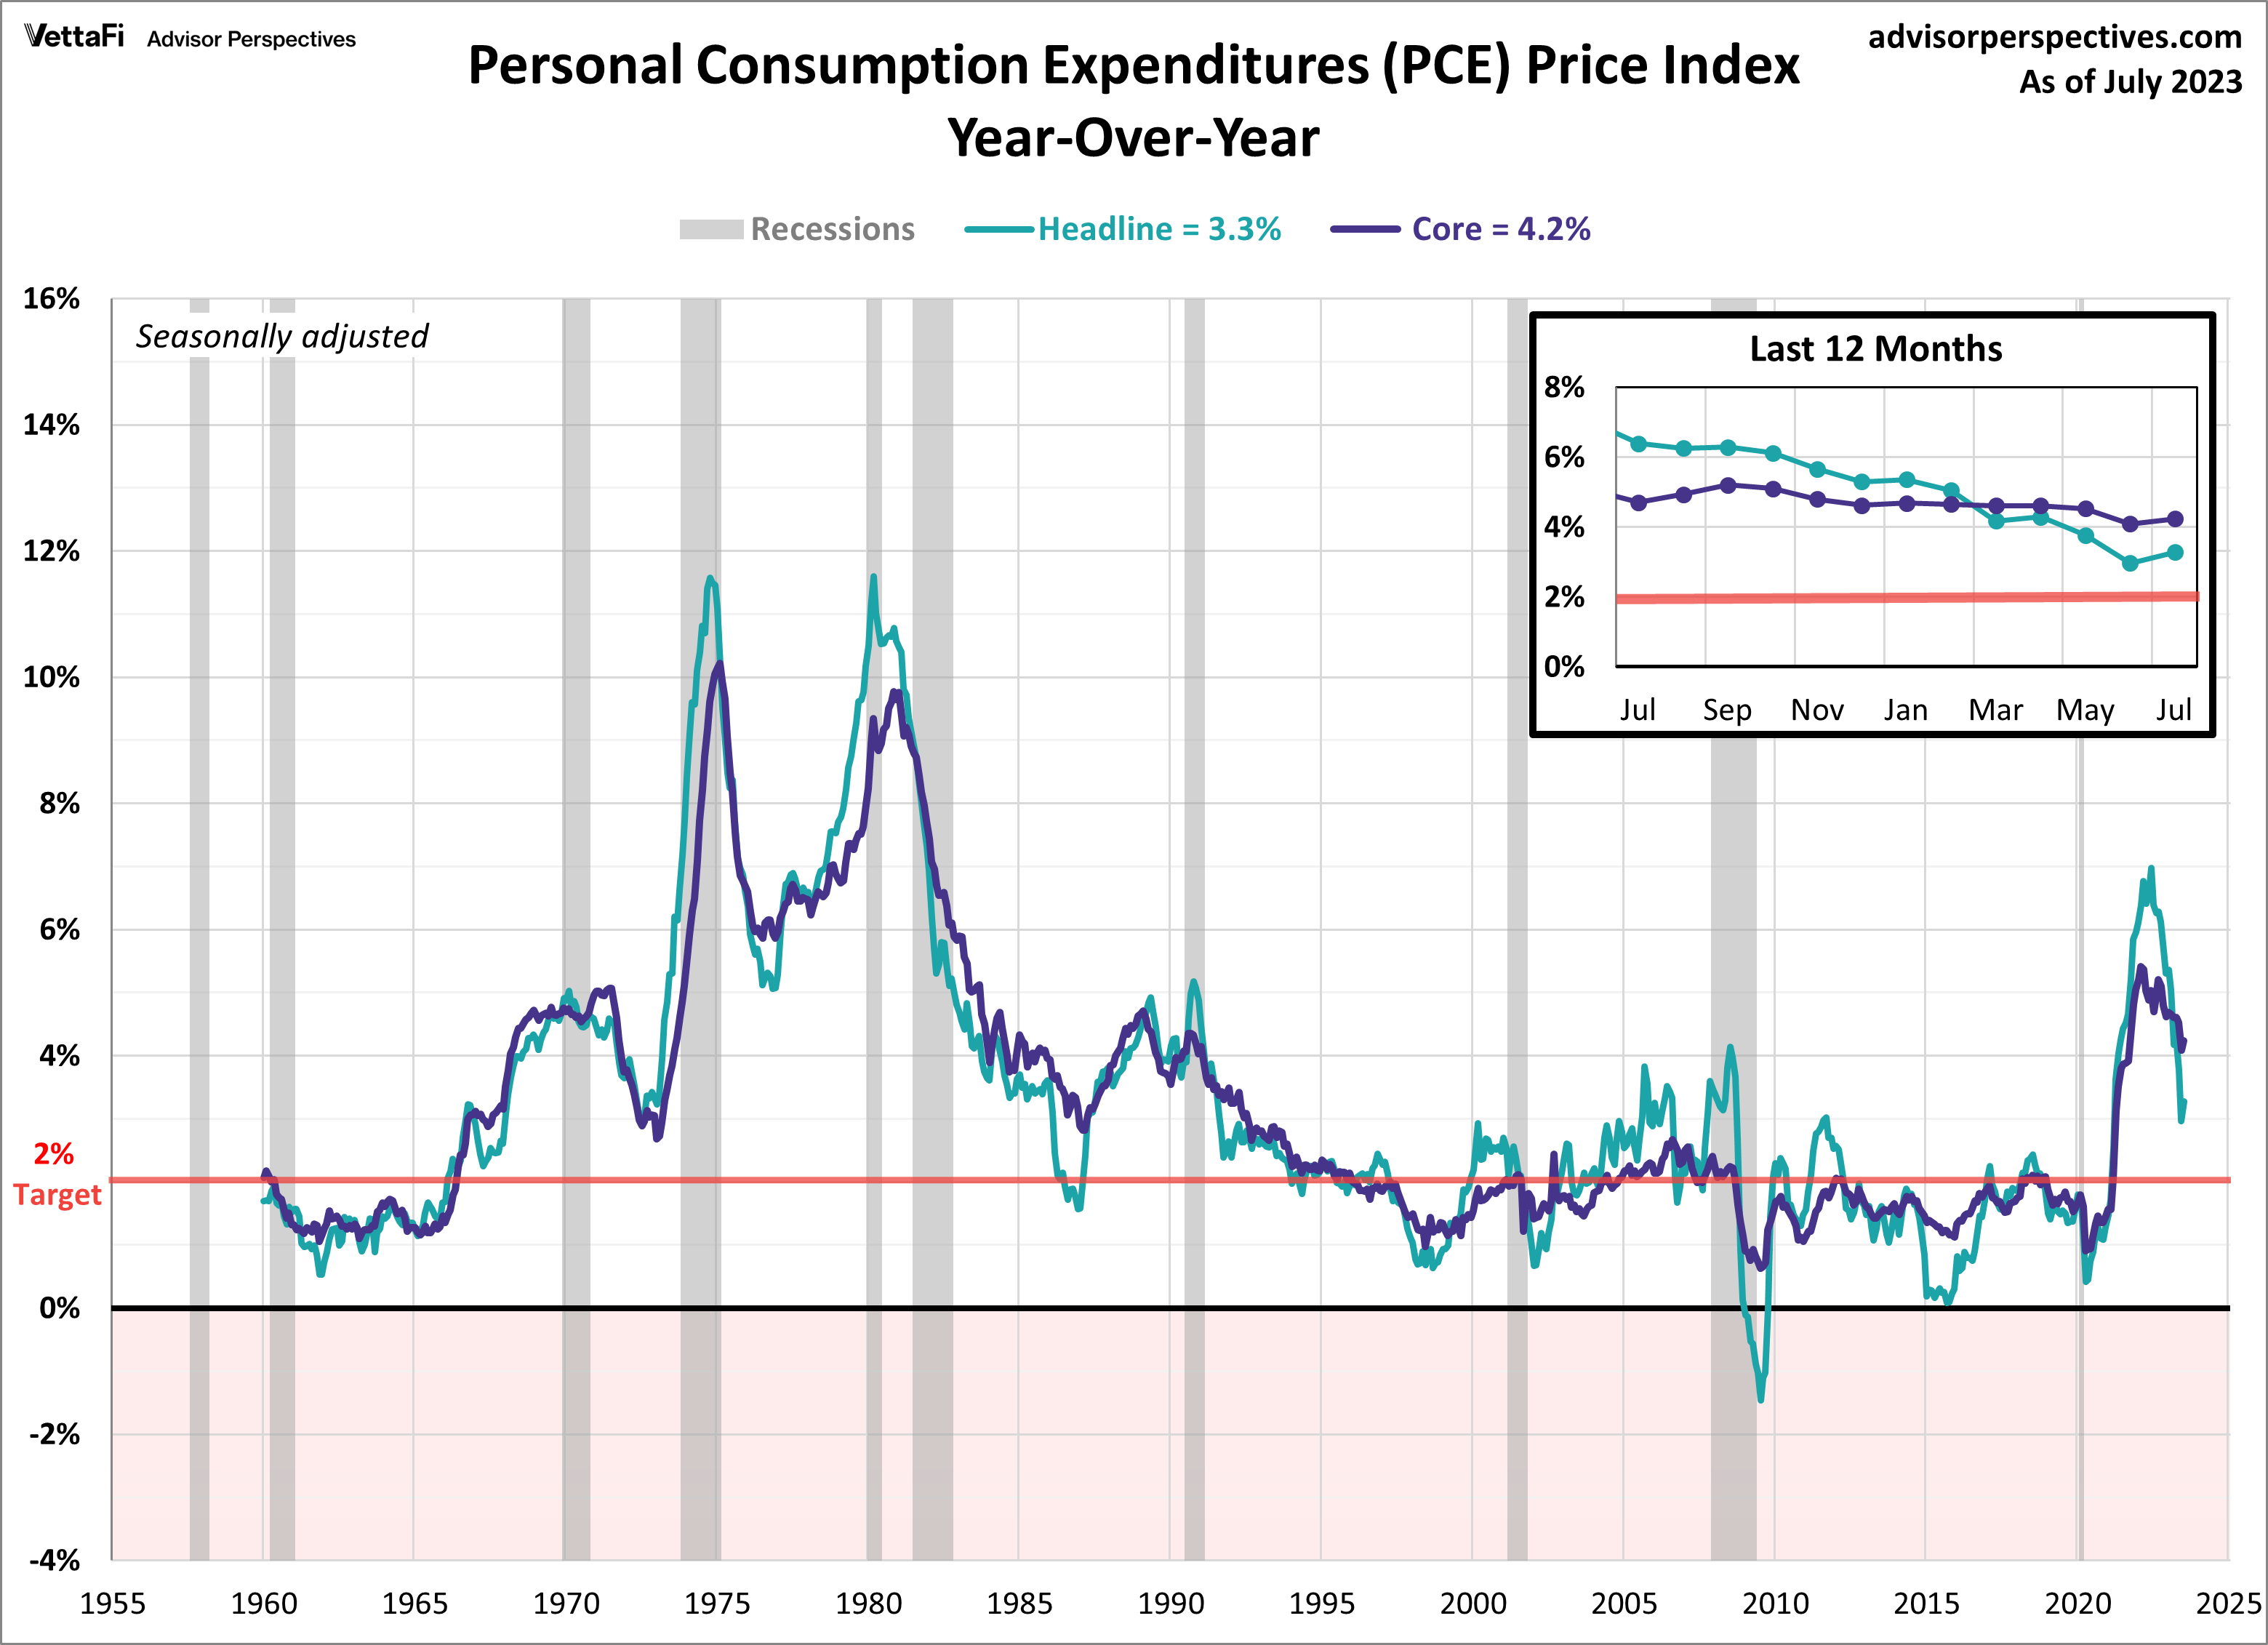
Personal Consumption Expenditures (PCE)
Inflation edged higher in July as consumers continued to open their wallets. The PCE price index rose 3.3% compared to a year ago, an acceleration from 3.0% last month. Core PCE, better known as the Fed’s preferred inflation gauge, also ticked up in July to 4.2% from 4.1% in June. On a monthly basis, both headline and PCE increased by 0.2% from June. All readings were consistent with forecasters’ expectations. Core PCE inflation remains well above the Fed’s 2% target rate and the latest data could give cause for potential future hikes later this year.
Economic Indicators and the Week Ahead
The upcoming week will be quieter than usual but there are still some important economic indicators to keep an eye out for– August’s S&P Global Services PMI, August’s ISM Services PMI, and July’s data on the U.S. trade deficit. The PMI reports will provide timely insights into the strength of the country’s services sector, while the trade balance report will reveal the latest trajectory of the country’s economic growth. The S&P Global Services PMI is expected to fall for a 3rd consecutive month to 51.0. The ISM Services PMI is forecasted to inch down to 52.6 from 52.7 in July. Lastly, the trade deficit is expected to expand for first time in 3 months to -$65.80 billion.
For more news, information, and analysis, visit the Innovative ETFs Channel.
