
“In the short run, the market is a voting machine but in the long run, it is a weighing machine.”
— Benjamin Graham
The View From 30,000 Feet
The short holiday week was light on data releases but heavy on two topics investors should be carefully watching: The likes of consumer resiliency based on the earliest readings on Black Friday sales and the degree to which the Artificial Intelligence theme continues support the idiosyncratic tendencies of the markets concentrated in the Magnificent 7. Consumer resiliency and the AI theme were perhaps the two most important drivers of returns in 2023, and we received a check in on each last week. Not to be discounted, University of Michigan provided additional readings of consumer attitudes, with particular importance that should be drawn to inflation expectations. Nvidia’s earnings overwhelmed, but the markets were underwhelmed. On balance, the equity markets continued to drift higher, with the NASDAQ taking out a 22- month high, supported by the soft-landing thesis for 2024 that has become consensus and optimism that Fed will embark on rate cutting campaign for all the right reasons in the coming year. Seasonality, resilient economic activity and momentum continue to point towards short-term strength in equities, while larger questions loom around whether the expectations for rate cuts in 2024 will be driven by bullish factors for equities or bearish factors, each of which carries different consequences for asset allocation and portfolio construction, reminding us of this week’s Thought to Ponder, and the implications for the new year.
- Black Friday provides the first read on health (and hedonism) of the S. consumer
- Leading Economic Indicators point to risks, while Coincident Economic Indicators raises questions about timing
- Inflation expectations anchored, but stubbornly high
- The most Frequently Asked Question from clients this week: Markets are forecasting rate cuts in 2024, but are they bullish cuts are bearish cuts?
Black Friday provides the first read on health (and hedonism) of the U.S. consumer
- Black Friday by the numbers: (note, each data source reports on the information related to their cross section of customers)
- American consumers took to the street on Friday, spending $9.8b, up 5%, according to Adobe analytics, who also forecasts that spending will total $37.2b between Friday and Monday, netting an annual increase of 5.4%.
- com confirmed Adobe estimates, showing a 9% rise across their online network.
- Sensormatic, provided a separate report indicating that brick-and-mortar visits increased 6% over 2022. While RetailNext, who provides similar scanning of foot traffic, provided data that showed a more modest increase of 2%.
- Mastercard Spendingpulse was up +2.5% year-over-year, with ecommerce making up the majority of the gains, increasing 5%, while in-store sales increased a more modest 1.1%.
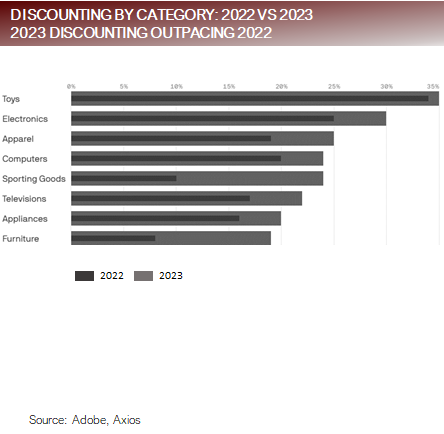
- Discounting was a major theme with the categories of Electronics, Toys and Apparel showing discounts of 25% to 35%, outpacing 2022 discounting, according to Adobe Analytics.
- Context
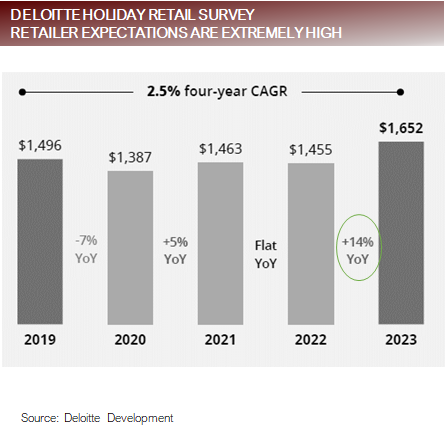
- The historical average increase of holiday spending was 6% between 2010 and 2019, according to the National Retail Federation.
- Mastercard Spendingimpusle is looking for a 7% increase, roughly inline with historical averages.
- The National Retail Federation agrees, expecting holiday spending to increase 3% to 4%.
- Retailers plan to hire 410k workers for the holiday season according to the Bureau of Labor If this is the case it will mark the lowest number of seasonal workers since 2008, and well below the Q42022 hiring of 519k.
- Bottom Line
- Disinflation has been a major theme of goods in the last The Adobe Digital Price Index, which measures goods inflation across their network shows good prices fell -4.6% in the last year, led by electronics, which were down nearly -12%.
- Disinflation and a return to normal spending growth patterns are major trends this holiday In addition, there is a slight negative bias seen with the high levels of discounting and stores hiring less workers than normal, which may bode well for productivity.
High expectations and monster discounts show strain in the system and potential disappointment
Leading Economic Indicators point to risks, Coincident Economic Indicators raises questions timing
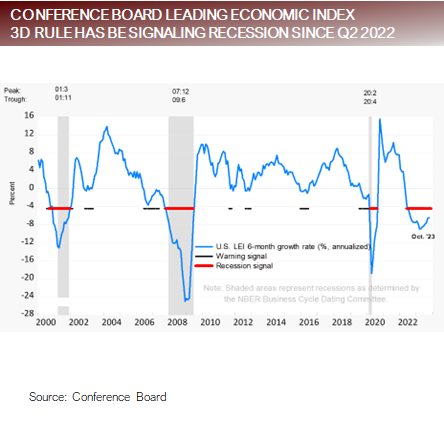
- The Conference Board Leading Economic Index (LEI) measured -7.6 on its latest data release, marking the 19th month below zero.
- There have been 6 recessions since Excluding the recession that began 7/1/1980, because it was part of a double dip recession where the LEI didn’t recover above zero, the average number of months the LEI turned negative before the recession began was 8.6 months, making the current 19-month streak uncharacteristically long.
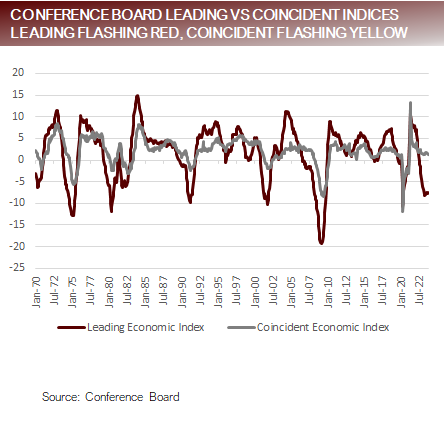
- The Conference Board Coincident Economic Index (CEI) measured 1.3 on its latest data release, hanging near and important threshold. Since 1980 that average value of Coincident Economic Index when the LEI was negative, and a recession transpired, was 1.38.
- Together this suggests that according to the LEI a recession is past due, and according to the CEI, we are hovering near the level where we might expect it to begin.
- The Conference Board has developed a rule called the 3D Rule that they use to forecast a recession based on the LEI. The 3D’s stand for Duration, Depth and Diffusion. The 3D Rule has been forecasting a recession since Q2 2022.
- Bottom Line
- According to the Leading Economic Index, a recession is overdue. According to the Coincident Economic Index, a recession is coming due, but we are narrowly hanging on. The indicators continue to raise concern, but it’s likely that the massive government stimulus programs, changes in demand patterns, consumer and companies success in terming out their debt and structural shifts in the employment market are creating noise in the signal, calling to question it precision as a timing tool.
Conference Board’s Leading Index has been flashing red but not confirmed by coincident data yet
Inflation expectations anchored, but stubbornly high
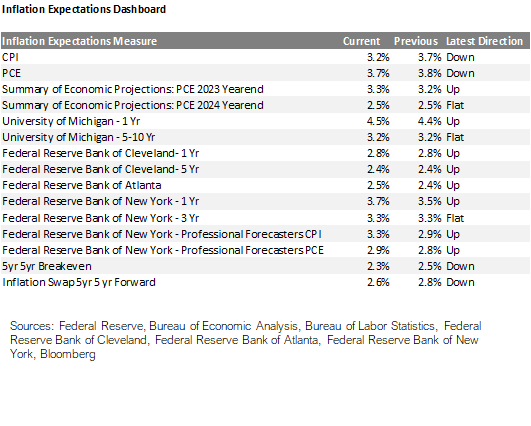
- Last week’s release of Inflation Expectations from the University of Michigan survey indicated that both 1 yr and 5-10 yr inflation expectations surprised on the upside from consensus expectations. In addition, 1 yr inflation expectations moved higher. This comes as a surprise, given that gasoline prices, a major driver, have been steadily trending lower in this period.
- Observations from the Focus Point Inflation Expectations Dashboard provides more information:
-
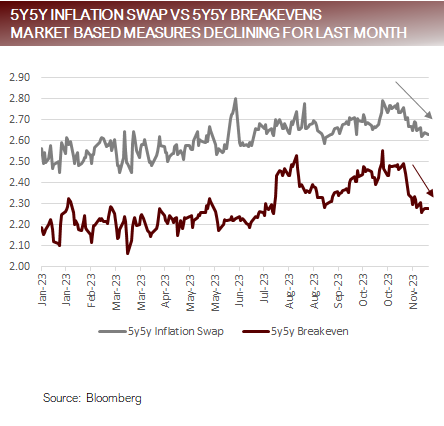
- Market based measures including breakeven’s and inflation swaps have been trending lower, indicating markets believe inflation will fall faster than expected.
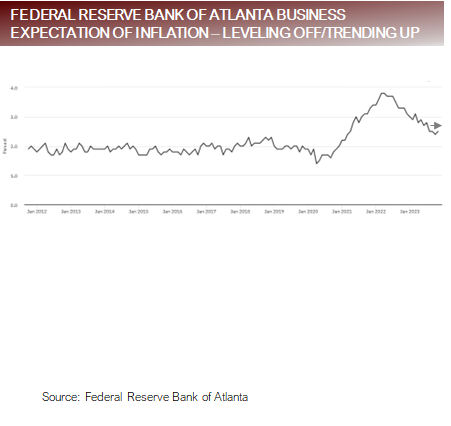
- Survey data from the Federal Reserve Banks, including Cleveland, New York and Atlanta are showing that inflation expectations have moved slightly higher, suggesting that those surveyed may not be in agreement with market-based forecasts.
- The Fed’s forecasts from the SEP, is that PCE will end the year at 3.3%. The average survey estimate for the next release is 3.5% on the release date of 11/30.
Market-based measures and survey-based measures of inflation expectations diverging
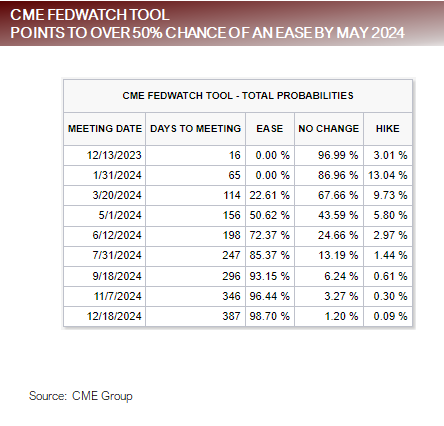
FAQ: Markets are forecasting rate cuts in 2024, but are they bullish cuts are bearish cuts?
- There are two reasons the Fed would cut next year: Bullish Cut and Bearish Cut
• Bullish Cut
-
- A Bullish Cut would result from inflation falling faster then expected towards the Fed’s targeted
- In a soft-land world, the reduction in inflation would coexist with a resilient labor market, which would preserve consumer spending and allow the economy to keep growing above trend, or perhaps a slight hiccup in growth below Neither of which is expected to derail a steady increase in equity prices.
- A Bullish Cutting cycle would likely be a slower series of cuts, inline with Fed guidance and market expectations for a soft-landing.
• Bearish Cut
-
- A Bearish Cut would result from the Fed taking a more balanced view of their dual mandate of price stability and full
- In this scenario, the labor markets would weaken dramatically, and irrespective of where inflation is at the time, the Fed would be forced to cut rates because they would perceive the threats to full employment to be larger than the threats of inflation given the trajectory of the
- A Bearish Cutting cycle would likely be a series of swifter cuts designed to buttress the economy from economic data the signals a deterioration is progressing faster than the Fed or markets Bearish cuts would likely bring volatility because a weaker labor market would create a feedback loop with consumer spending that would jeopardize earnings estimates and the expected drift higher of equities.
- In a nutshell, these two scenarios represent the two major scenarios being thrown around by strategists, a soft-landing or a hard landing. There are additional possibilities, that will be included when we publish ou4 2024 outlook, which include Persistent Inflation, Surprising Resiliency.
Expectations for rate cuts tied to continued slowing of inflation and controlled slowing of labor markets
Putting it all together
- Black Friday sales expectations (which fell inline with historical norms) and Nvidia’s earnings (which blew away forecasts but didn’t live up to the AI hype trade) weren’t enough to excite the markets much last
- Normalization is becoming a key word. A return to more normalized growth trends in retail sales this holiday season looks in the cards, as consumer Balance Sheets normalize and wage growth slows (normalizes) from astronomical rates. This may lead to economic growth that more closely aligns with the Fed’s expectation for below trend
- The soft-landing narrative has become the consensus call for 2024, centering around falling inflation, declining rates and a continued resiliency in the labor markets.
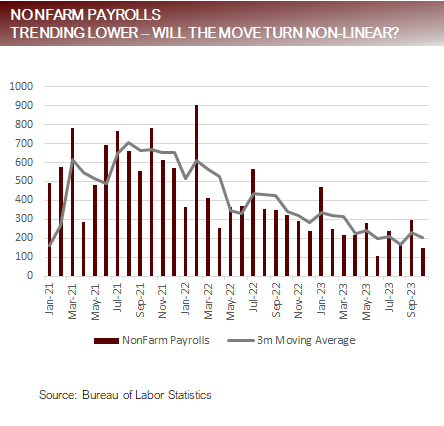
- The major risks in the 2024 consensus call is the labor markets. Ultimately with two-thirds of the economy is tied to consumer spending, so the employment market will hold the key to if a soft-landing is achievable.
- An assumption overlooked in the soft-landing narrative is that the economy can continue to grow anywhere near trend with real rates above 2%, and the Fed pinning rates at over 200 bps above estimates of So far this has been the case because consumers and companies successfully termed out their debt during the pandemic, but the government wasn’t as savvy and didn’t term out theirs. With each month more and more debt comes due and will need to be refinanced at market rates, and the government needs to borrow more and more at higher rates. When exactly the pinch from higher rates catches up with the economy is going to be difficult to pin down, but it’s hard to imagine that it never does.
DISCLOSURES AND IMPORTANT RISK INFORMATION
Performance data quoted represents past performance, which is not a guarantee of future results. No representation is made that a client will, or is likely to, achieve positive returns, avoid losses, or experience returns similar to those shown or experienced in the past.
Focus Point LMI LLC
For more information, please visit www.focuspointlmi.com or contact us at [email protected]
Copyright 2023, Focus Point LMI LLC. All rights reserved.
The text, images and other materials contained or displayed on any Focus Point LMI LLC Inc. product, service, report, e-mail or web site are proprietary to Focus Point LMI LLC Inc. and constitute valuable intellectual property and copyright. No material from any part of any Focus Point LMI LLC Inc. website may be downloaded, transmitted, broadcast, transferred, assigned, reproduced or in any other way used or otherwise disseminated in any form to any person or entity, without the explicit written consent of Focus Point LMI LLC Inc. All unauthorized reproduction or other use of material from Focus Point LMI LLC Inc. shall be deemed willful infringement(s) of Focus Point LMI LLC Inc. copyright and other proprietary and intellectual property rights, including but not limited to, rights of privacy. Focus Point LMI LLC Inc. expressly reserves all rights in connection with its intellectual property, including without limitation the right to block the transfer of its products and services and/or to track usage thereof, through electronic tracking technology, and all other lawful means, now known or hereafter devised. Focus Point LMI LLC Inc. reserves the right, without further notice, to pursue to the fullest extent allowed by the law any and all criminal and civil remedies for the violation of its rights.
All unauthorized use of material shall be deemed willful infringement of Focus Point LMI LLC Inc. copyright and other proprietary and intellectual property rights. While Focus Point LMI LLC will use its reasonable best efforts to provide accurate and informative Information Services to Subscriber, Focus Point LMI LLC but cannot guarantee the accuracy, relevance and/or completeness of the Information Services, or other information used in connection therewith. Focus Point LMI LLC, its affiliates, shareholders, directors, officers, and employees shall have no liability, contingent or otherwise, for any claims or damages arising in connection with (i) the use by Subscriber of the Information Services and/or (ii) any errors, omissions or inaccuracies in the Information Services. The Information Services are provided for the benefit of the Subscriber. It is not to be used or otherwise relied on by any other person. Some of the data contained in this publication may have been obtained from The Federal Reserve, Bloomberg Barclays Indices; Bloomberg Finance L.P.; CBRE Inc.; IHS Markit; MSCI Inc. Neither MSCI Inc. nor any other party involved in or related to compiling, computing or creating the MSCI Inc. data makes any
express or implied warranties or representations with respect to such data (or the results to be obtained by the use thereof), and all such parties hereby expressly disclaim all warranties of originality, accuracy, completeness, merchantability or fitness for a particular purpose with respect to any of such data. Such party, its affiliates and suppliers (“Content Providers”) do not guarantee the accuracy, adequacy, completeness, timeliness or availability of any Content and are not responsible for any errors or omissions (negligent or otherwise), regardless of the cause, or for the results obtained from the use of such Content. In no event shall Content Providers be liable for any damages, costs, expenses, legal fees, or losses (including lost income or lost profit and opportunity costs) in connection with any use of the Content. A reference to a particular investment or security, a rating or any observation concerning an investment that is part of the Content is not a recommendation to
buy, sell or hold such investment or security, does not address the suitability of an investment or security and should not be relied on as investment advice.
This communication reflects our analysts’ current opinions and may be updated as views or information change. Past results do not guarantee future performance. Business and market conditions, laws, regulations, and other factors affecting performance all change over time, which could change the status of the information in this publication. Using any graph, chart, formula, model, or other device to assist in making investment decisions presents many difficulties and their effectiveness has significant limitations, including that prior patterns may not repeat themselves and market participants using such devices can impact the market in a way that changes their effectiveness. Focus Point LMI LLC believes no individual graph, chart, formula, model, or other device should be used as the sole basis for any investment decision. Focus Point LMI LLC or its affiliated companies or their respective shareholders, directors, officers and/or employees, may have long or short positions in the securities discussed herein and may purchase or sell such securities without notice. Neither Focus Point LMI LLC nor the author is rendering investment, tax, or legal advice, nor offering individualized advice tailored to any specific portfolio or to any individual’s particular suitability or needs. Investors should seek professional investment, tax, legal, and accounting advice prior to making investment decisions. Focus Point LMI LLC’s publications do not constitute an offer to sell any security, nor a solicitation of an offer to buy any security. They are designed to provide information, data and analysis believed to be accurate, but they are not guaranteed and are provided “as is” without warranty of any kind, either express or implied. FOCUS POINT LMI LLC DISCLAIMS ANY AND ALL EXPRESS OR IMPLIED WARRANTIES, INCLUDING, BUT NOT LIMITED TO, ANY WARRANTIES OF MERCHANTABILITY, SUITABILITY OR FITNESS FOR A PARTICULAR PURPOSE OR USE. Focus Point LMI LLC, its affiliates, officers, or employees, and any third-party data provider shall not have any liability for any loss sustained by anyone who has relied on the information contained in any Focus Point LMI LLC publication, and they shall not be liable to any party for any direct, indirect, incidental, exemplary, compensatory, punitive, special or consequential damages, costs, expenses, legal fees,
For more news, information, and strategy, visit the Innovative ETFs Channel.
