
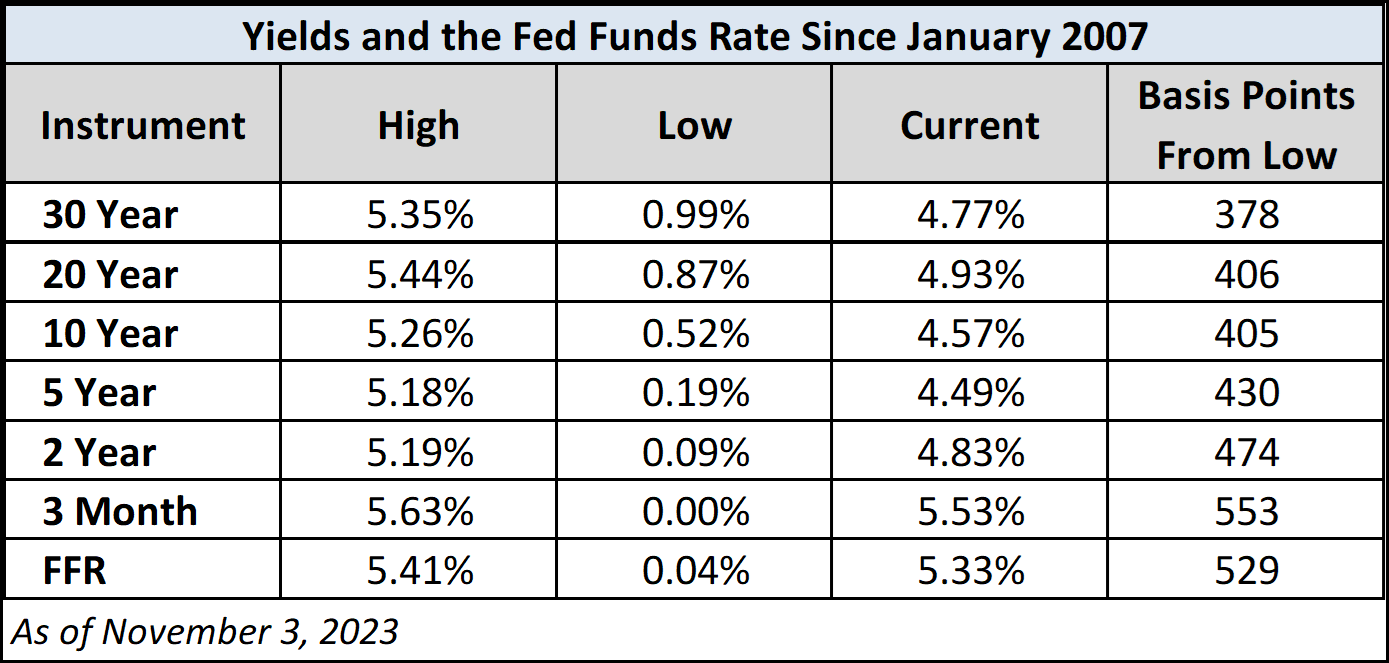
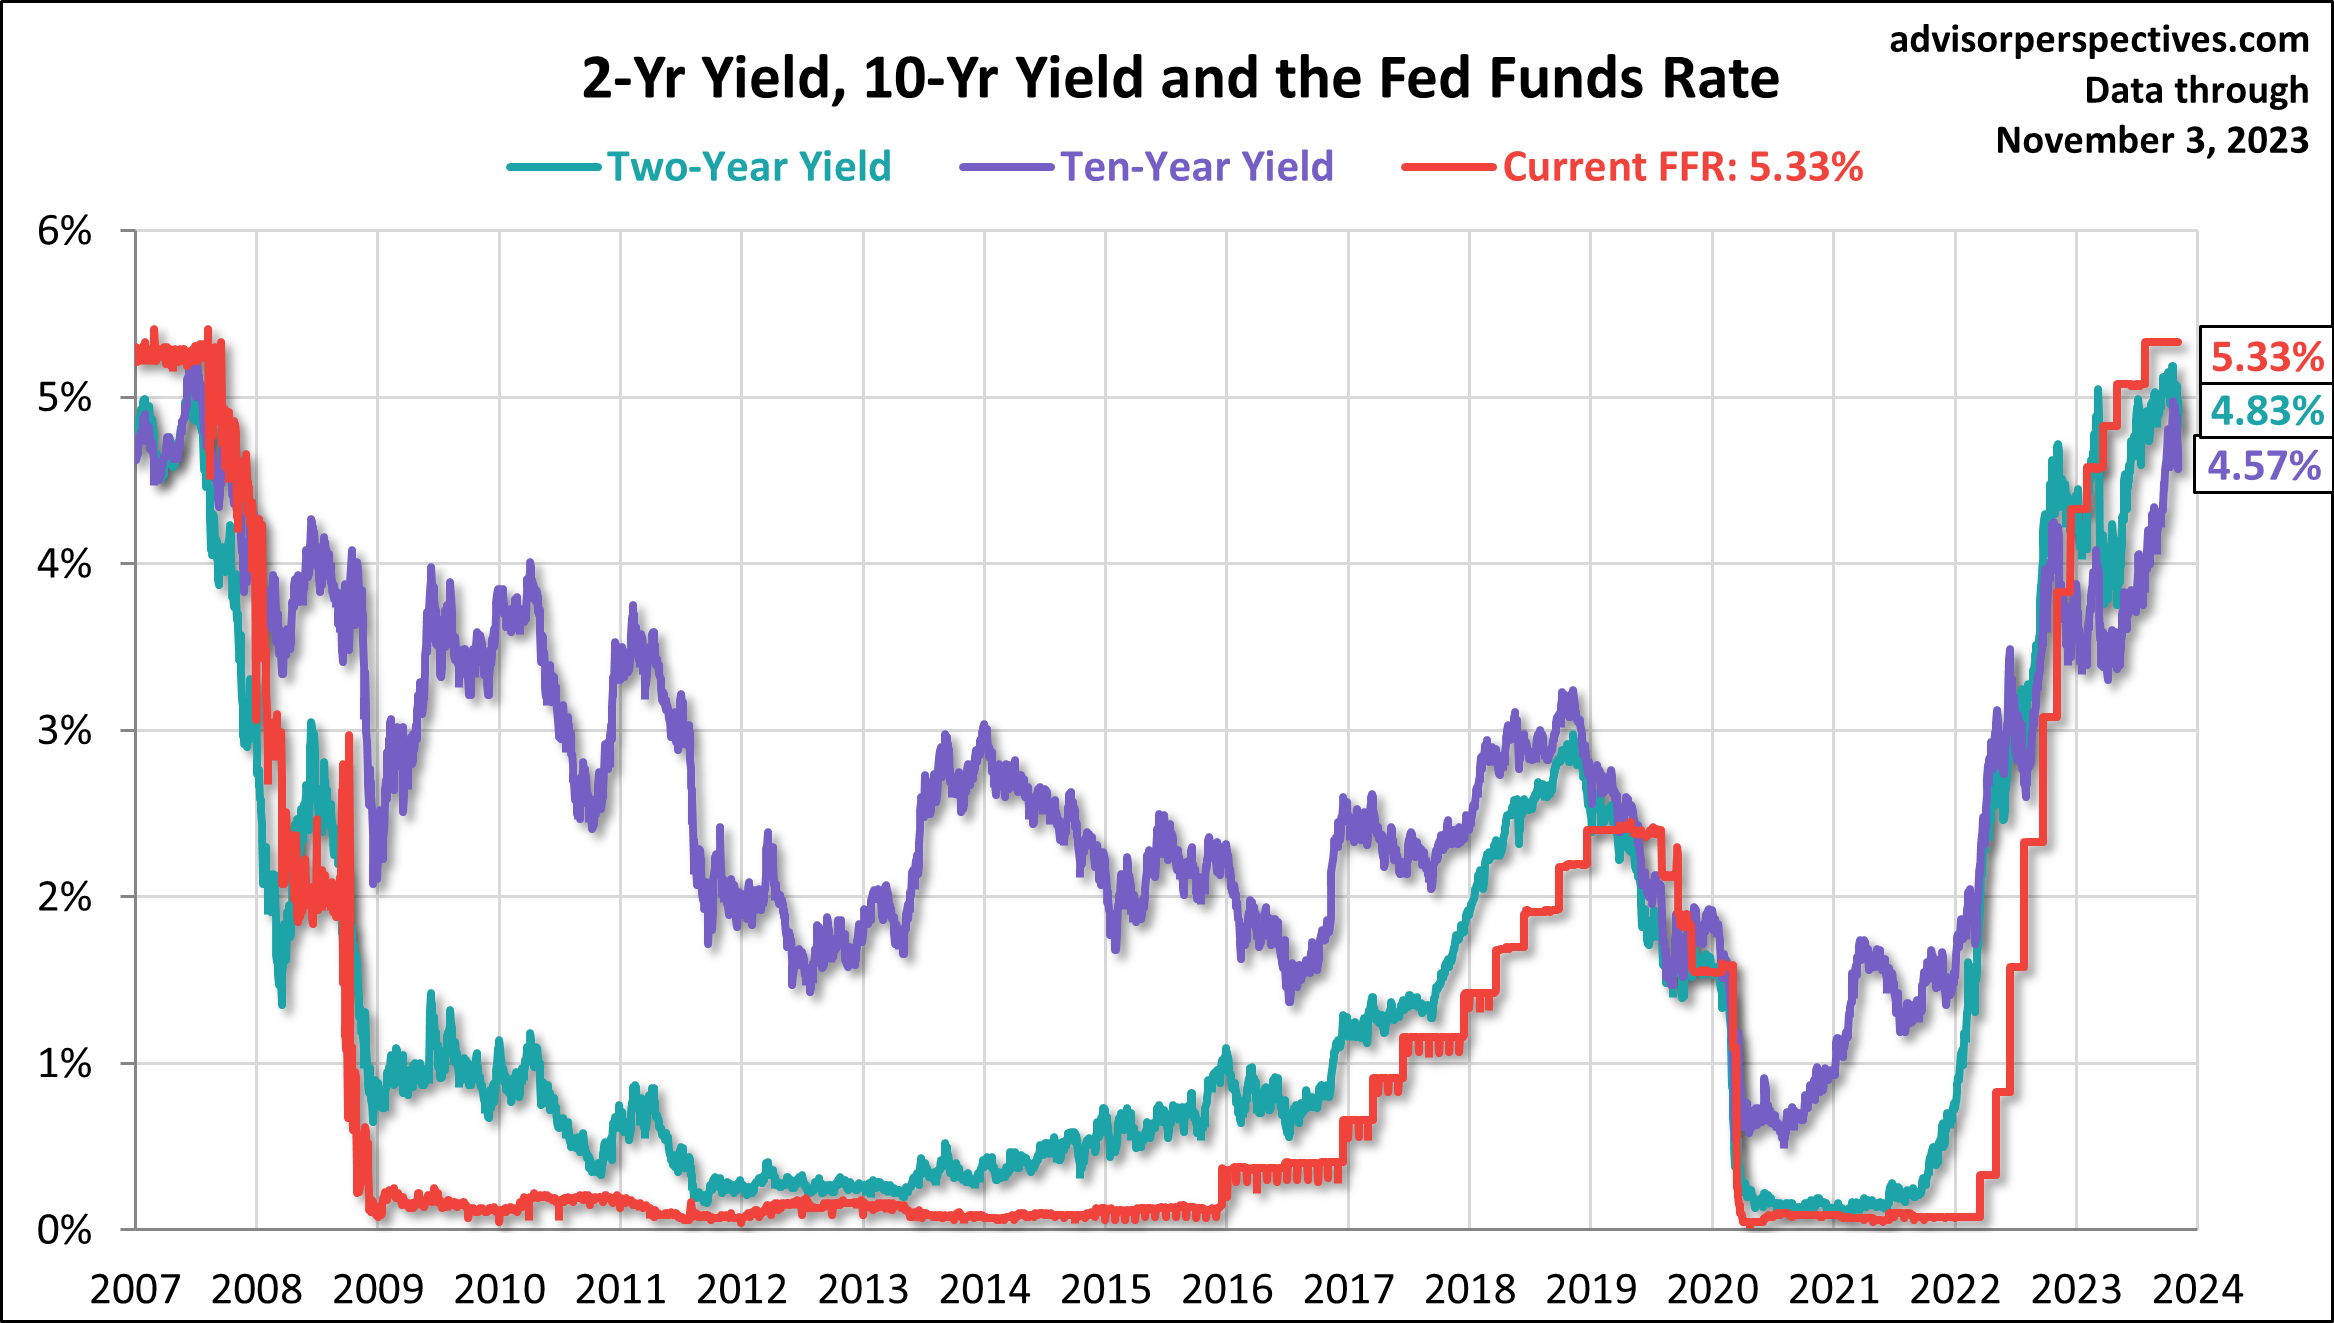
The yield on the 10-year note ended November 3, 2023 at 4.57%, the two-year note ended at 4.83%, and the 30-year at 4.77%.
Here is a table showing the yields’ highs and lows and the FFR since 2007.
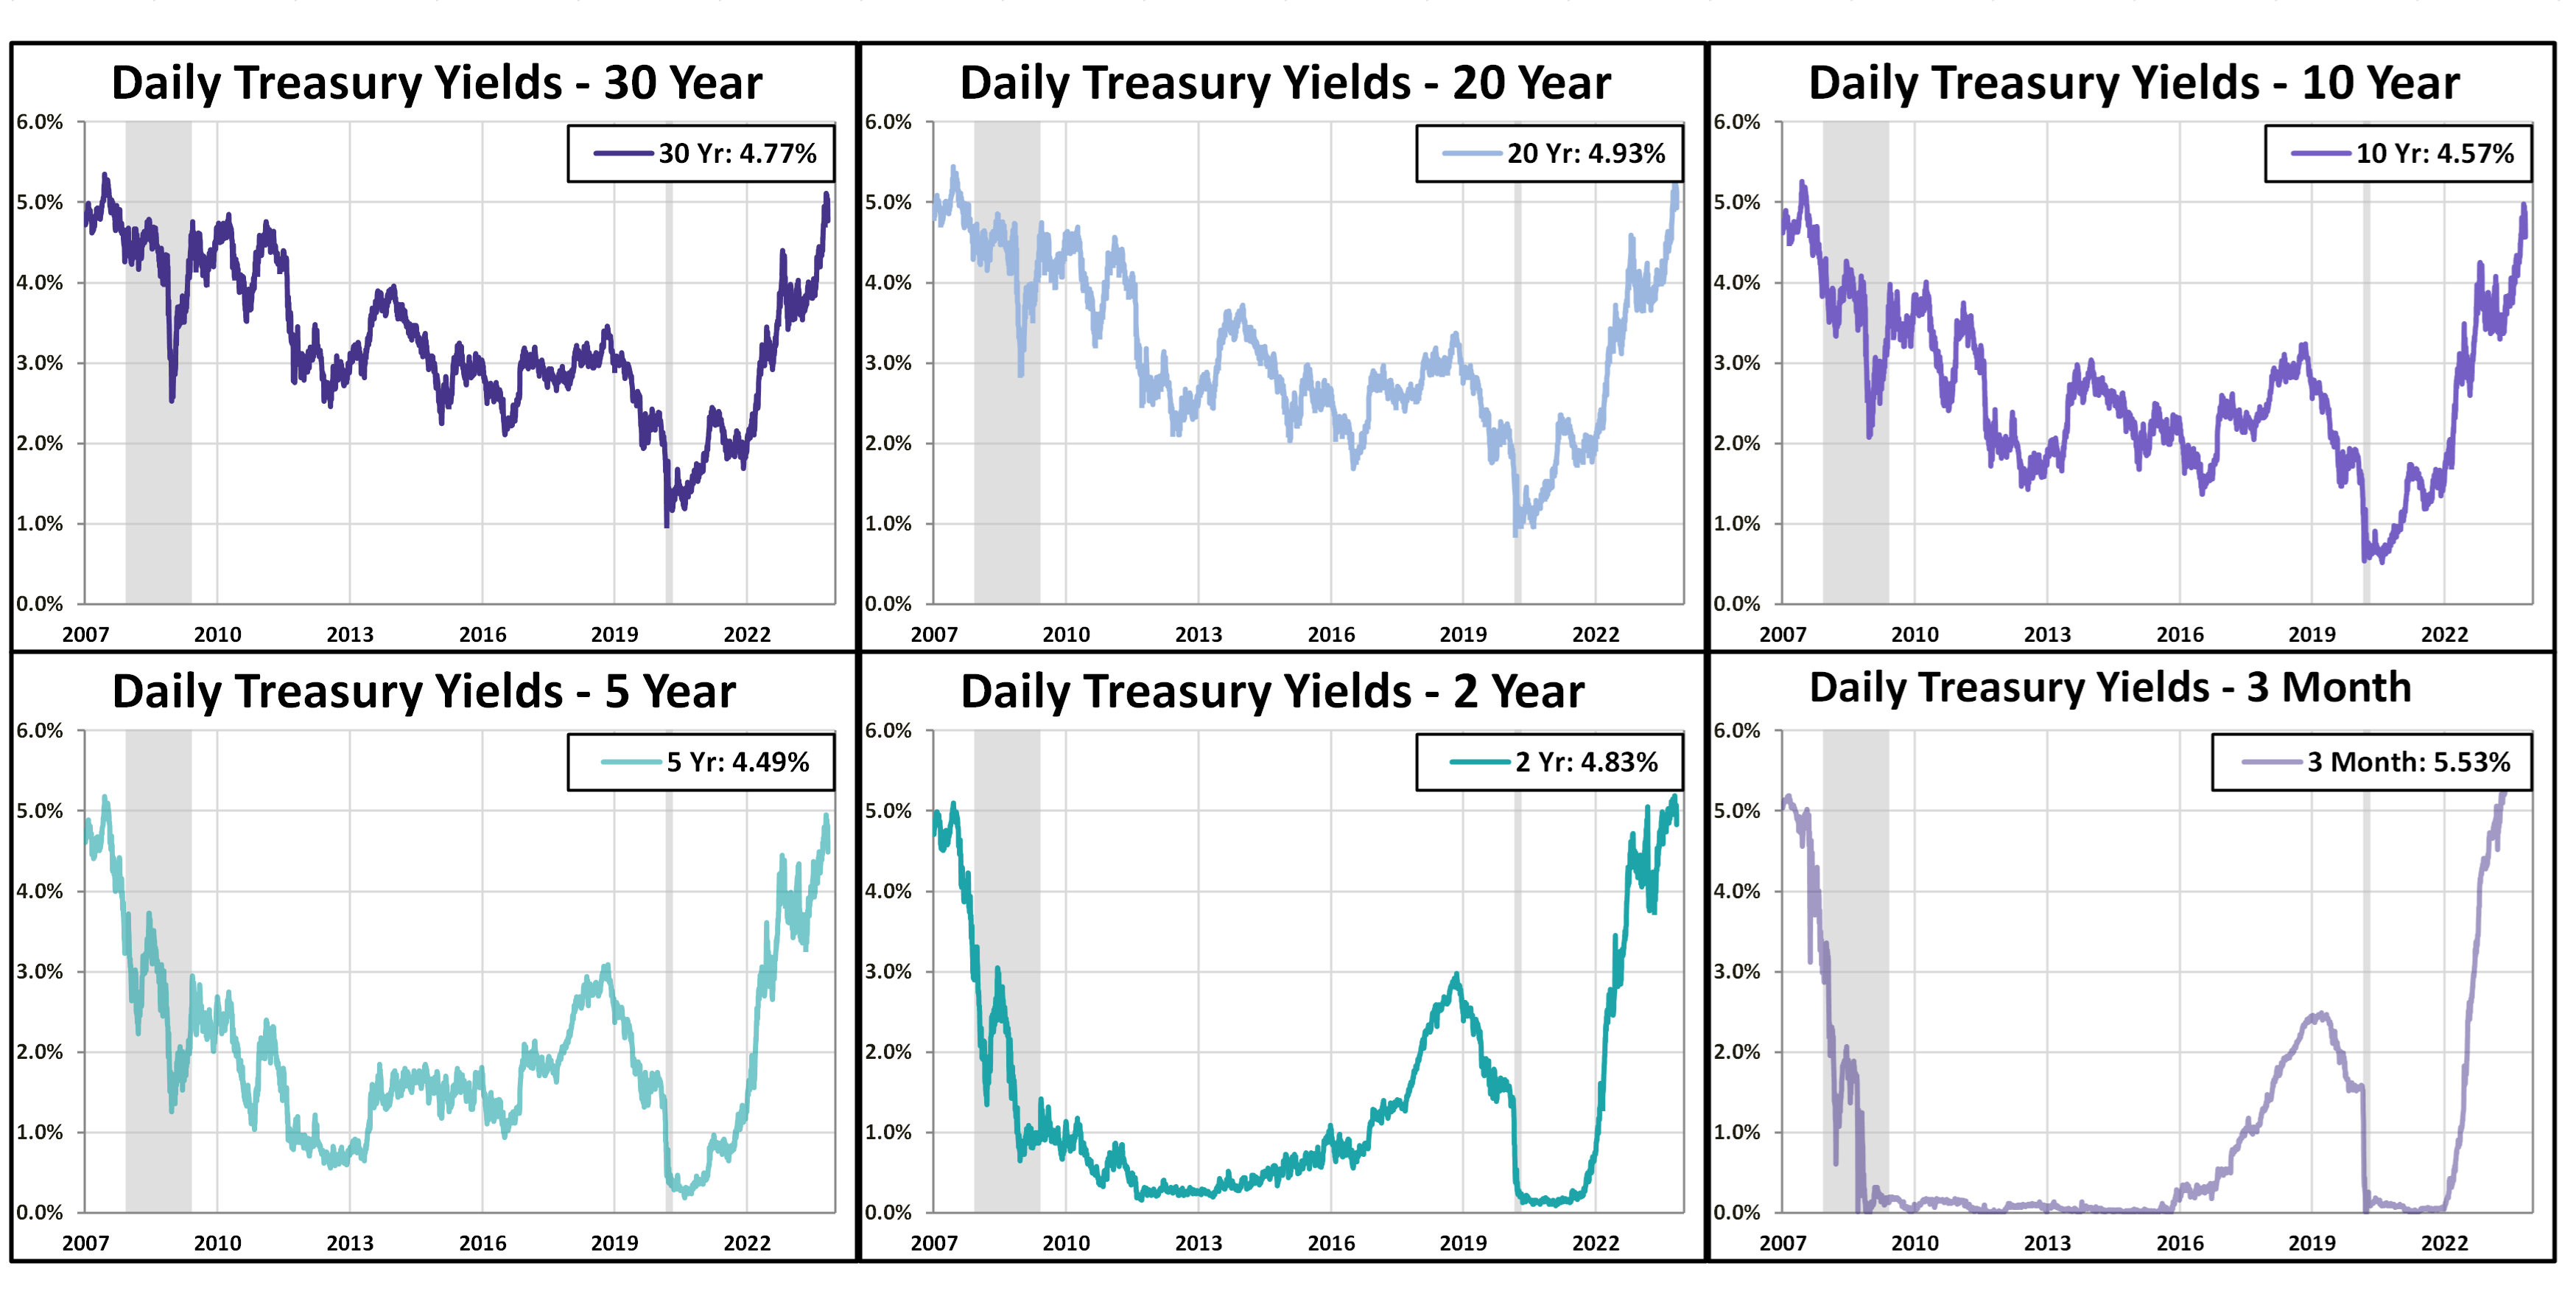
The charts below show the daily performance of several Treasury bonds since the prerecession days of equity market peaks in 2007.
The next chart is an overlay of all six charts above along with the Fed funds rate (FFR) since 2007.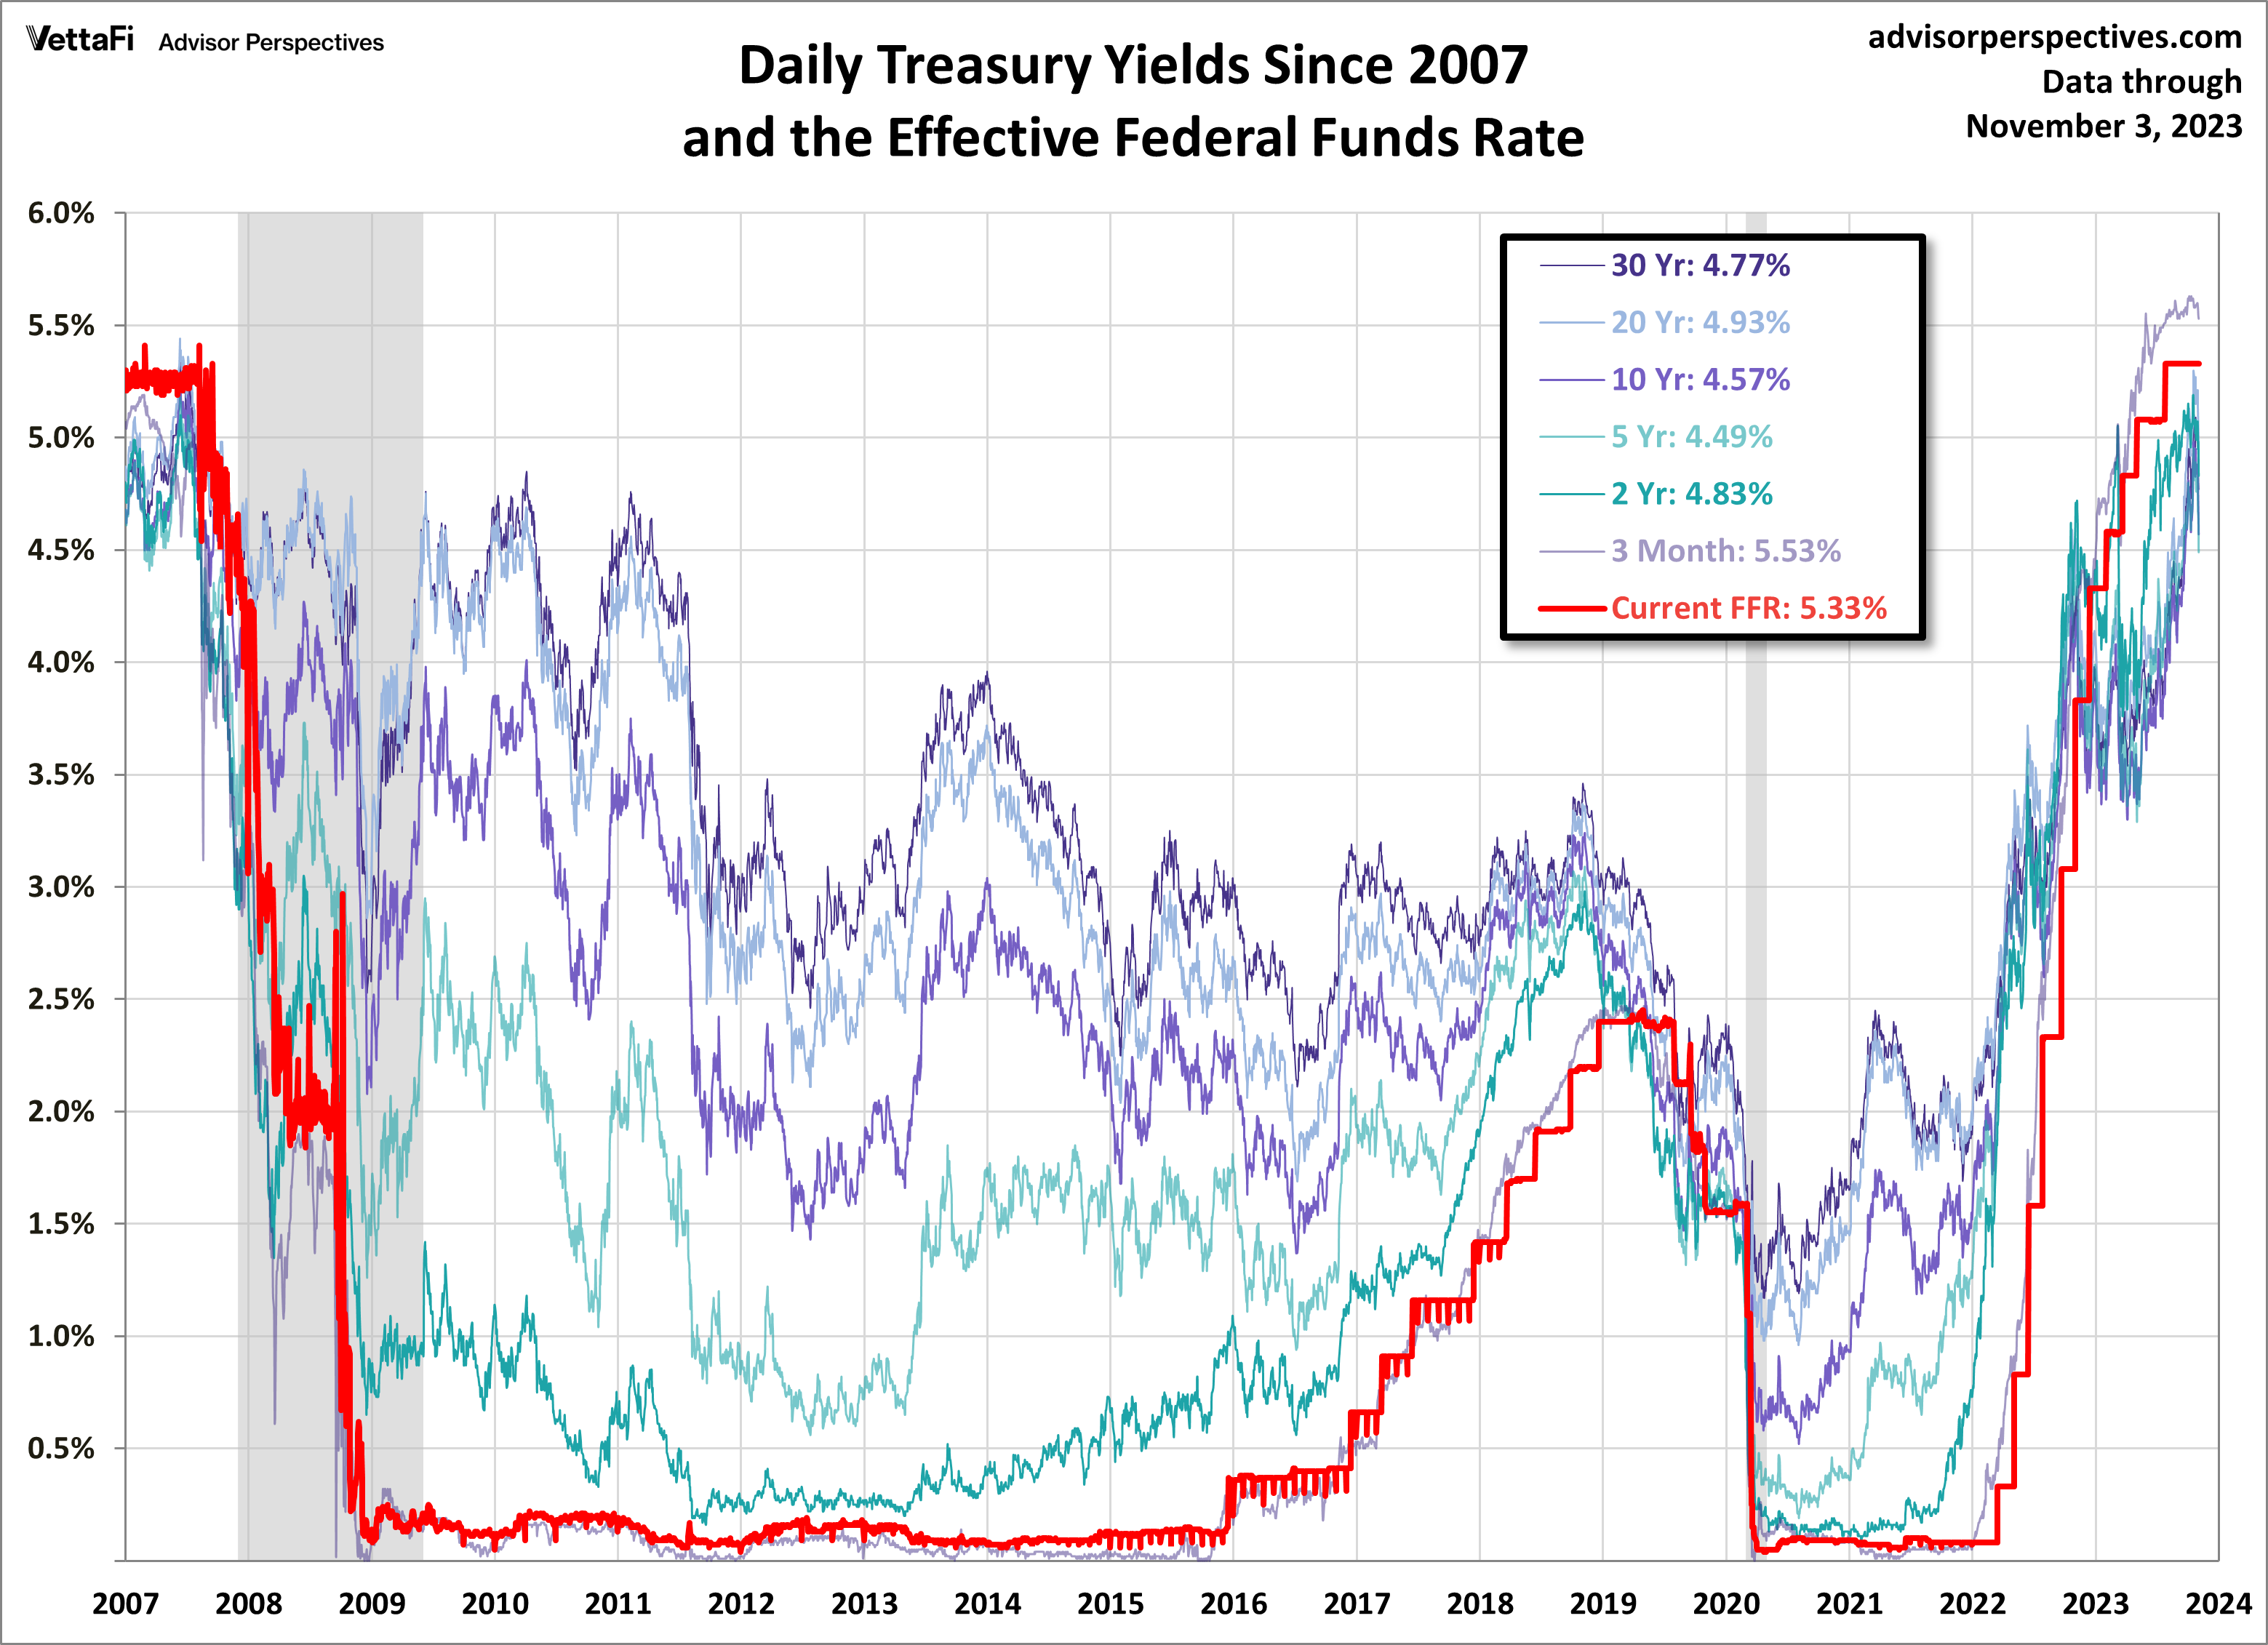
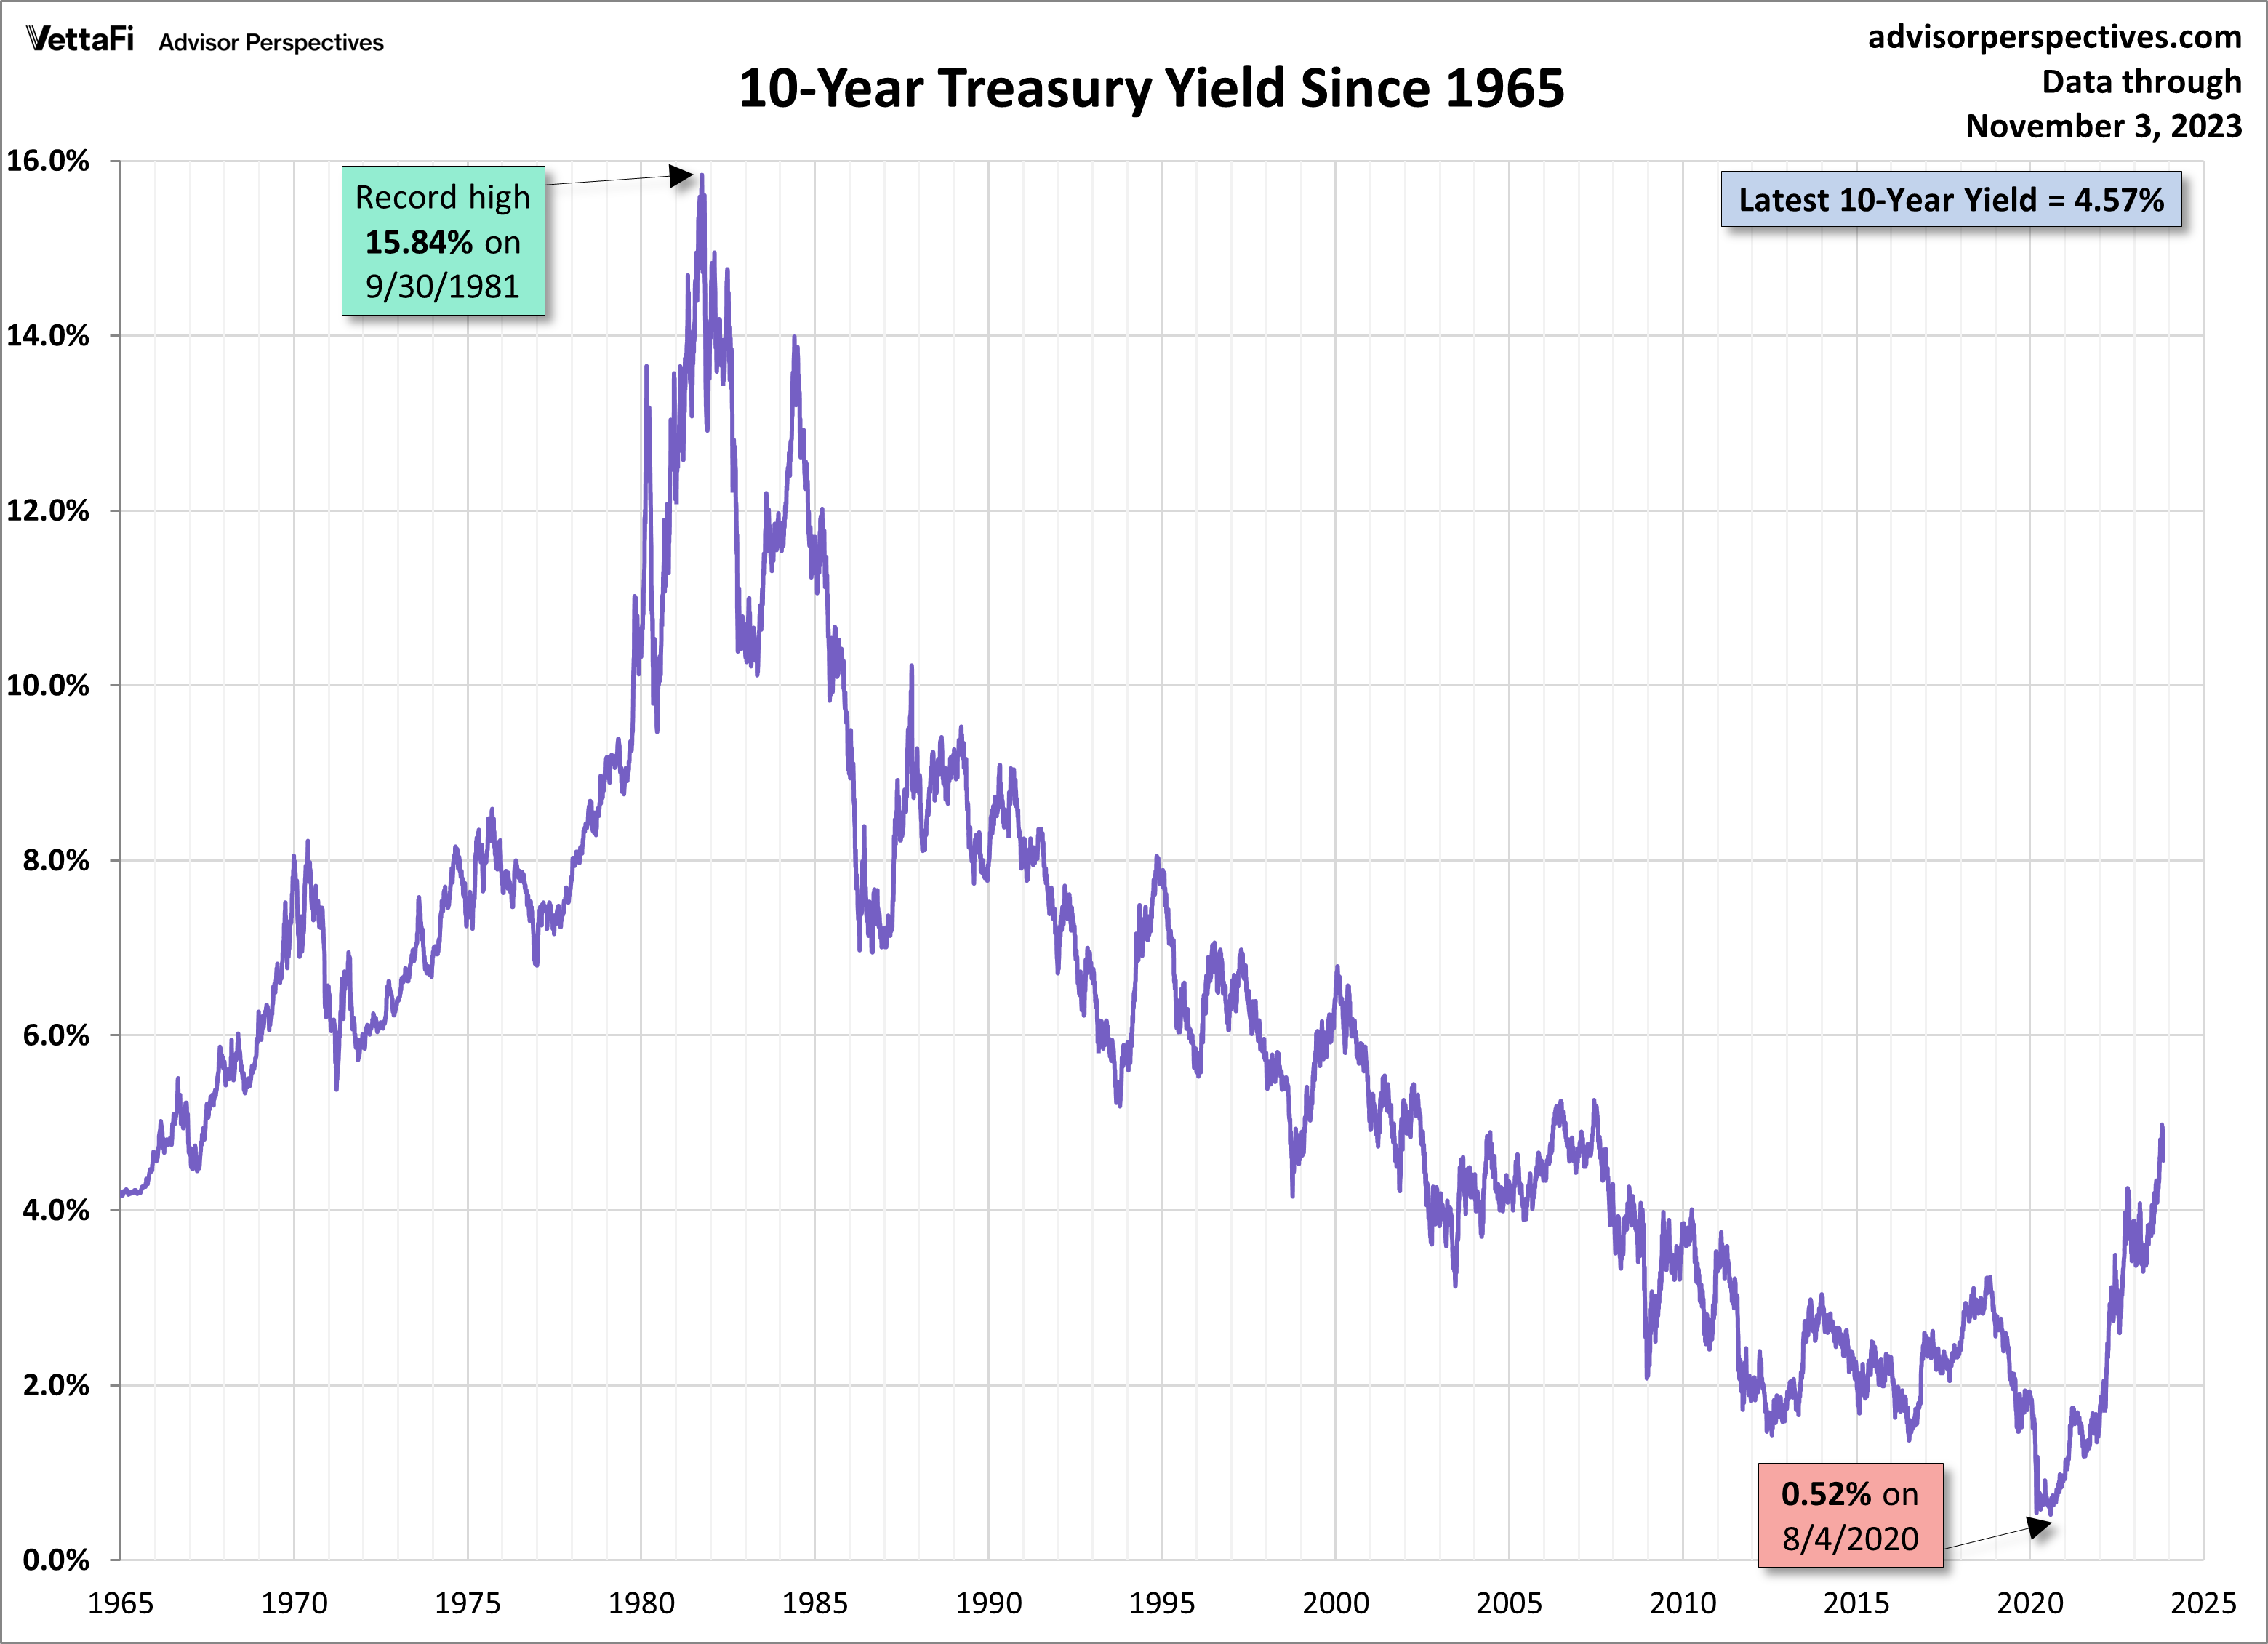
A Long-Term Look at the 10-Year Treasury Yield
Here is a long look of the 10-year yield with a start date of 1965, well before the 1973 oil embargo that triggered the era of “stagflation” (economic stagnation with inflation).
Yield Curve
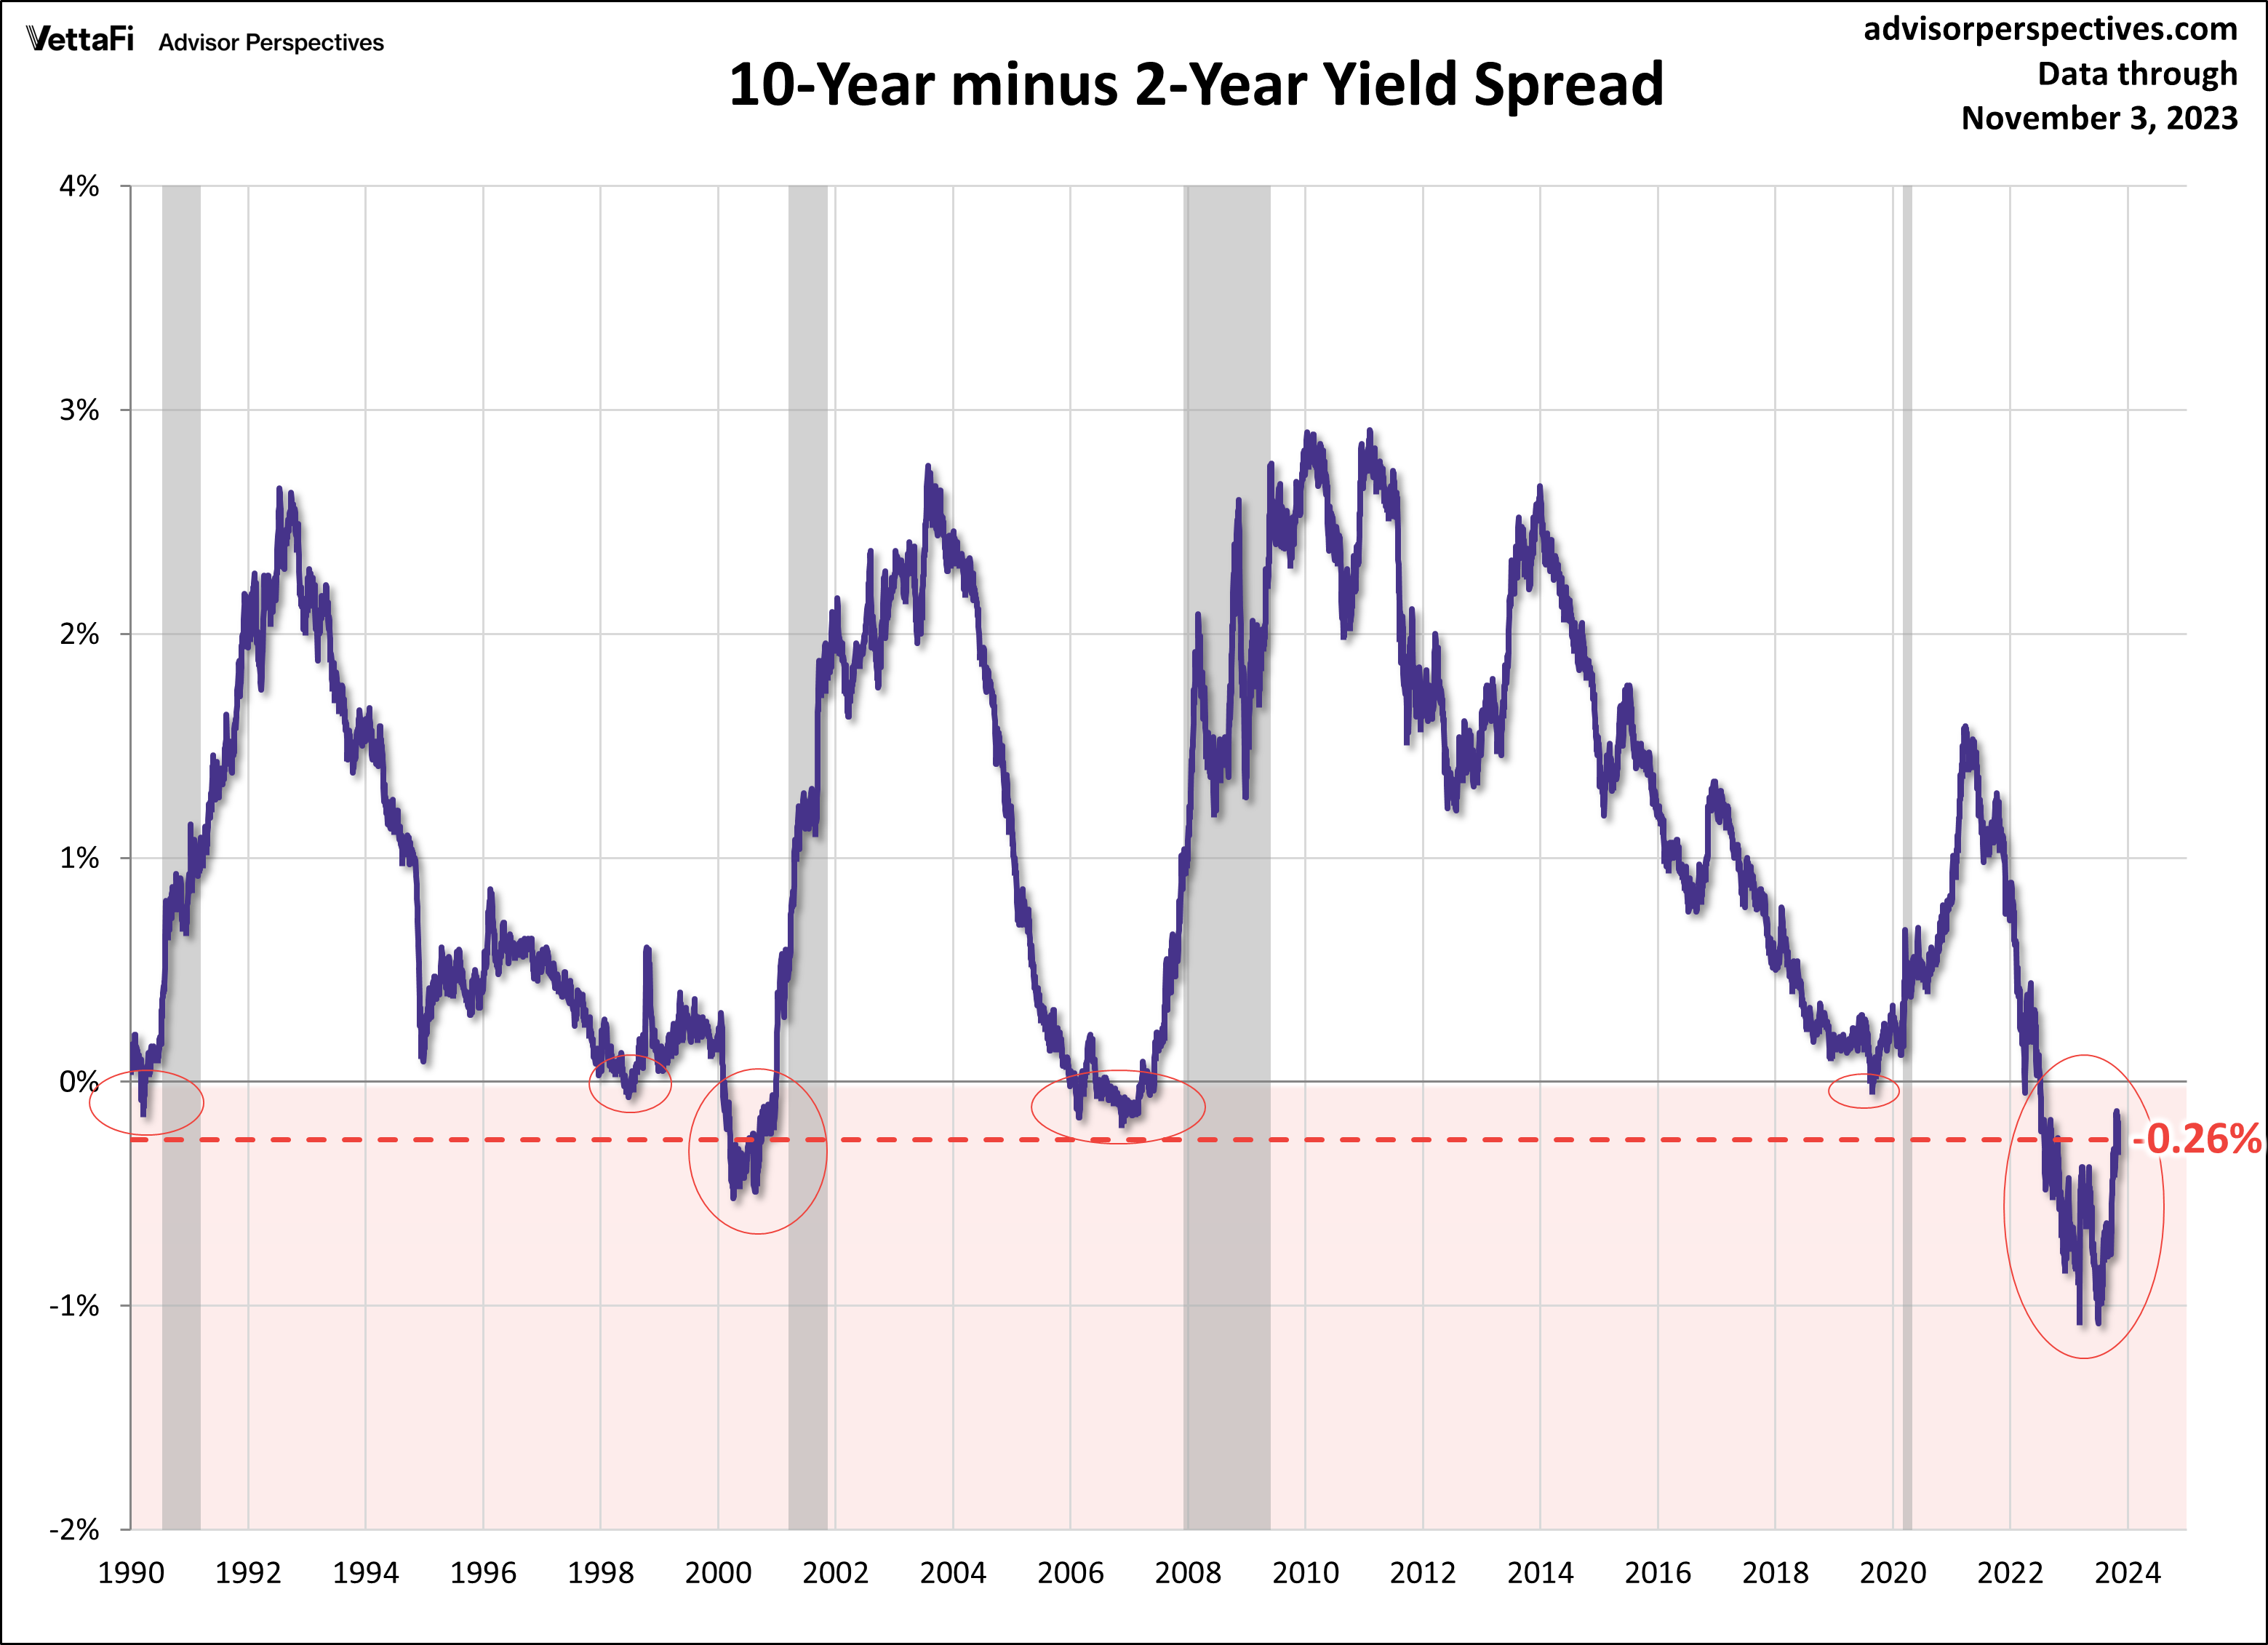
Here’s the latest 10-2 spread. Typically, the spread goes negative for a period and then out of the red prior to recessions, and is thus considered a reliable leading indicator for recessions. The lead time for recessions is quite a range. After going negative, recessions have begun anywhere from 16 to 62 weeks later. We also can see a false positive in 1998, where the spread went negative for a short period. For the 2009 recession, the spread went negative a few different times before rising.
If we use the first negative spread date as our starting point, the average number of weeks leading up to a recession is 37, or about nine months. If we use the last positive spread date after being negative before a recession, the average is 17 weeks, or 4.25 months, and the median is 14 weeks, or 3.5 months.
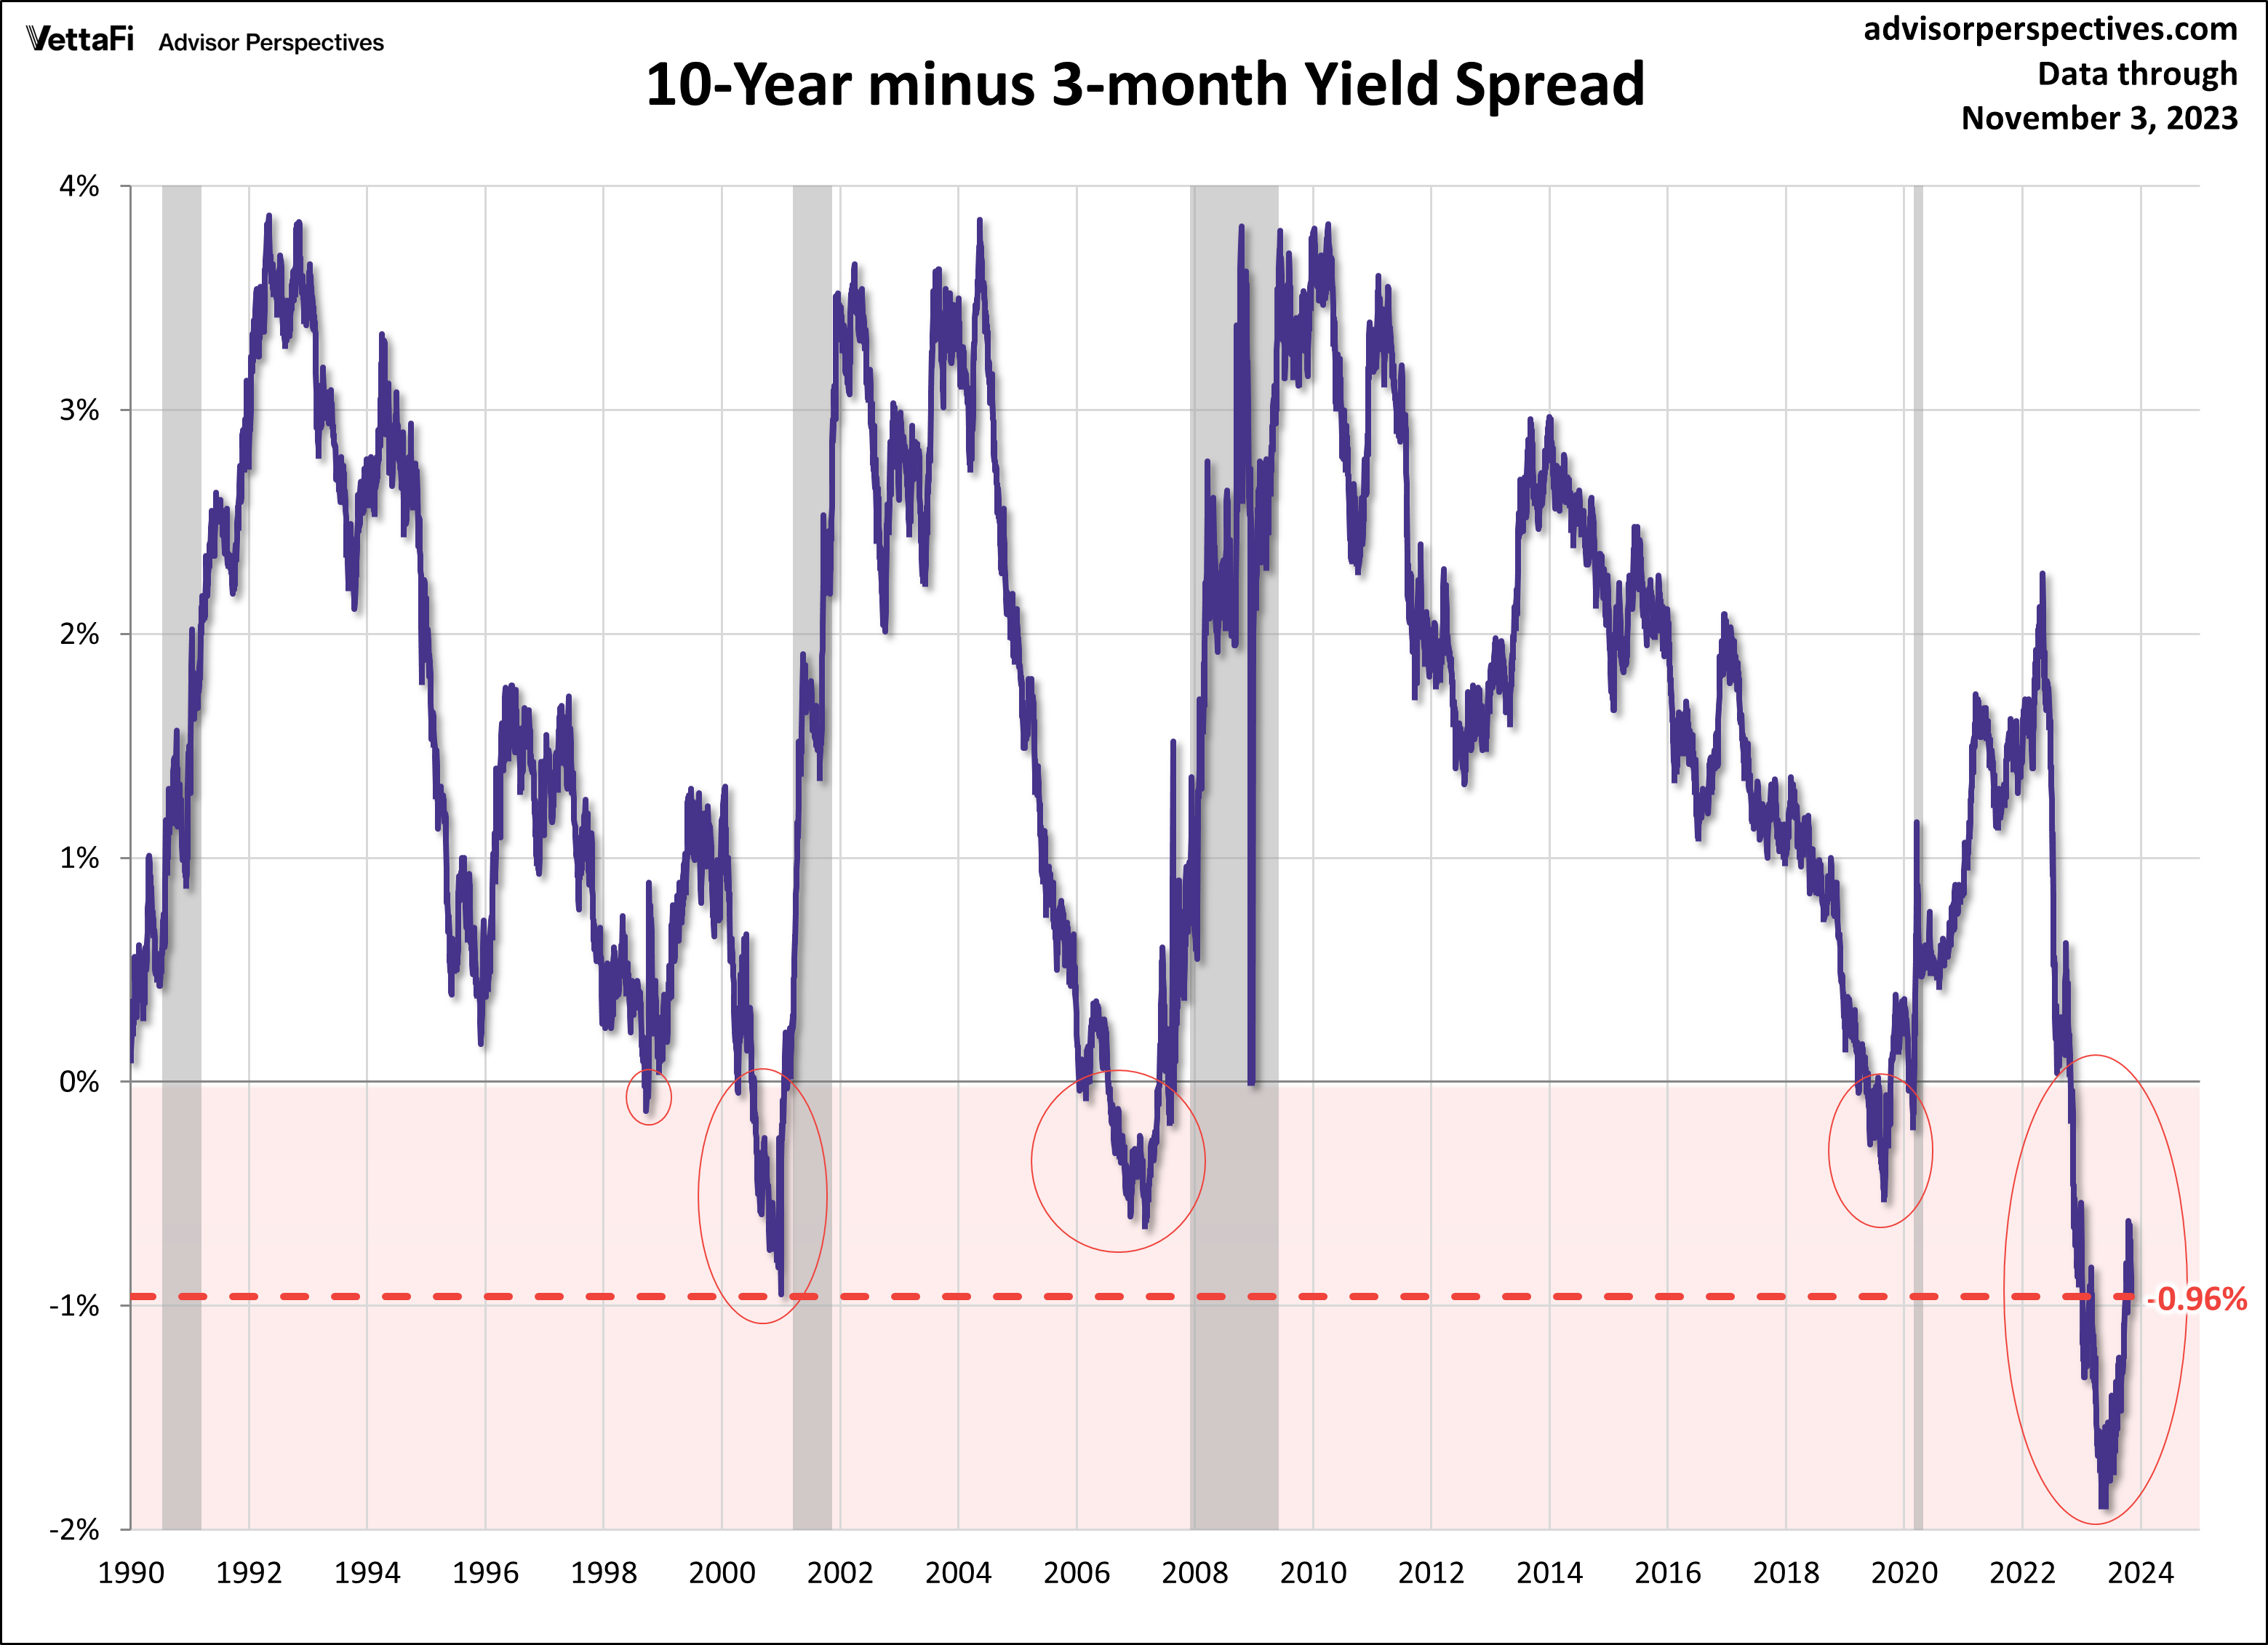
For another perspective on the yield curve, the 10- to 3-month spread below uses an even shorter-term maturity.
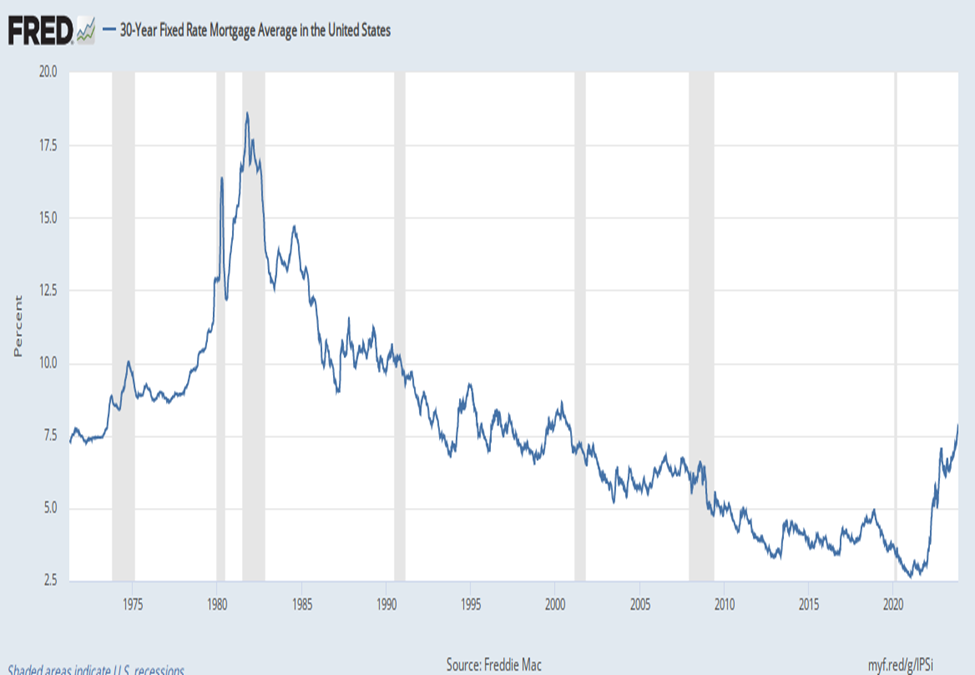
The 30-Year Fixed Rate Mortgage
The latest Freddie Mac Weekly Primary Mortgage Market Survey put the 30-year fixed rate at 7.76%. Here is a long look back, courtesy of a FRED graph, of the 30-year fixed-rate mortgage average, which began in April 1971.
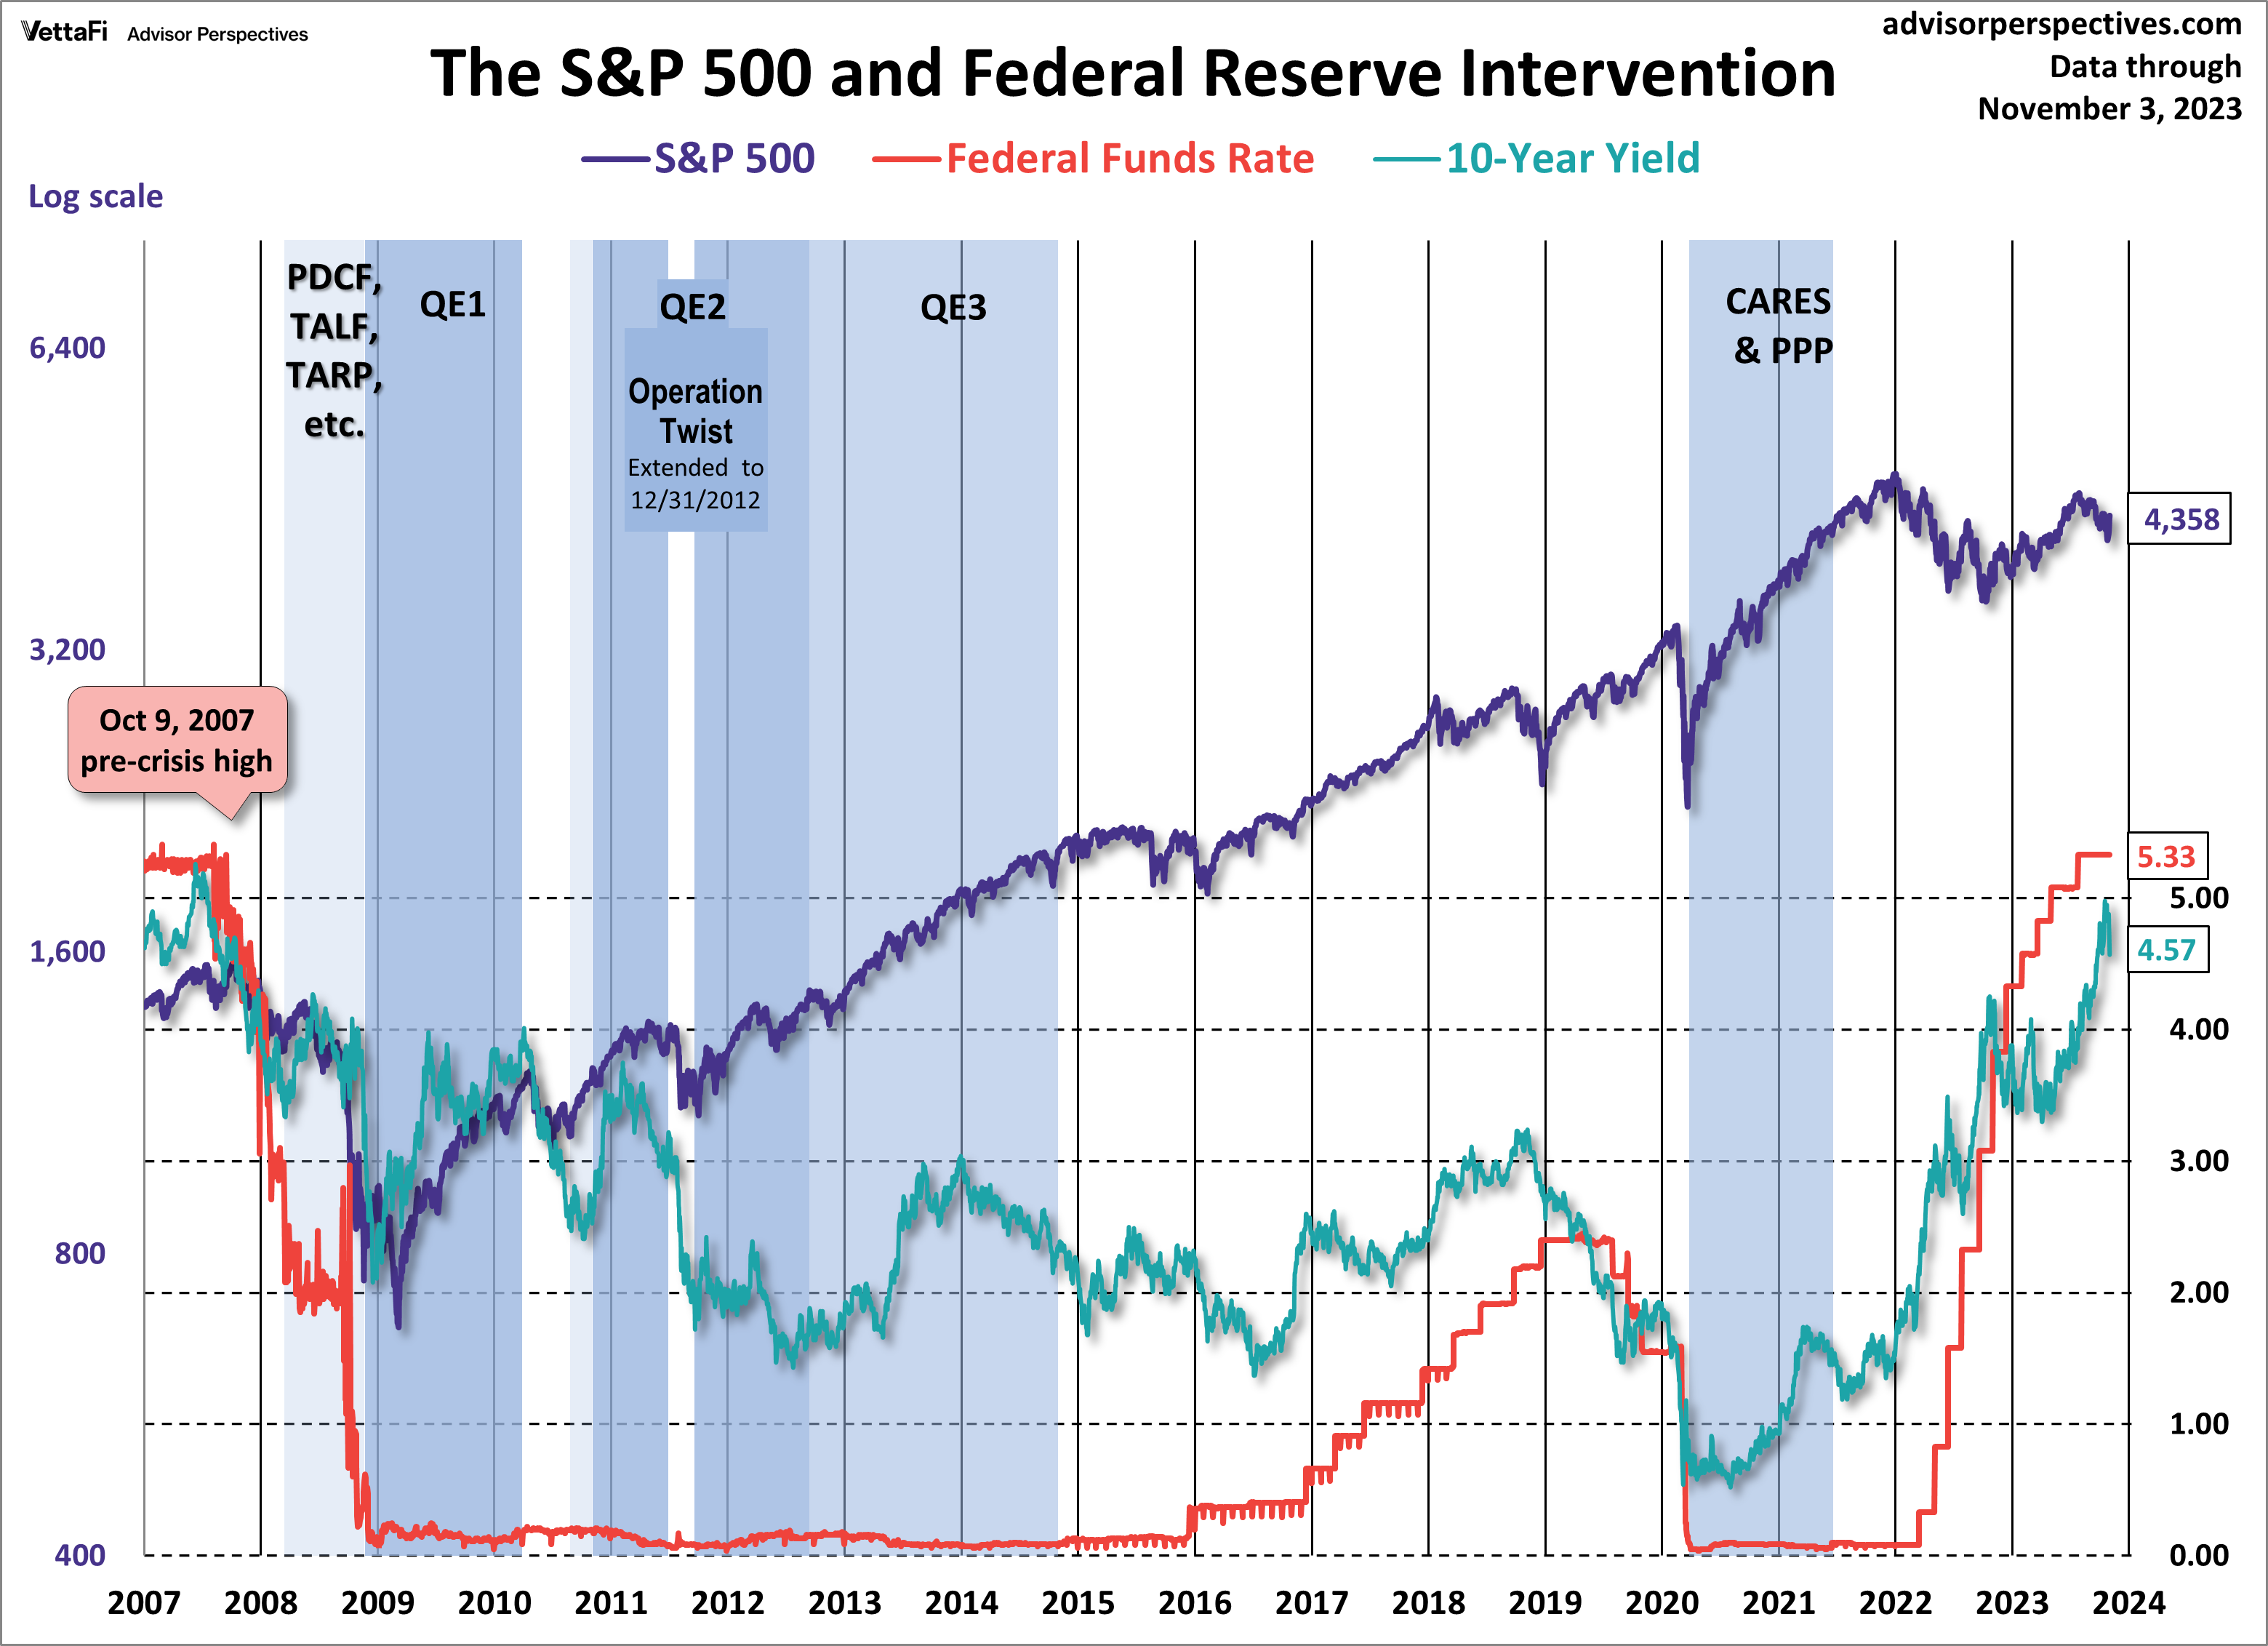
Now let’s see the 10-year against the S&P 500 with some notes on Federal Reserve intervention. Fed policy has been a major influence on market behavior.
For a long-term view of weekly Treasury yields, also focusing on the 10-year, see our latest Treasury Yields in Perspective update.
ETFs associated with Treasuries include: iShares 1-3 Year Treasury Bond ETF (SHY), iShares 7-10 Year Treasury Bond ETF (IEF), and iShares 20+ Year Treasury Bond ETF (TLT).
For more news, information, and analysis, visit the Fixed Income Channel.
