
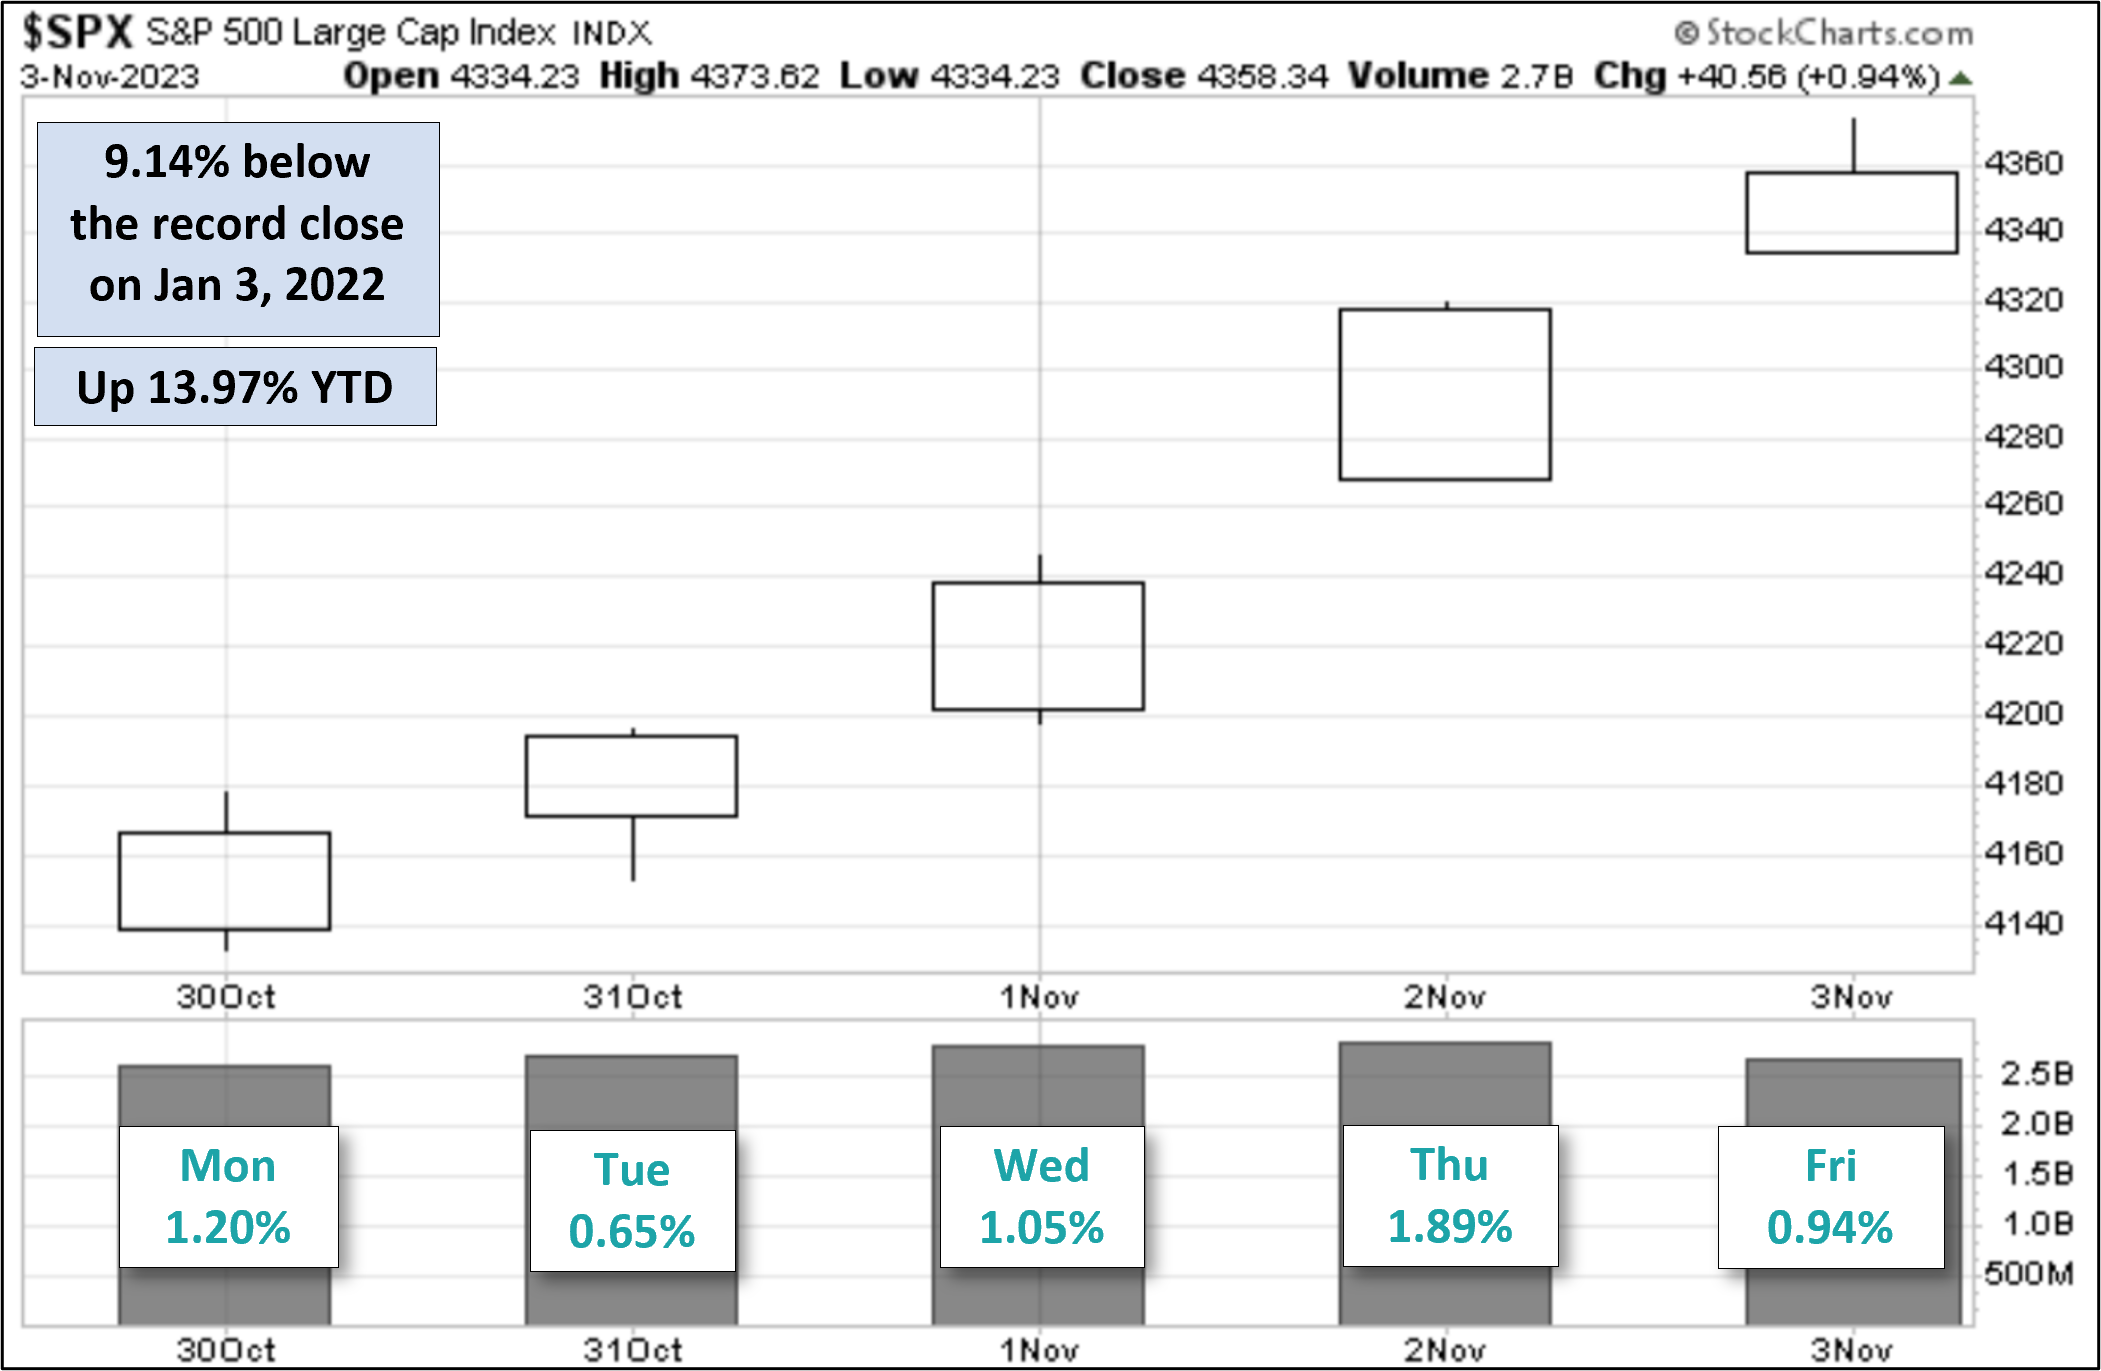
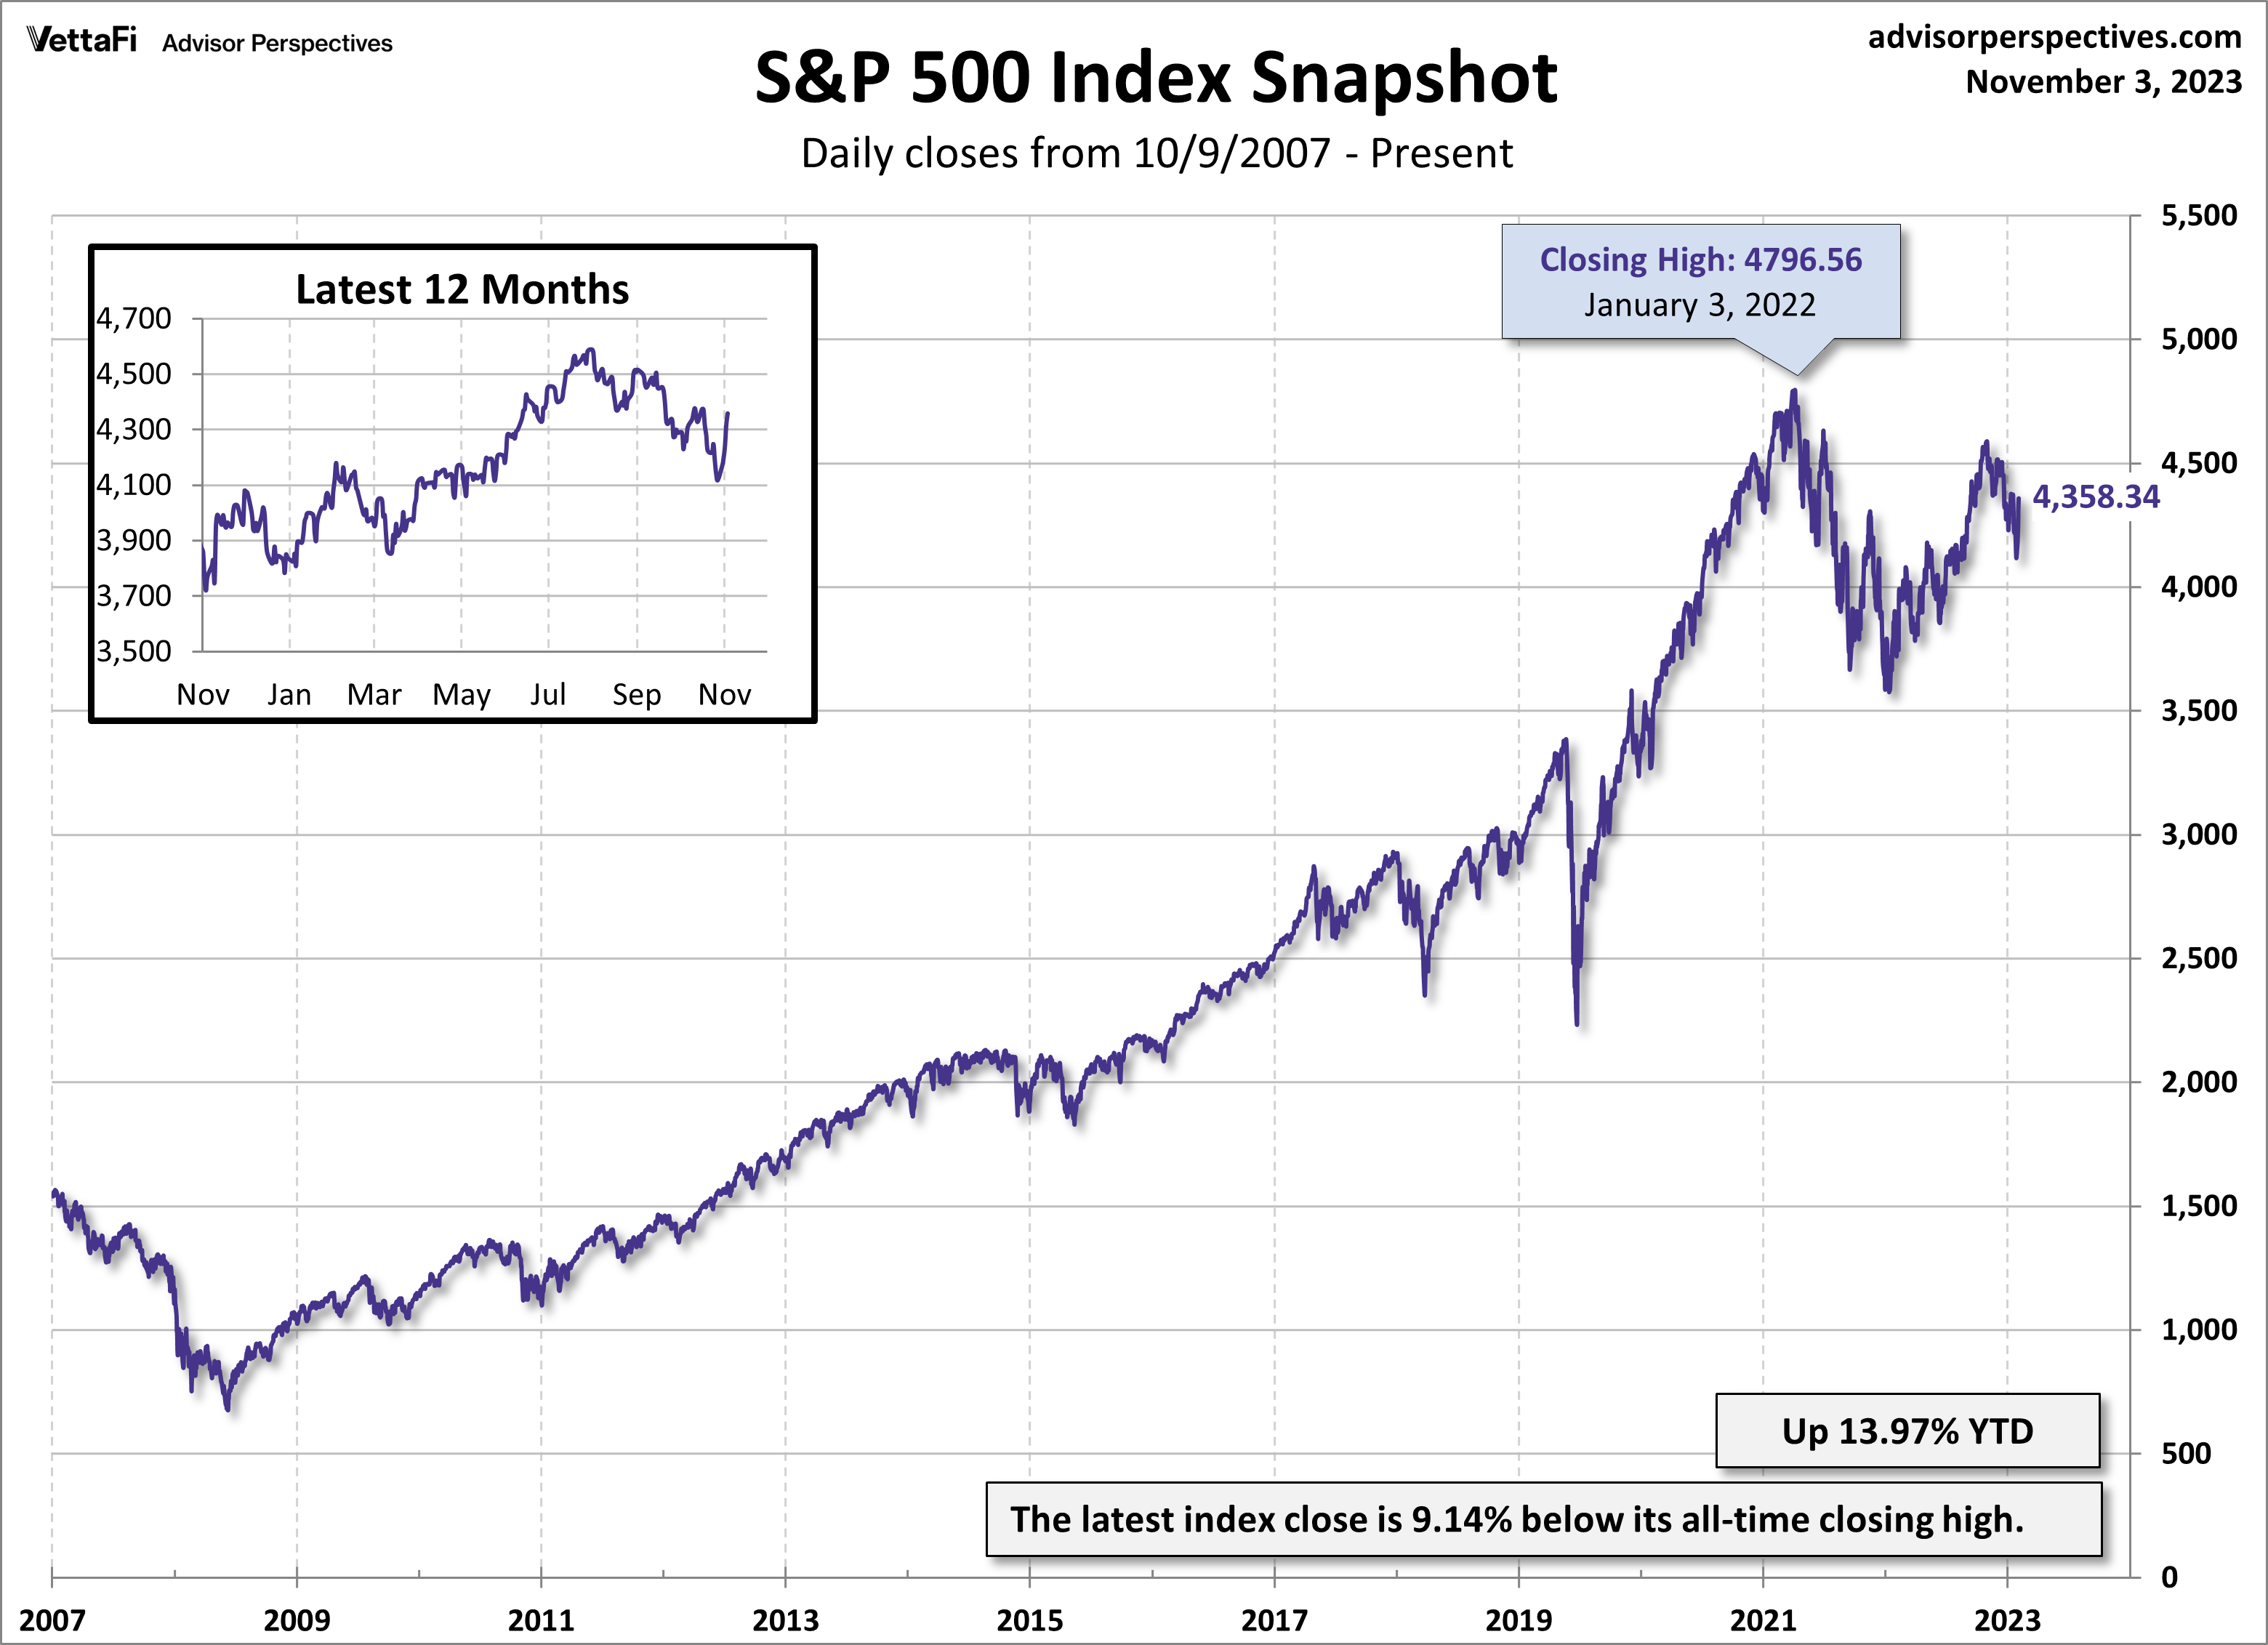
The S&P 500 posted its biggest weekly gain of the year, finishing Friday up 5.85% from the previous week. The index is currently up 13.97% year to date and is 9.14% below its record close from January 3, 2022.
Here is a snapshot of the index over the past five days:
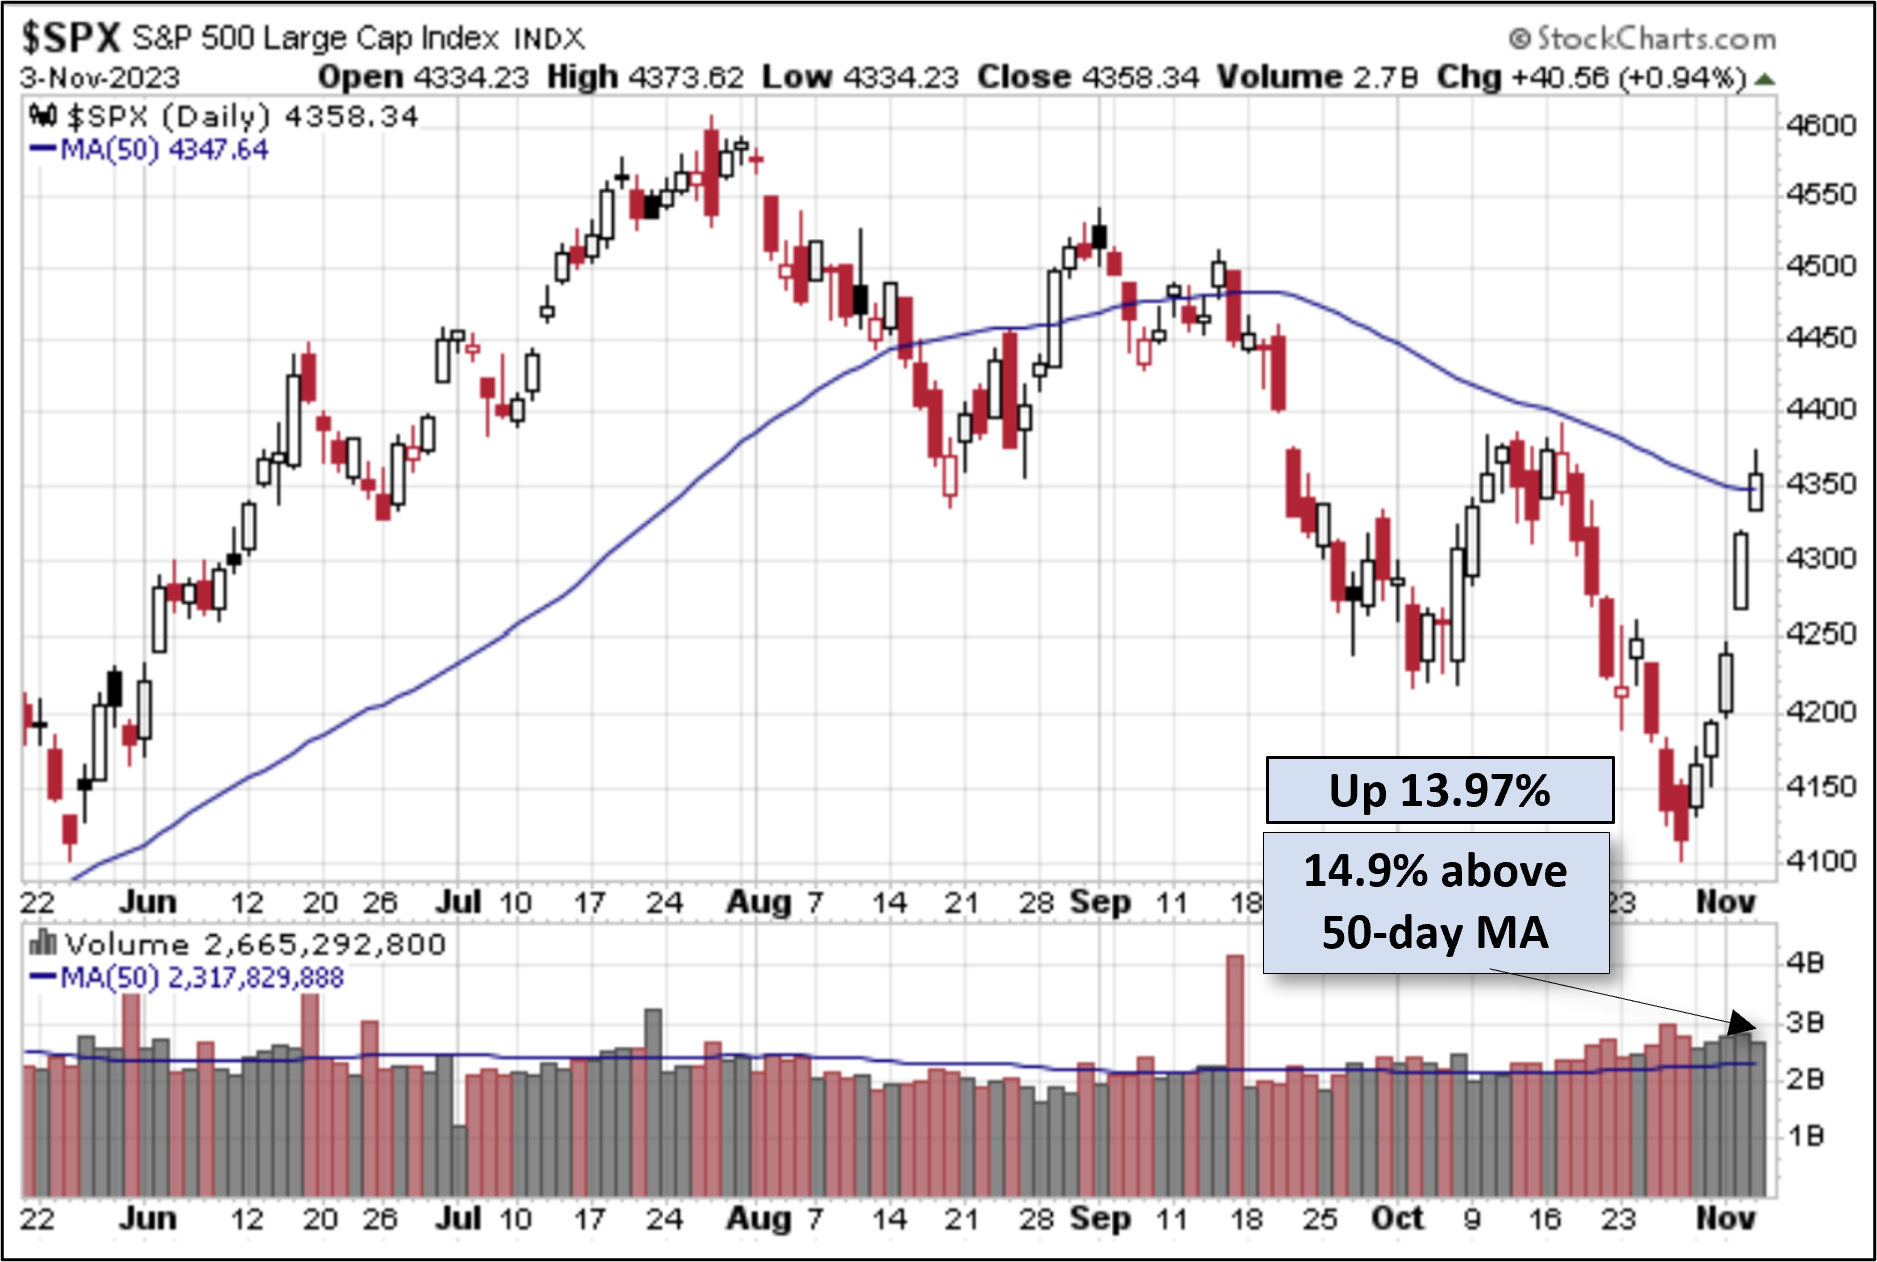
Here is a snapshot of the index from the past six months:
The U.S. Treasury put the closing yield on the 10-year note, as of November 3, at 4.57%, which is above its record low (0.52% on 8/4/2020). The two-year note is at 4.83%. ETFs associated with Treasuries include: iShares 1-3 Year Treasury Bond ETF (SHY), iShares 7-10 Year Treasury Bond ETF (IEF), and iShares 20+ Year Treasury Bond ETF (TLT). See our latest Treasury Snapshot here.
S&P 500: A Perspective on Drawdowns
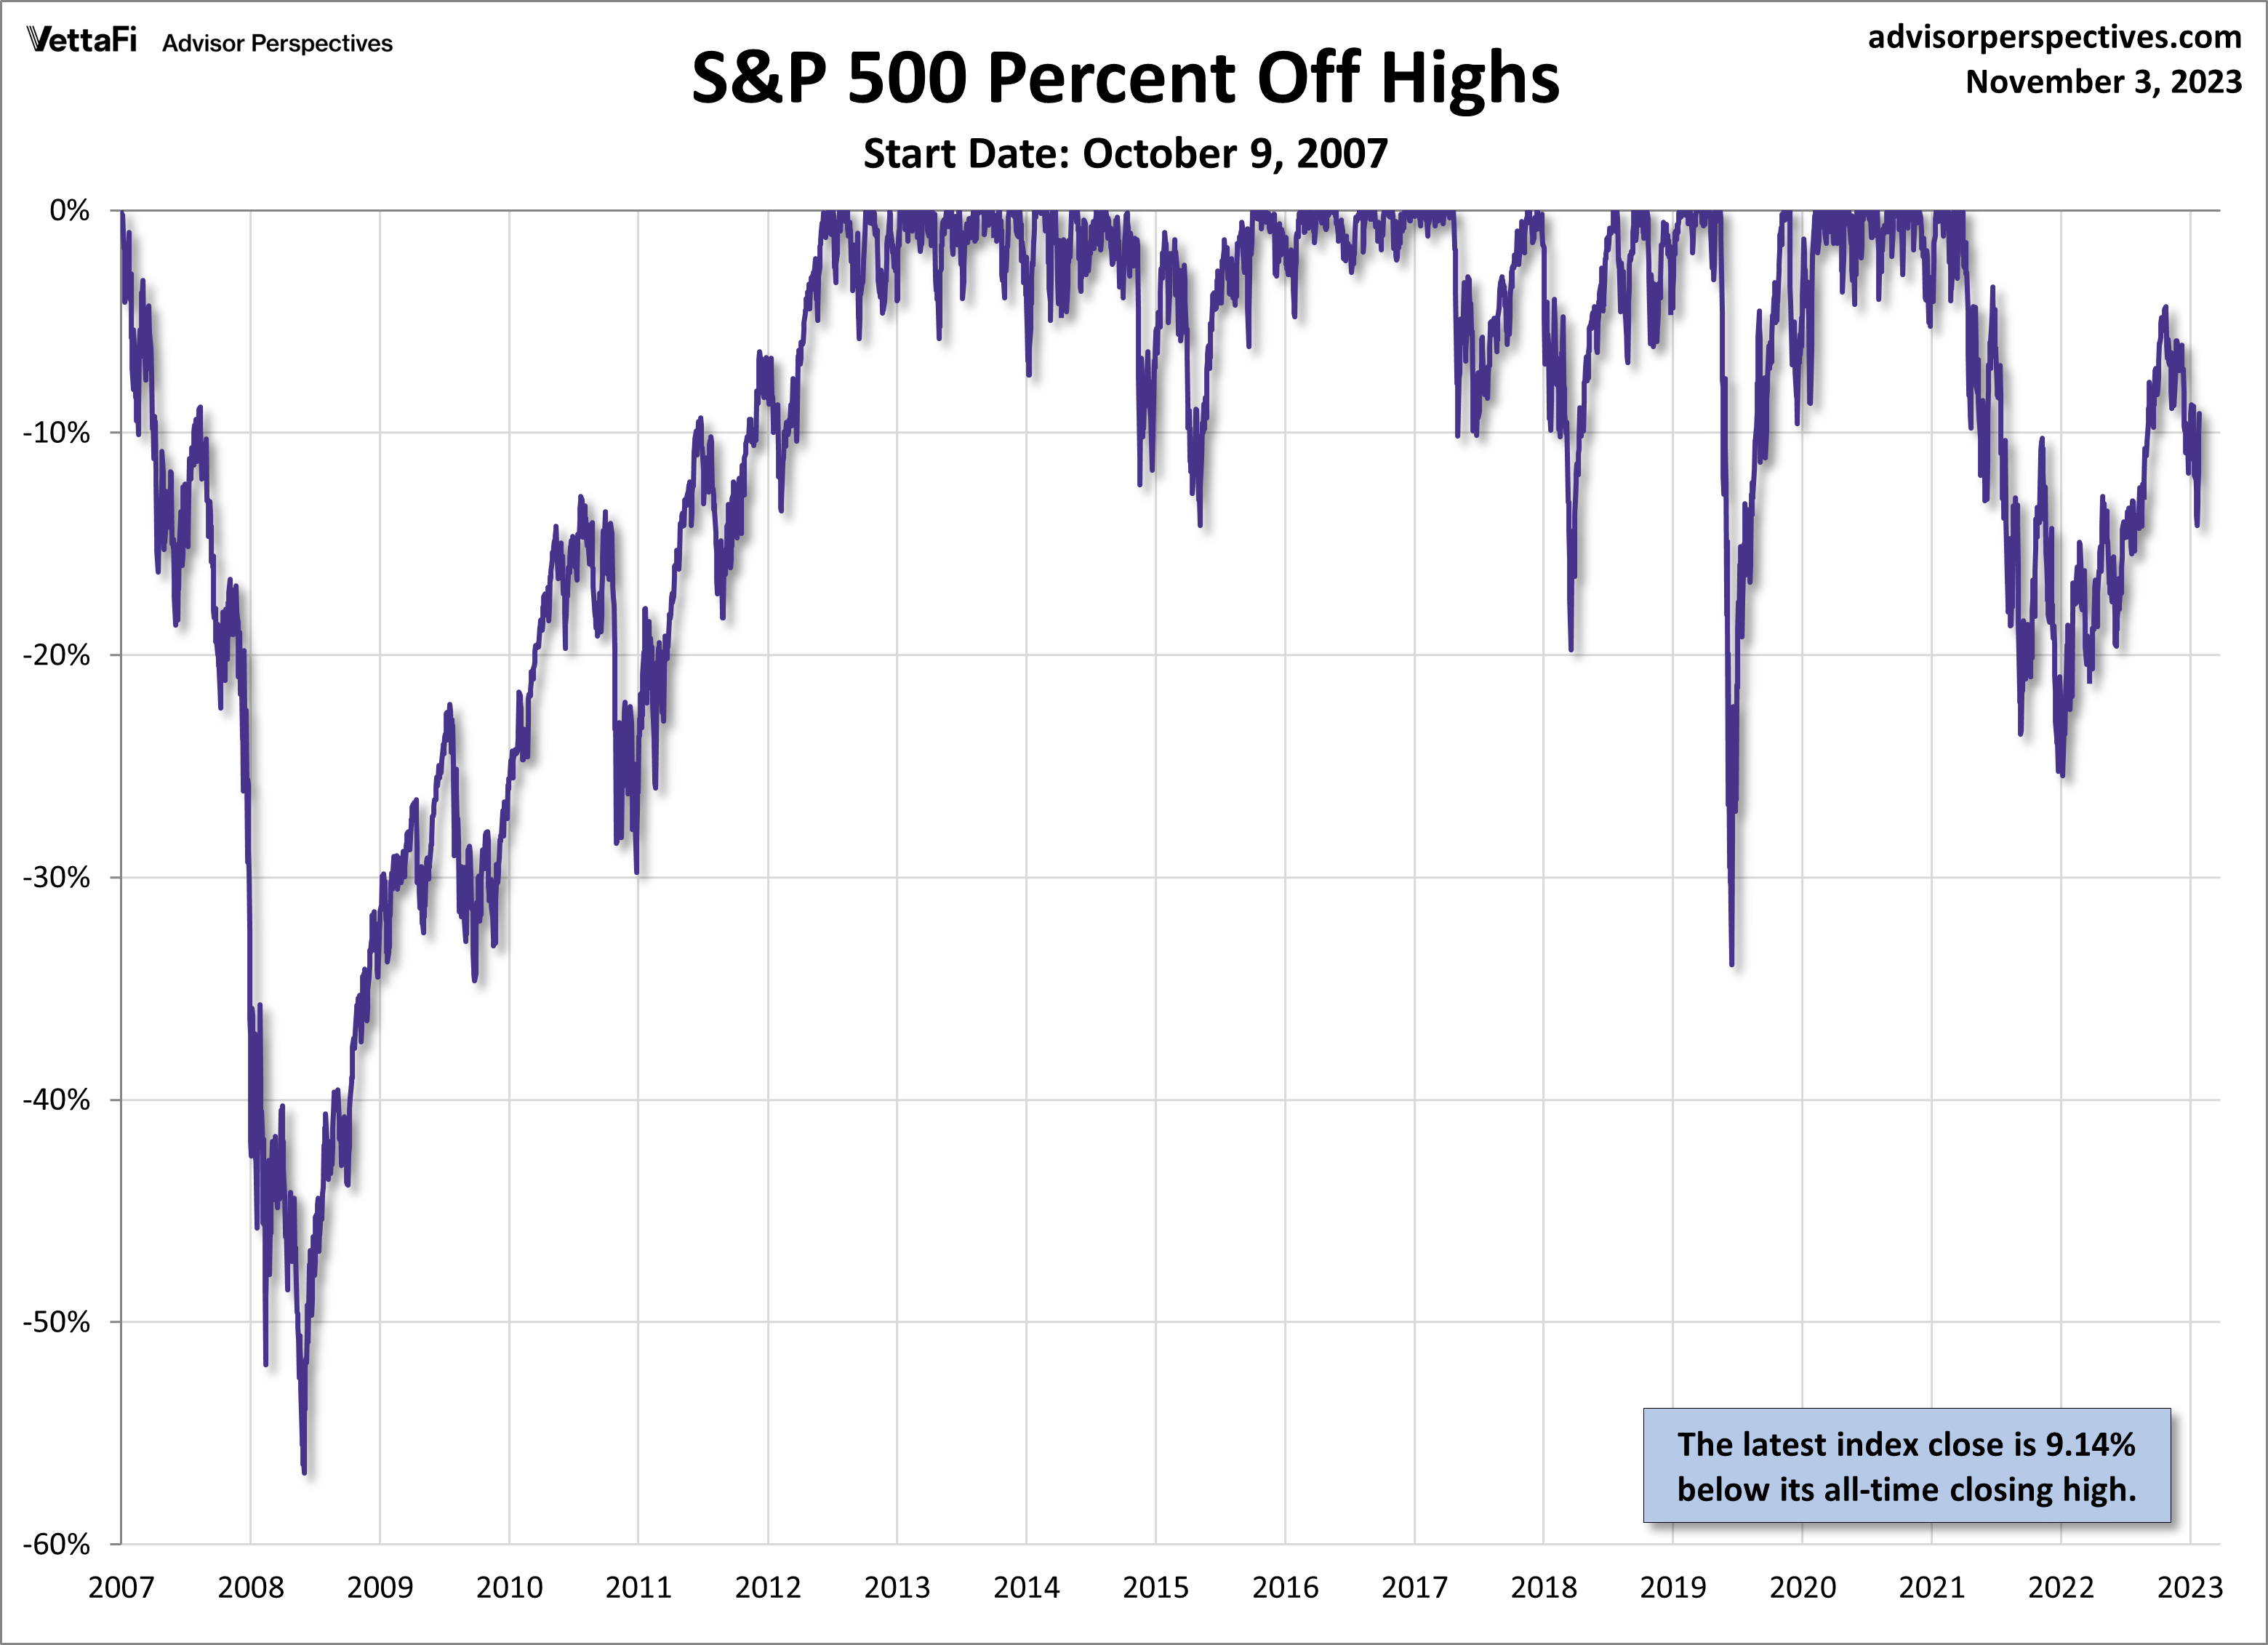
On October 9, 2007 the S&P 500 reached a then-all-time high, closing the day at 1565.15. Then on March 9, 2009, the index dropped ~57% off of its high from exactly 17 months before, closing the day at 676.53. This time period became known as the global financial crisis. It took over five years before the index reached a new then-all-time high on March 28, 2013, where it closed out at 1569.19. The chart below is a snapshot of record highs and sell-offs since the 2007 peak reached on October 9, 2007.
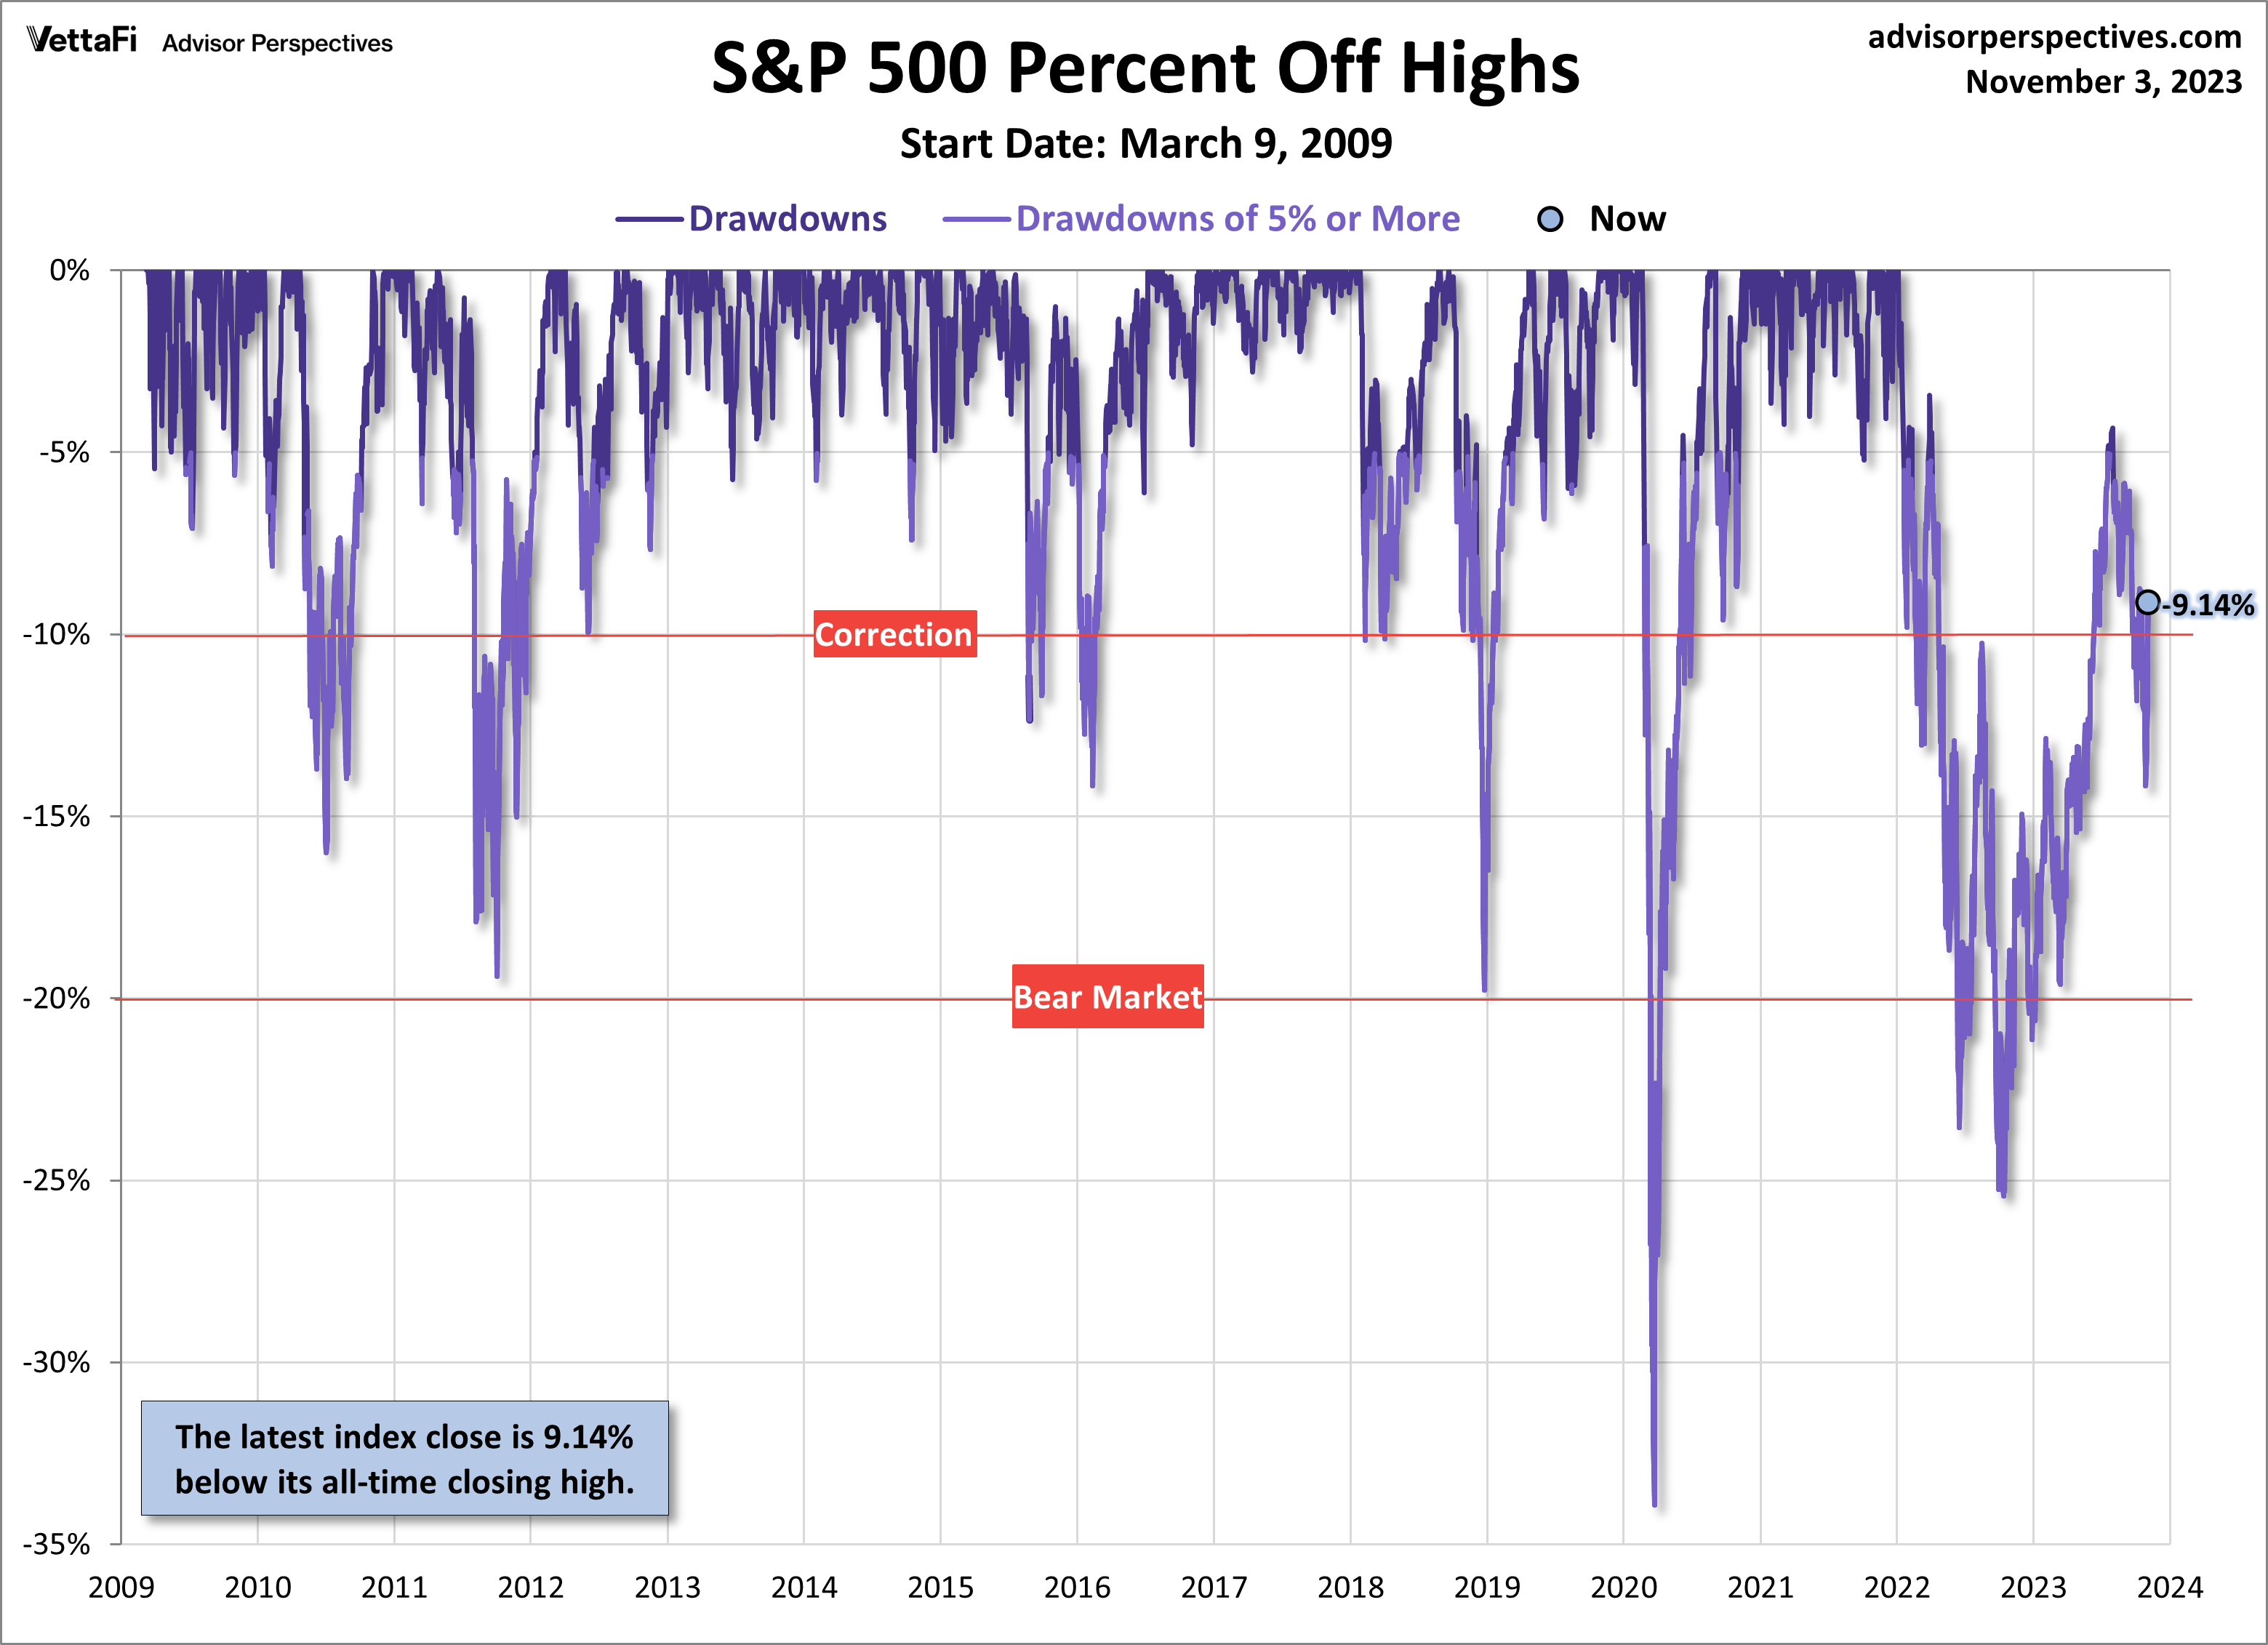
What happens if we take out the global financial crisis? Here’s a snapshot the same chart above where the start date has been changed to the trough reached on March 9, 2009. Note the recent sell-offs in 2022.
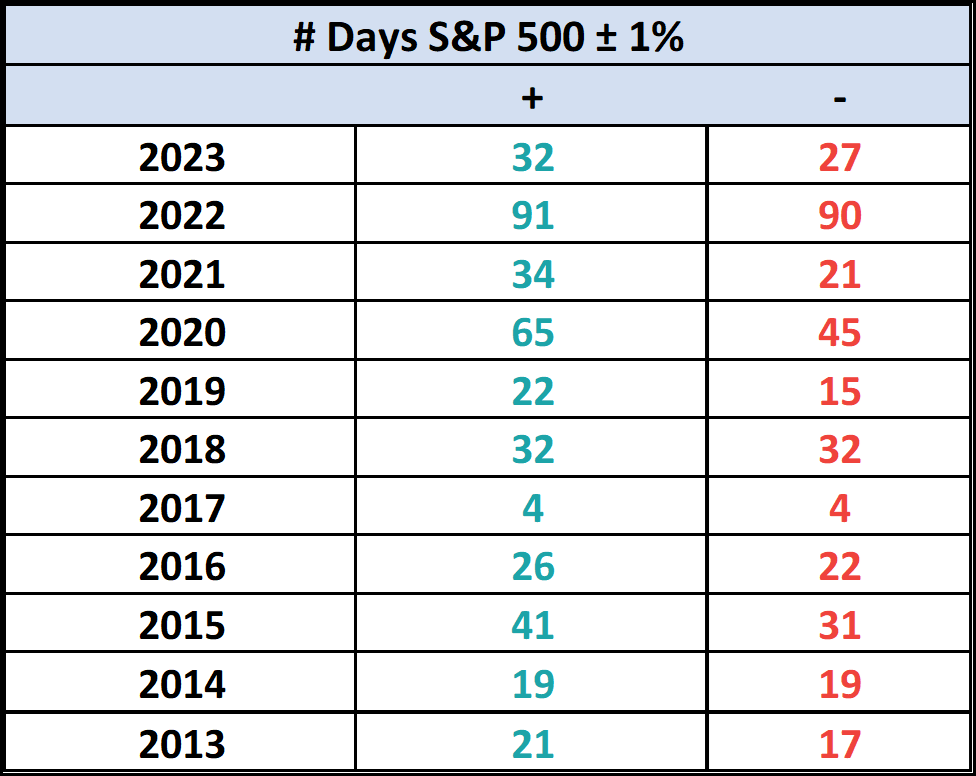
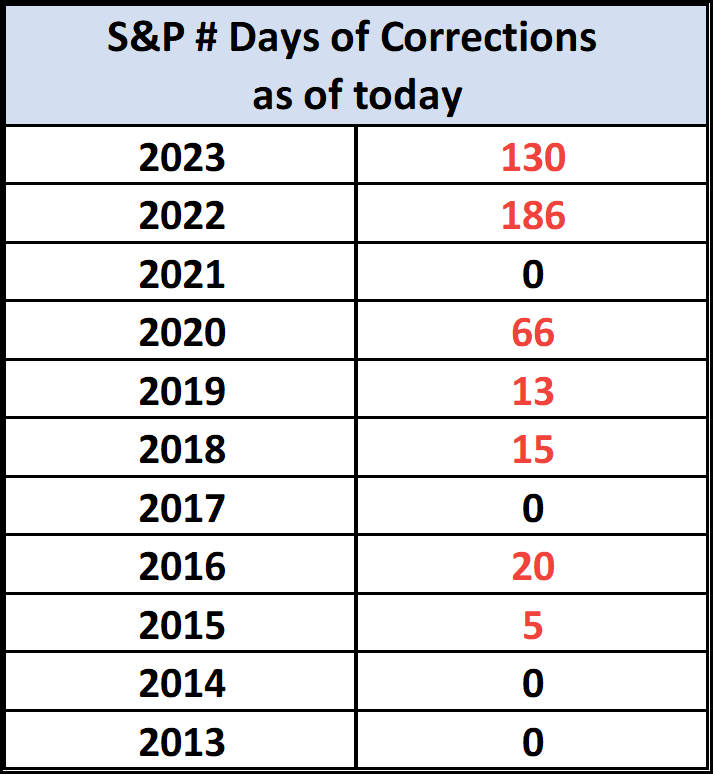
Here’s a table with the number of days of a 1% or greater change in either direction and the number of days of corrections (down 10% or more from the record high) going back to 2013.
Here is a linear chart of the index since October 9, 2007:
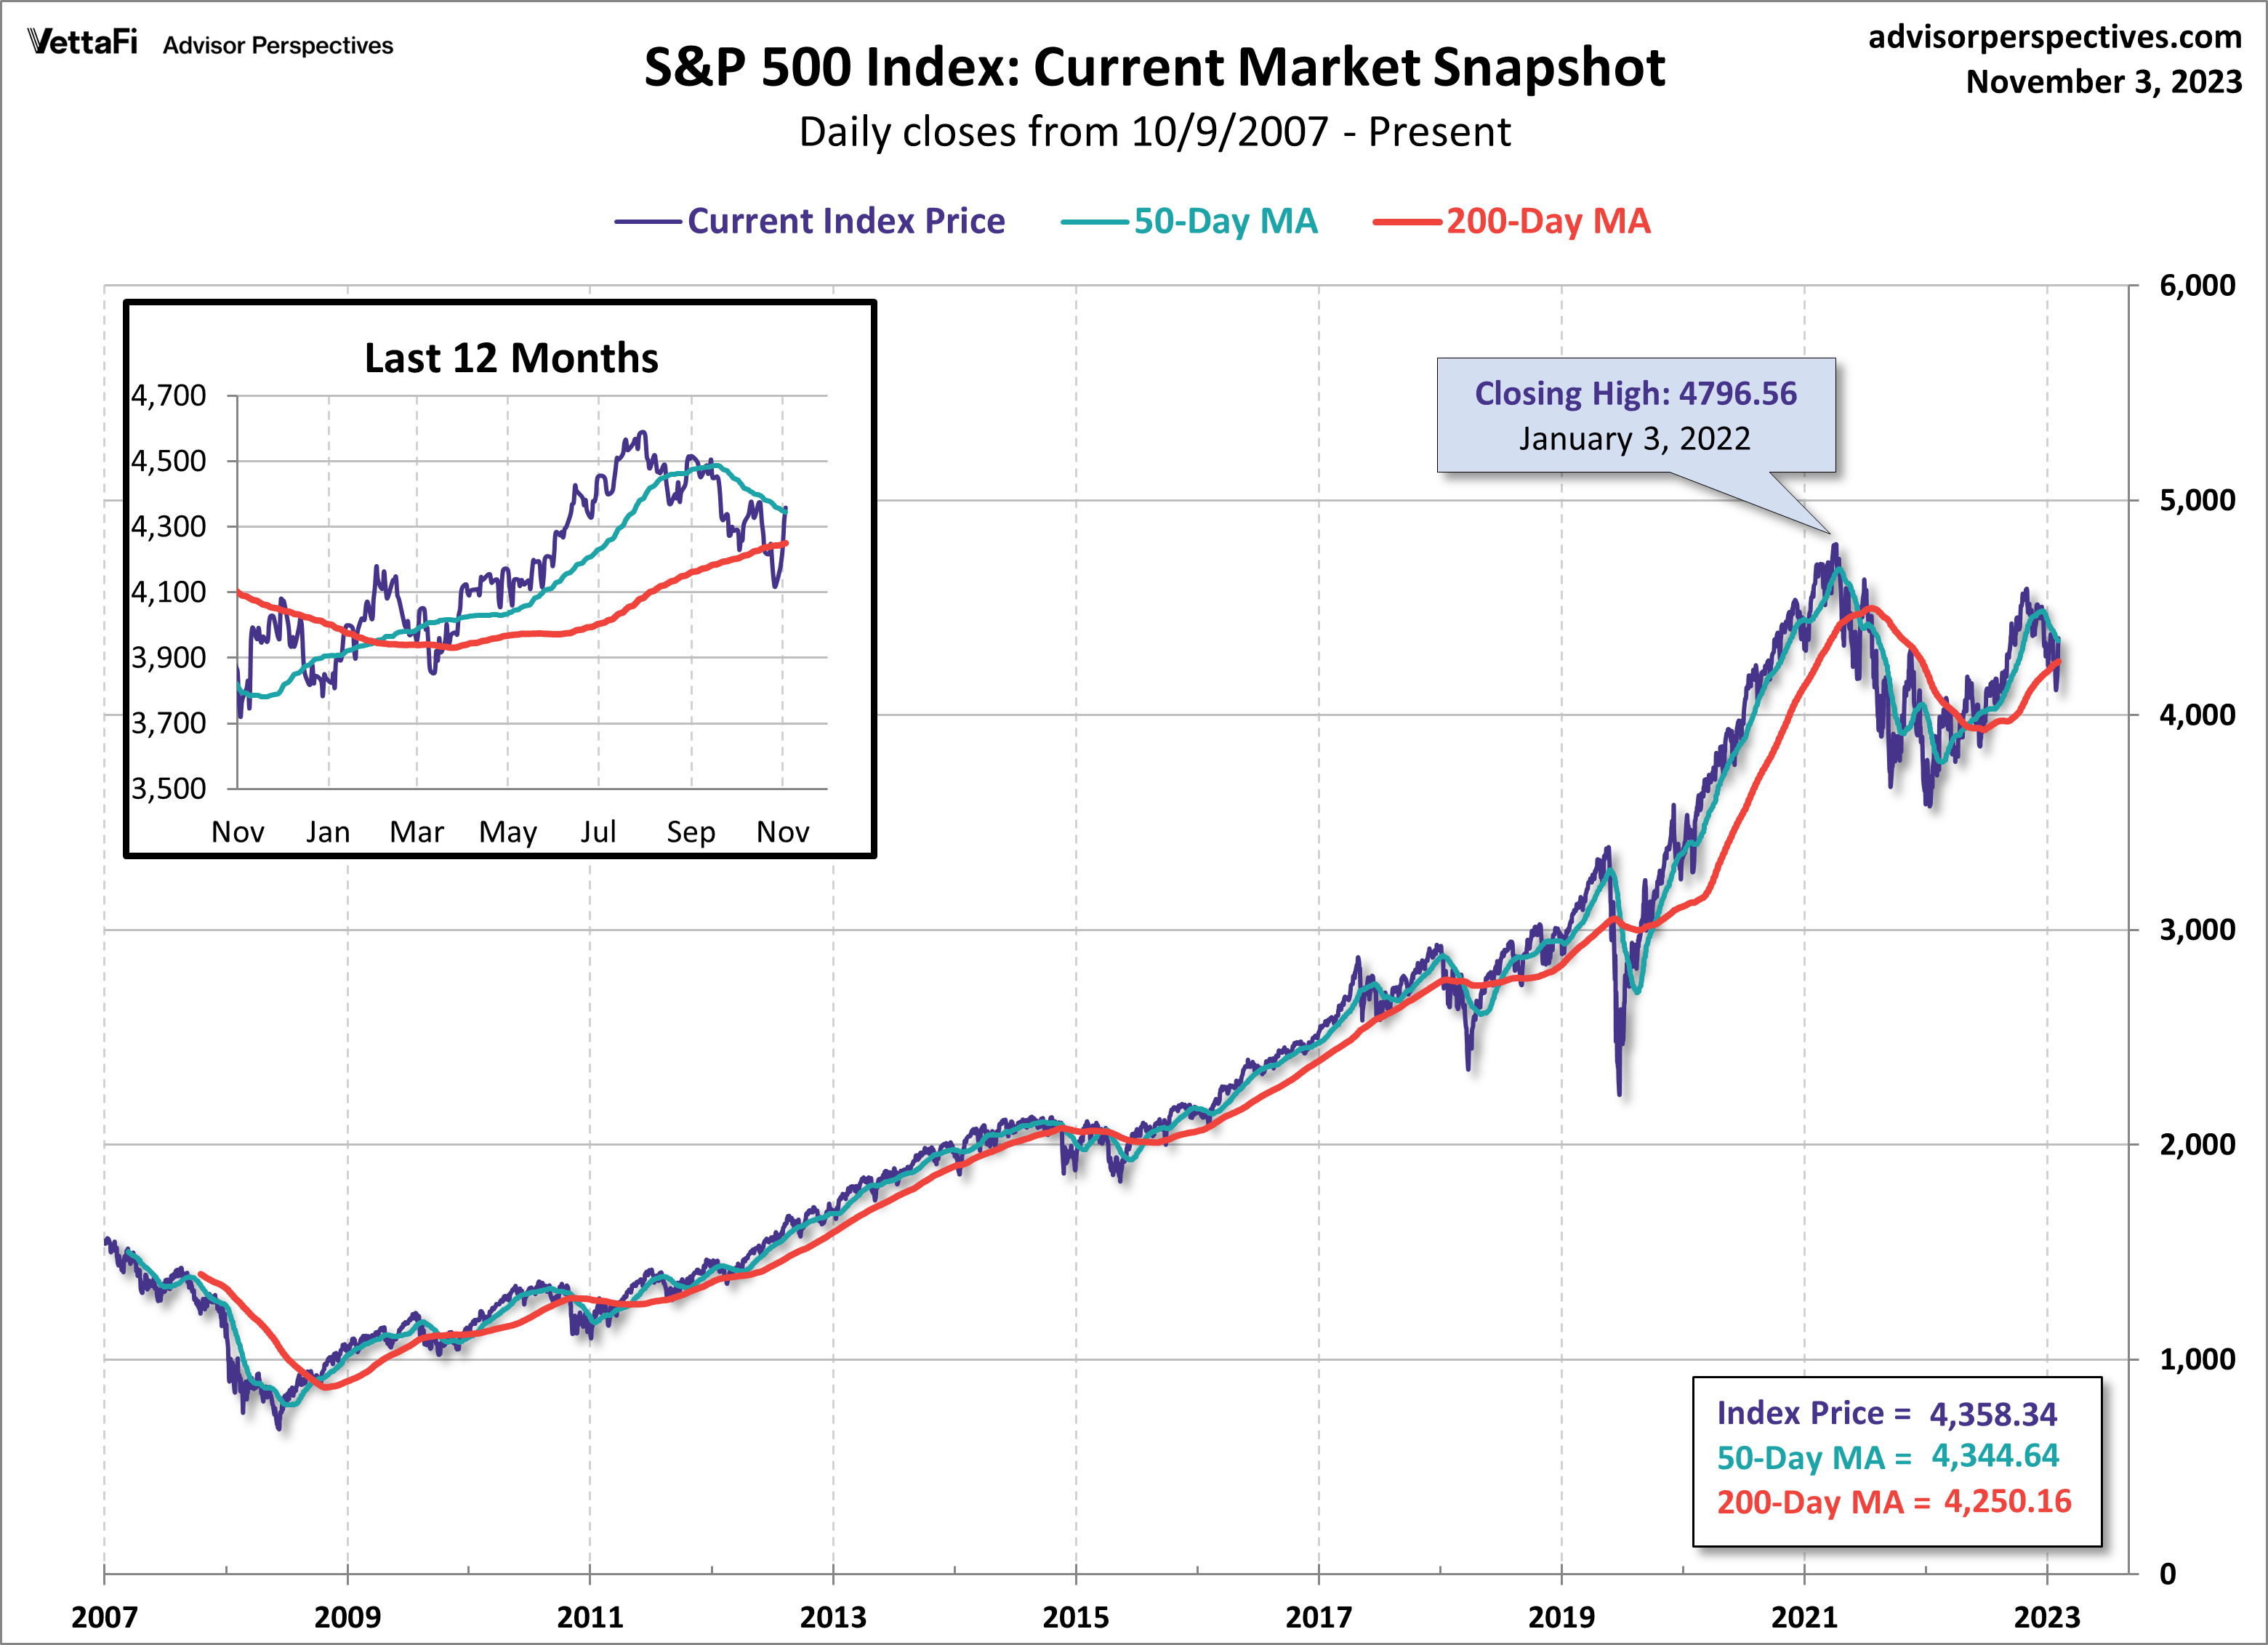
Here is a linearly scaled version of the same chart with the 50- and 200-day moving averages. Starting on August 16, the index dropped below its 50-day moving average for the first time since the end of March.
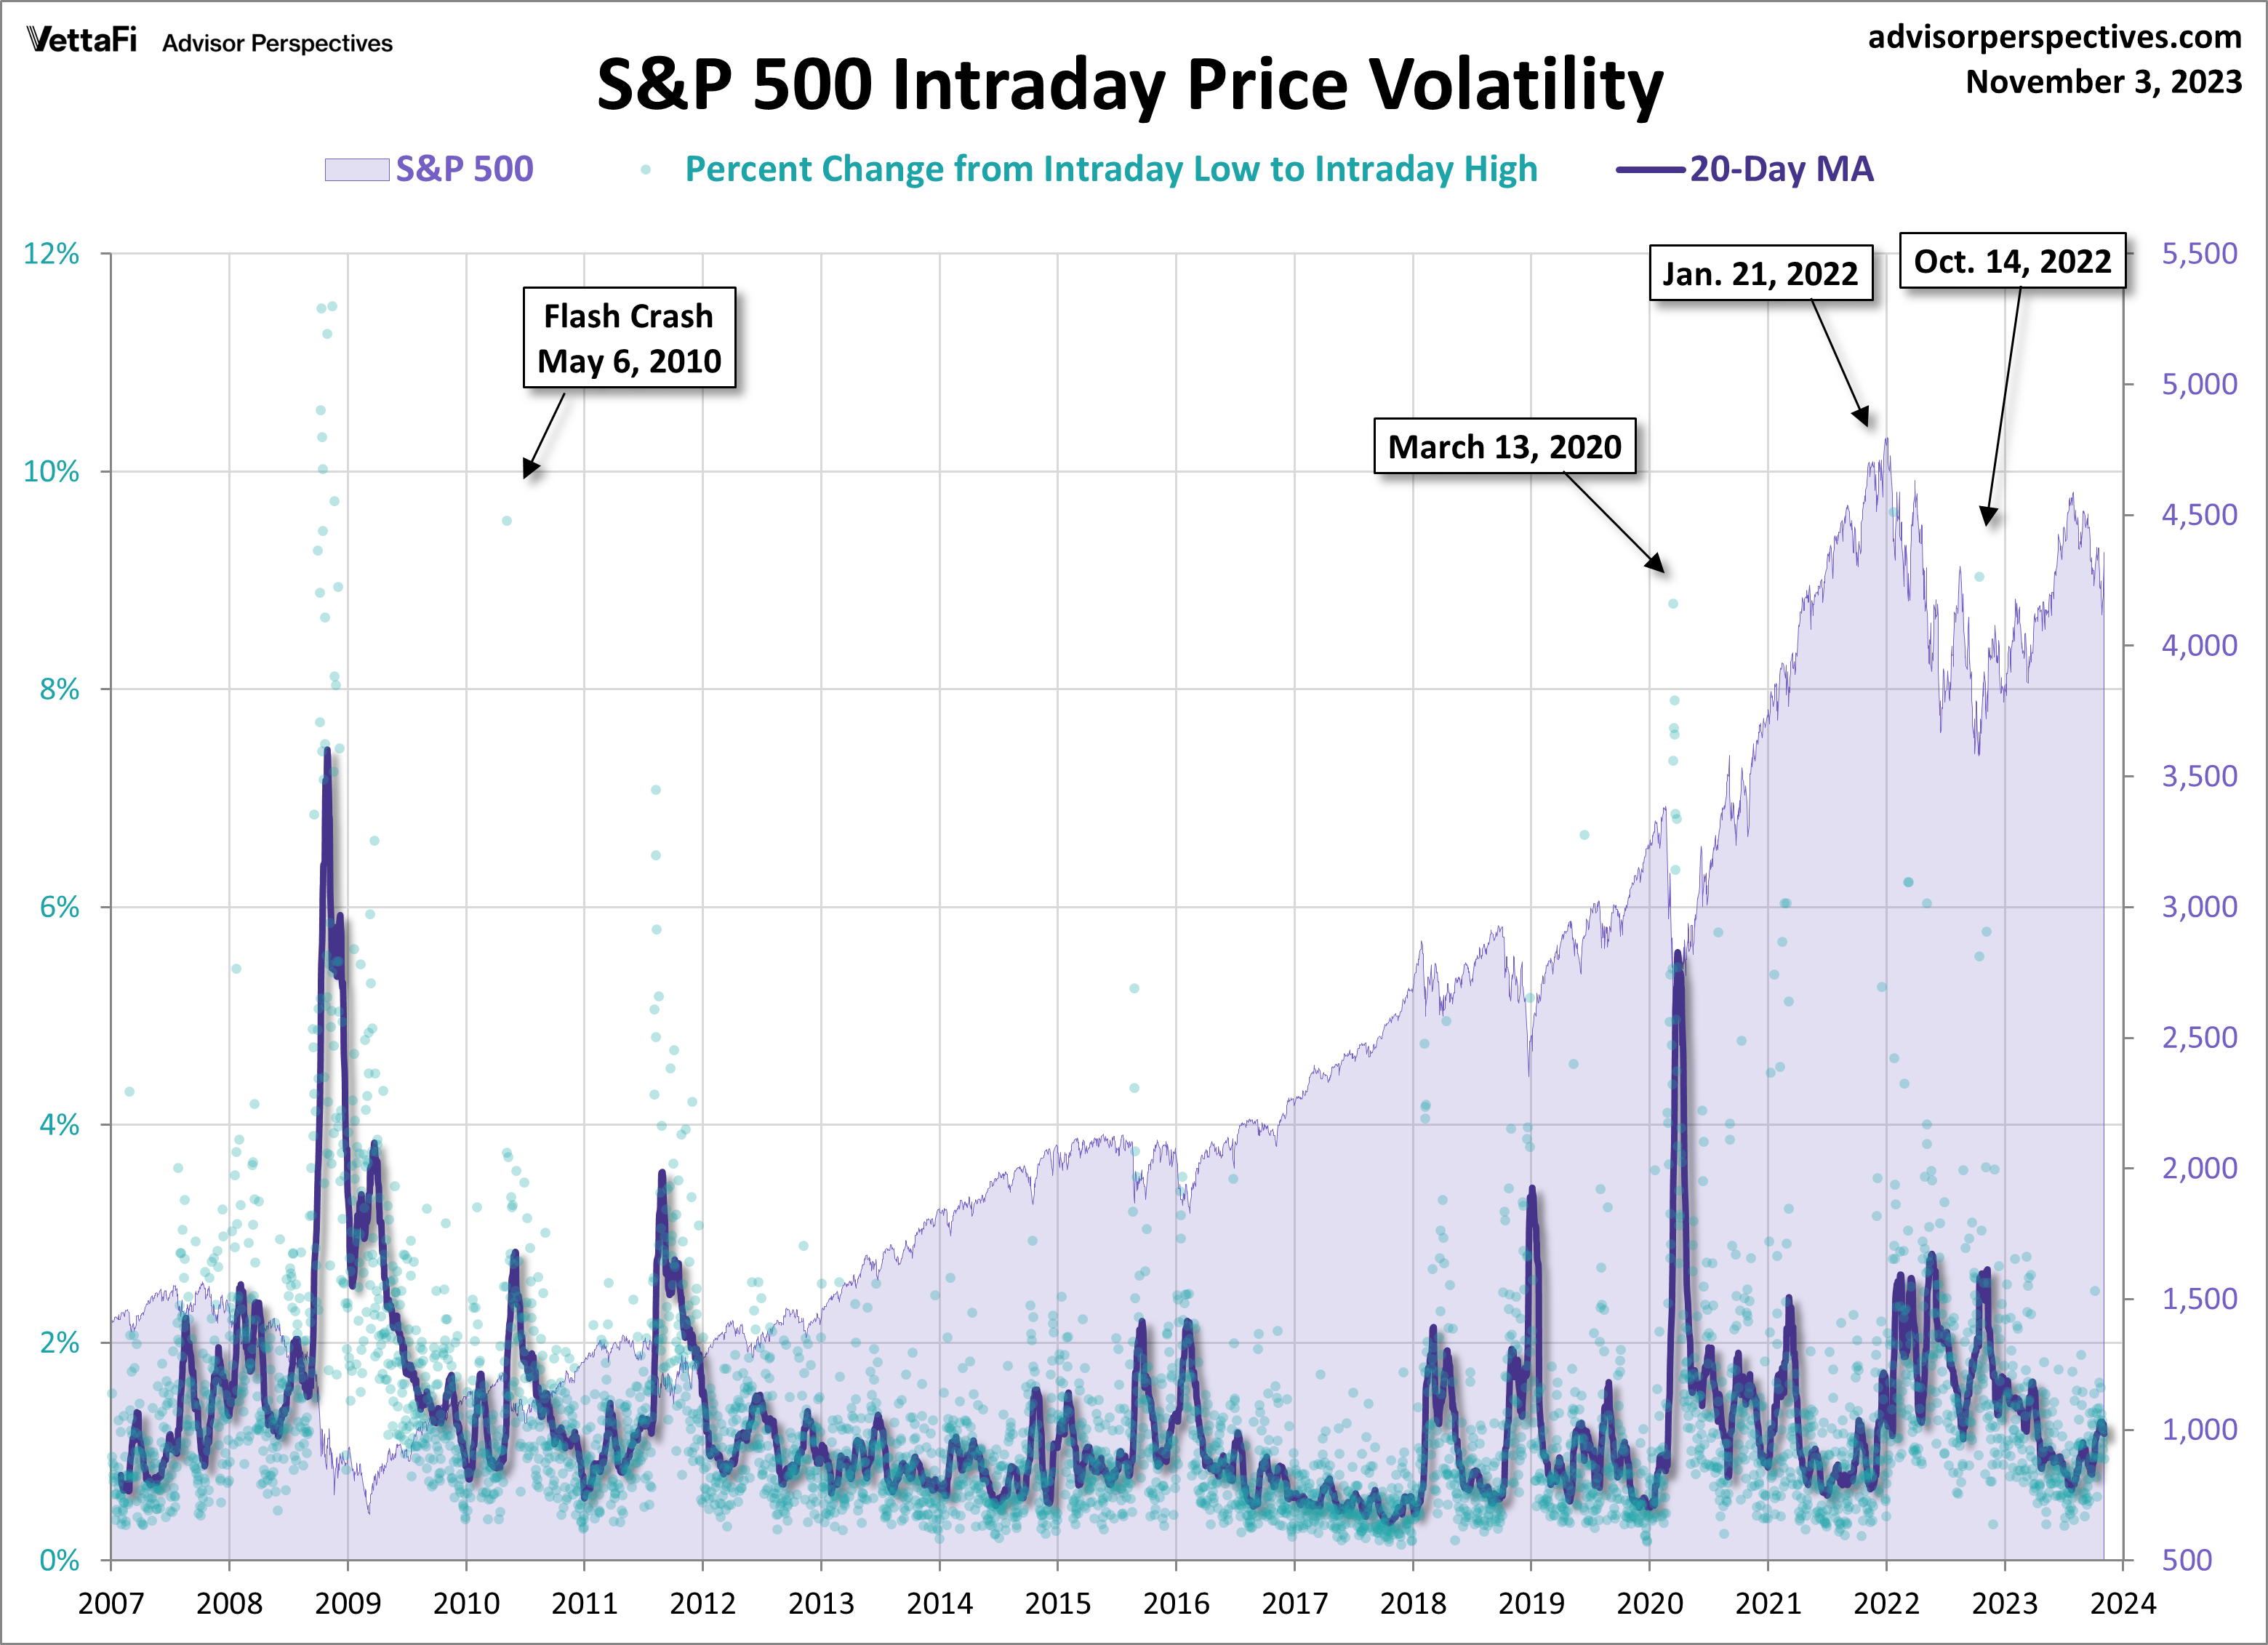
S&P 500: A Perspective on Volatility
For a sense of the correlation between the closing price and intraday volatility, the chart below overlays the S&P 500 since 2007 with the intraday price range. I’ve also included a 20-day moving average to identify trends in volatility.
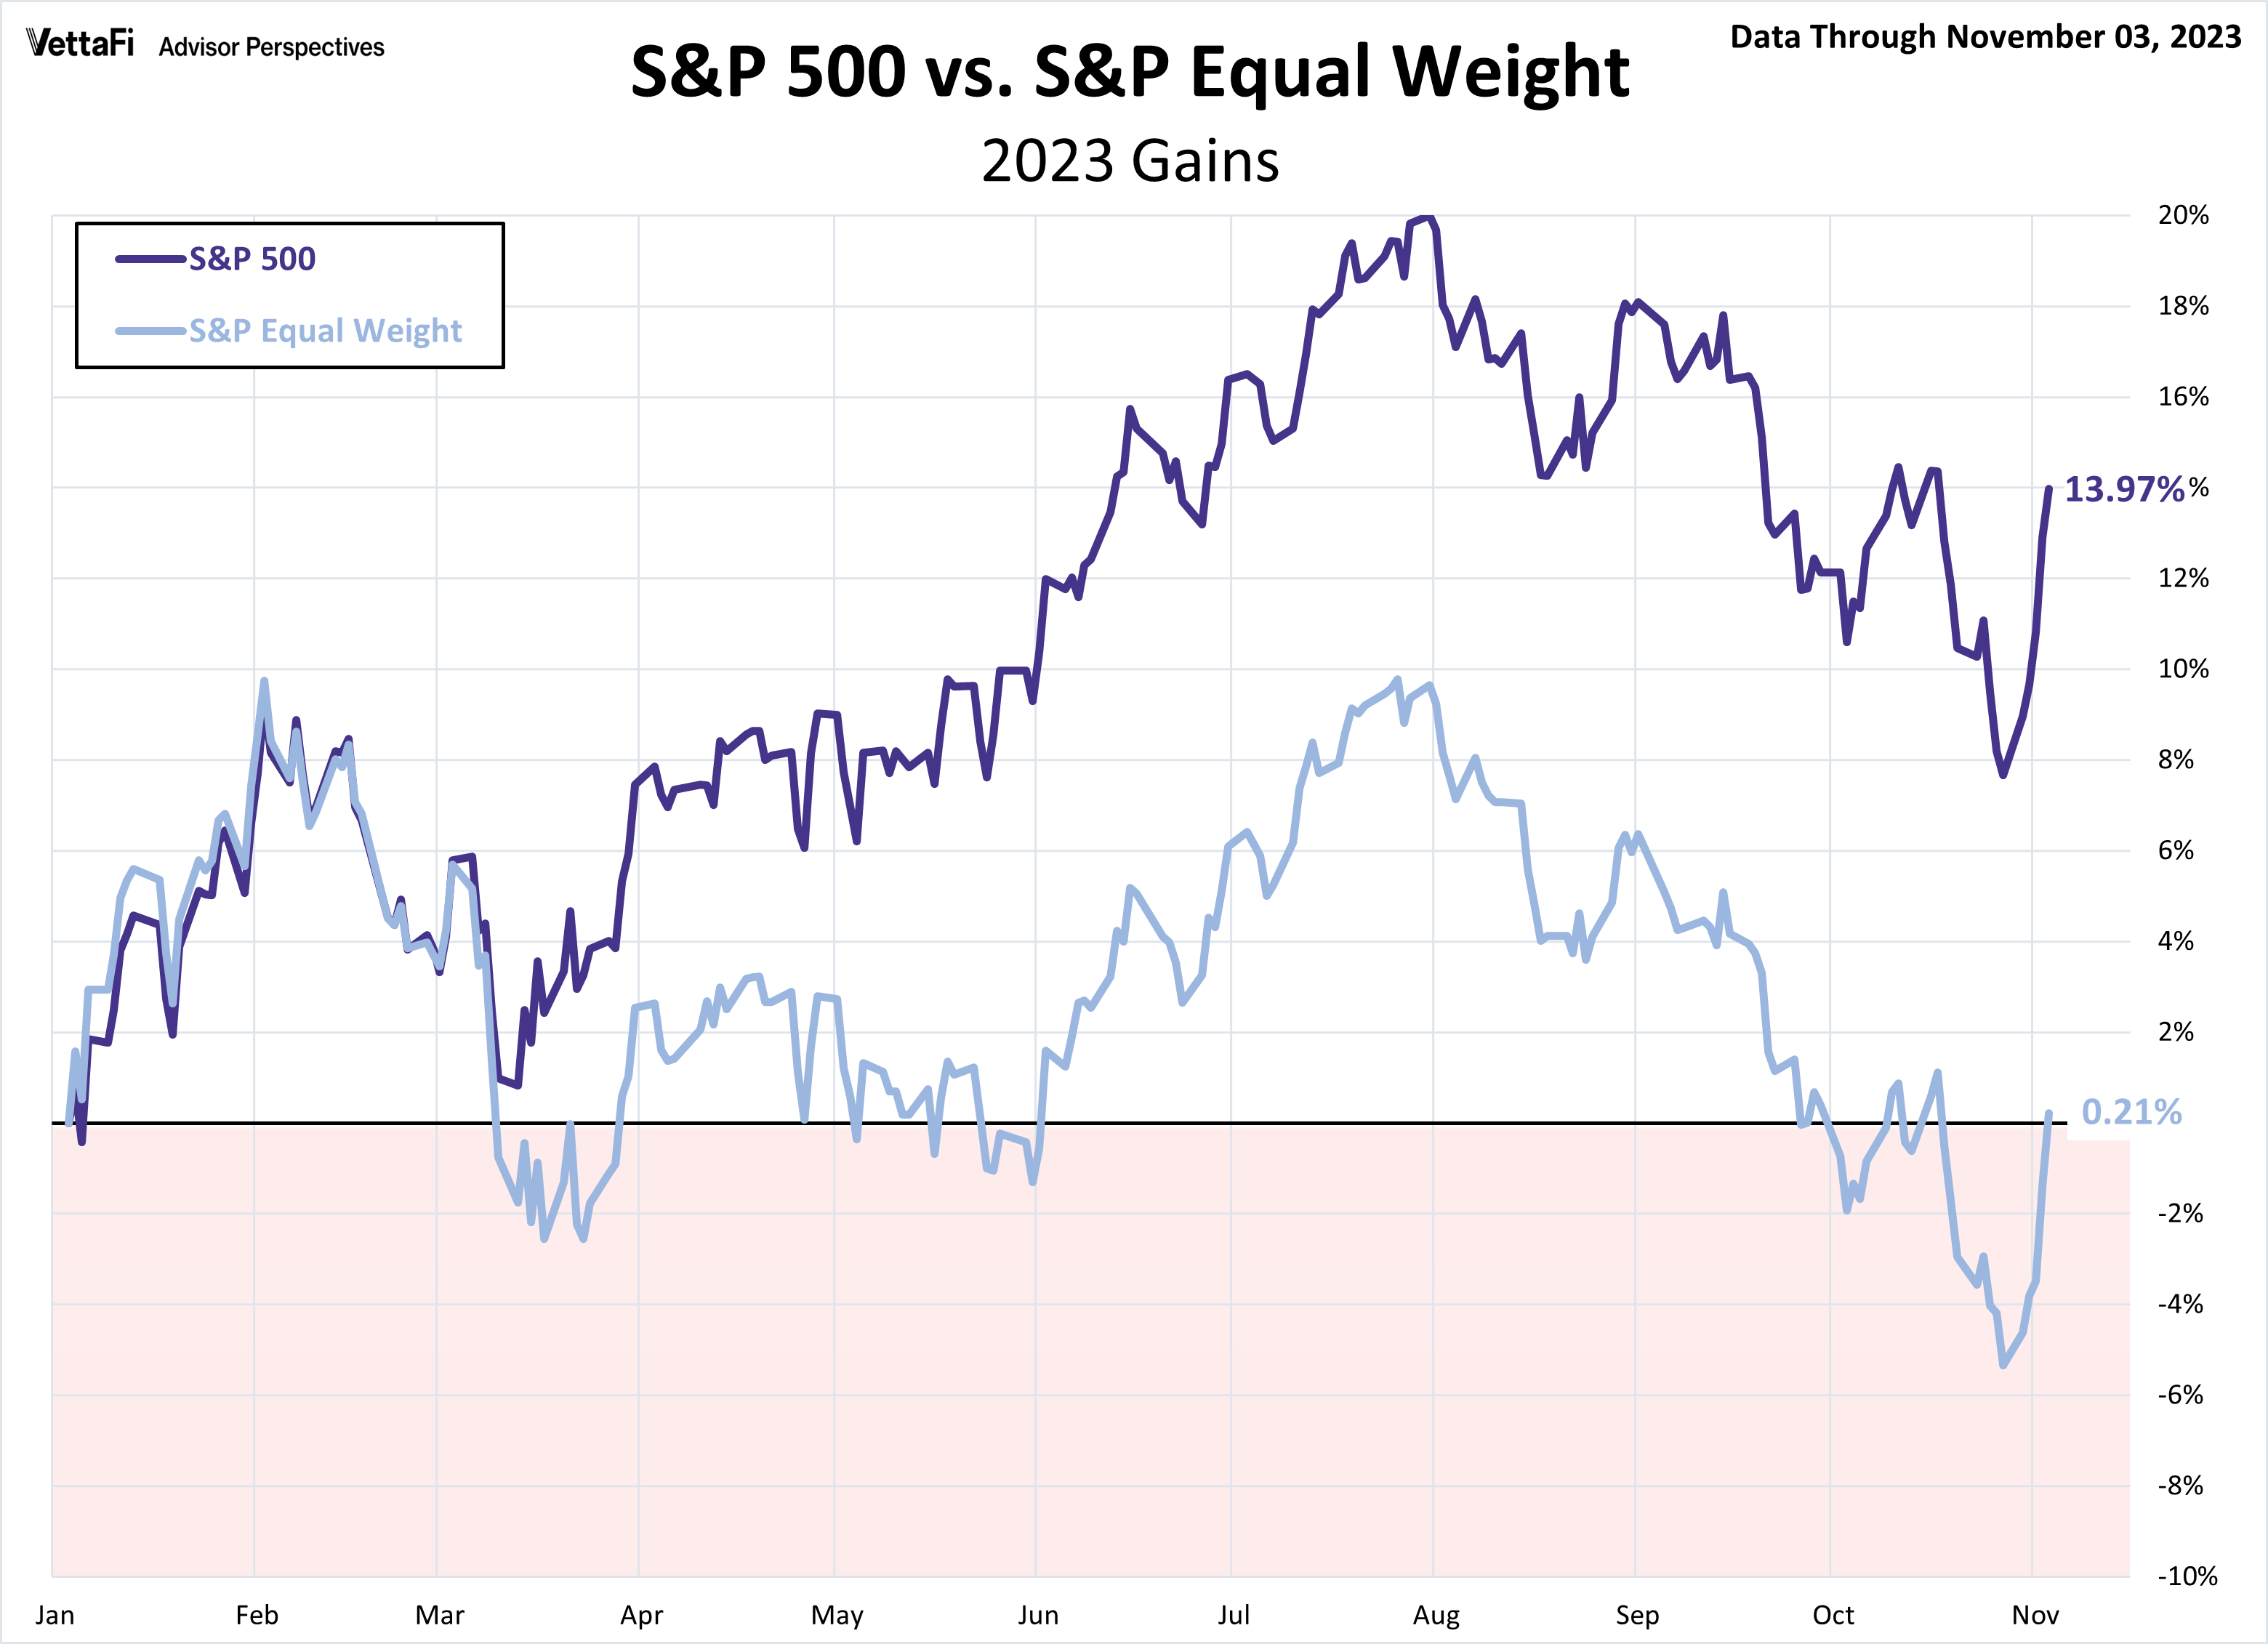
S&P 500 versus S&P Equal Weight
How does the S&P 500 match up against the S&P Equal Weight Index this year? The S&P 500 is currently up 13.97%, while the S&P Equal Weight is up 0.21%.
ETFs associated with the S&P 500 include: iShares Core S&P 500 ETF (IVV), SPDR S&P 500 ETF Trust (SPY), Vanguard S&P 500 ETF (VOO), SPDR Portfolio S&P 500 ETF (SPLG), and Invesco S&P 500 Equal Weight ETF (RSP).
For more news, information, and analysis, visit the Fixed Income Channel.
