
Longer-dated US Treasuries – those with maturities of 5 years or longer – continue to struggle. At best, coupon payments are keeping investors relatively flat. If they own anything longer than 5-year maturities, however, they are down over the last 12 months on a total return basis. This problem is affecting US corporate debt as well. That’s because tighter spreads over Treasuries have been more than offset by rising risk-free rates.
This fact is confusing to many investors because they think lower inflation, such as what we’ve seen over the last year, is always good for bond prices. Inflation expectations embedded in Treasuries are, in fact, lower by 0.4 to 0.5 percentage points over the last year. And, as the following chart shows, while the trend has been choppy, it has also been persistently to the downside.
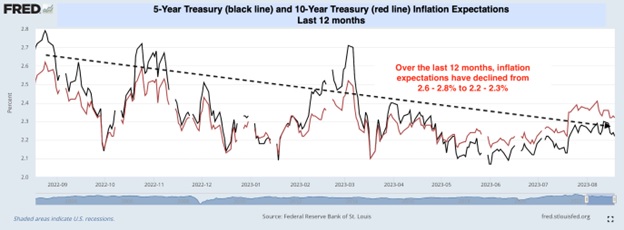
The problem is that inflation expectations alone do not drive nominal rates; real interest rates also play an important role. The yields that investors see on the screen are the addition of expected inflation and real interest rates. The chart below shows that real rates have increased over the last year by 1.6 to 1.8 percentage points. This more than offsets the decline in expected inflation and explains why Treasury prices continue to drift lower.
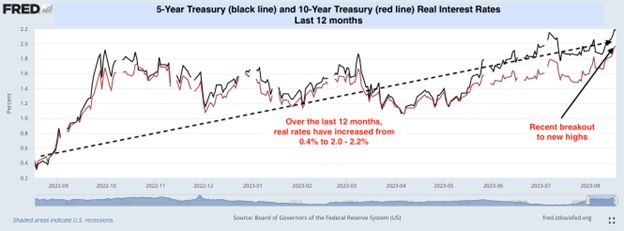
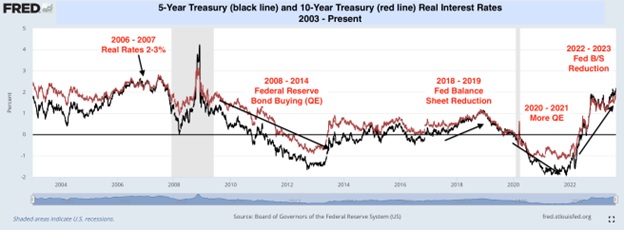
How much longer can real rates rise, and where might they eventually settle? To answer that question, we need to look at their long-run history. The following chart shows 5- and 10-year real Treasury yields from 2003 to the present.
Three Key Points of Interest
First, real interest rates ranged between 2 and 3 percent from 2006 – 2007 after being 1 – 2 pct earlier in the decade. The US economy was running strong, buoyed by a hot housing market and low (sub 5 percent) unemployment as the early 2000s economic expansion progressed. Another way to understand long-run real interest rates is that they are the market’s best guess of the long-run neutral rate of interest. This is the level of Fed Funds that is neither accommodative nor restrictive. The chart shows that the market reset its assumption of the neutral rate of interest as the US economy proved resilient in 2006 – 2007.
Second, the 2008 Financial Crisis/Great Recession and then the 2020 Pandemic Crisis/Recession pushed the Federal Reserve to buy Treasuries and agency securities to reduce real interest rates. As the chart shows, this worked extremely well. Real rates went negative, encouraging consumption and investment. After the worst of the Great Recession passed, the Fed then began to reduce the size of its balance sheet, and real rates went positive again.
Third, the current combination of a still-strong US economy and Federal Reserve balance sheet reduction is pushing real interest rates back into the same zone as 2006 – 2008 (2 – 3 percent). This makes sense from 2 perspectives:
- The neutral rate of interest is clearly higher than markets discounted in the 2010s. Fed Funds are over 5 percent, and yet the US economy is still growing at a decent clip and has been all year.
- On top of that, the Fed is still working to reduce inflation, and higher real rates (caused in part by their ongoing balance sheet reduction) help that effort. Chair Powell often talks about keeping real rates positive at all points on the yield curve. Ongoing Fed speaker communication on the need for further rate hikes says the FOMC wants them to go higher still.
Takeaway
We have been recommending to our clients that they overweight shorter-maturity debt in the fixed income portion of their portfolios, largely due to our belief that real long-term interest rates will continue to rise. Now that real yields are clearly breaking out, they could easily go to 2.5% – 3.0% or even higher. Eventually, there will be a tremendous buying opportunity in long-term Treasuries. In our view, however, that time has not yet come.
Further information:
For a 2-week free trial to the DataTrek Morning Briefing, click here: https://datatrekresearch.com/
To follow us on Twitter: https://twitter.com/DataTrekMB
To subscribe to our YouTube channel: https://www.youtube.com/@NickColasandJessicaRabe
For more news, information, and strategy, visit the Fixed Income Channel.
