
“The basis of karma is simple: you are the source of all your baggage. When you clearly perceive this, your essential quality changes. If you see someone else as the source, you will always be distracted, disoriented, bitter, frustrated, agitated, and angry. When you see yourself as the source, you are centered. Your energies are now focused within you. You are no longer enacting rituals of blame and rage in your head. You are no longer enslaved to your external environment or to your mind. Once you understand karma as your responsibility, you are free.”
Sadhguru
Karma
The View from 30,000 feet
Macro events last week dominated market action. Although fresh readings from the labor markets provided some sparks for speculation around Fed action and earnings report from Apple and Amazon moved individual names, the real story of last week took place in the bond market where the 10-Year Treasury went from a weekly low of 3.92 to a high of 4.20, threatening to breakout to new cycle highs before backing off again at the end of the week. Central banks were also in the spotlight with Japan forced to defend their currency in response to market pressures from the previous week’s dovish actions, the South American countries officially embarked on an easing cycle, and senior officials from both the Fed and ECB came out openly with statements that they no longer supported rate hikes.
- Labor market reports shows an encouraging trend but falls short the Fed’s threshold for comfort
- Bond market sniffing out higher yields all week got boost from Fitch with a downgrade of US debt
- Private markets showing signs of stress from rising rates and tighter lending standards
- The most Frequently Asked Question from clients this week: How expensive are the Magnificent 7?
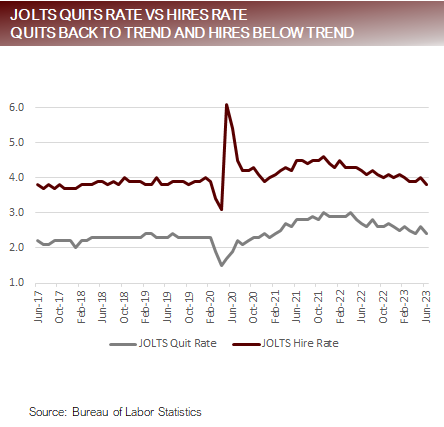
Labor market reports shows an encouraging trend but falls short the Fed’s threshold for comfort
- OLTS
- JOLTS reported 9582k, slightly below expectations with prior month revised 208k lower
- Quits Rate drops to 2.4%, considered in line with pre-pandemic trend
- Hire Rate drops to 3.8%, now slightly below pre-pandemic trend
- Payroll Report
- Nonfarm Payrolls 187k, below expectations of 200k, with prior month revised 16k lower
- Private Payrolls 172k, below expectation of 180k, with prior month revised 21k lower
- Unemployment 3.5%, below expectation of 3.6%
- Average Hourly Earnings YoY 4.4%, above expectation of 4.3%
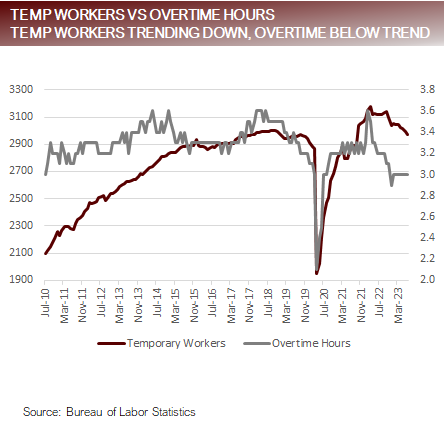
- Average Weekly Hours 34.3, below expectation of 34.4
- Jobless Claims
- Initial Jobless Claims 227k, slightly above previous week of 221k
- Continuing Jobless Claims, slightly above previous week of 1690k
- Institute of Supply Management
- ISM Manufacturing Report – Employment 44.4, the lowest measurement since the depths of the pandemic
- ISM Services Report – Employment 50.7, barely hovering in the expansion zone
- Key Take Aways
Data supports the view of a robust yet cooling labor market, where job openings are easing, hiring intentions are falling and people are generally working less hours. On the flip side, based on absolute levels the labor market is extremely tight and wage pressures are elevated, which will keep the Fed pleased with the direction of travel but aware that the destination is still off in the distance.
Key measures of labor market now at or below pre-pandemic trends, and still trending lower
Bond market sniffing out higher yields all week got boost from Fitch with a downgrade of US debt
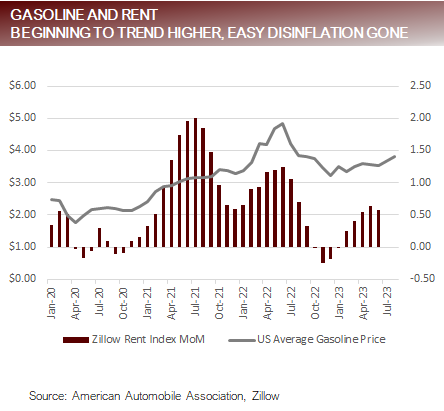
- Prior to the Fitch downgrade interest rates were trending higher because the “Big 3” – Food, Energy and Shelter – are all showing signs of upwards price pressures.
- Pressure from the Big 3 impacts bond pricing because:
- As disinflationary forces decrease the Fed may need to continue to raise rates to combat persistent inflation.OR
- Faced with inflationary pressures in the Big 3, the Fed hold rates steady and does not raise rates, but in doing so tacitly indicates it is willing to accept a higher inflationary target, which would indicate the neutral rate is higher causing upward pressure in rates.
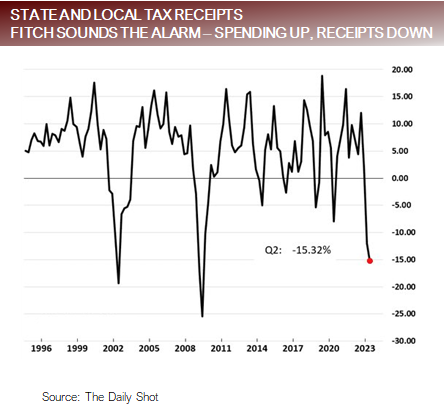
- The Treasury announced that it would have to increase to planned issuance of in Q3 by $247b to $1.0t because of a shortfall in tax revenue. Keep in mind that the last time the Treasury issued this volume of debt was during the pandemic when the Fed was buying $60b month. The Treasury currently plans to issue another $852b of debt in Q4.
- The Treasury also disclosed it is nearing its cap of 20% of issuance of T-Bills. This is significant because the excess Treasury issuance thus far has largely been focused on T-Bills, where demand from Money Markets has been absorbing the paper. If the majority of new issuance is going to have to be in Bonds, there are concerns about demand.
- The Fitch downgrade was an inconsequential event. The big event was August 5, 2011, when S&P downgraded US debt. This was a big event because many of the contracts for collateral were written in such a way that the collateral had to be AAA, causing a mad scramble. Collateral contracts have all been re-written, to exclude US government debt from downgrade criteria, making the Fitch downgrade a reminder about the US slide towards insolvency but nothing more.
Bond market showings signs of concern about inflationary pressures and size of debt issuance
Private markets showing signs of stress from rising rates and tighter lending standards
- Metrics form private capital markets
- Average All-in-Yield on First Lien Middle Market Loans Q2 2023: 12.09%
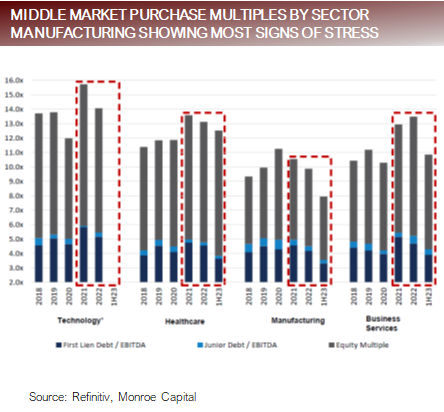
- Deal Pricing (multiples of EBITDA): Multiples have begun to compress, with manufacturing taking the largest hit (see sector chart page 9)
- Deal Volume (number of transactions): Sponsored Buyout LBO deals declined to $6b in Q2 2023, the lowest since Q3 2020
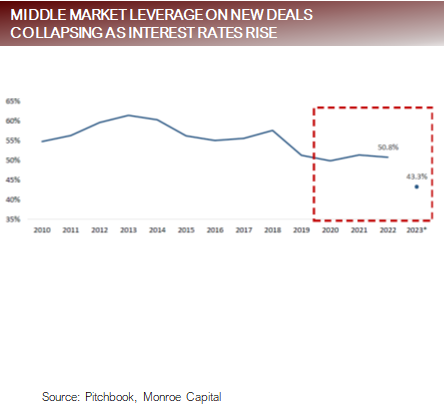
- Leverage (Loan to Value): Has dropped from over 55% to 43.3% Source: Monroe Capital
- Senior Loan Officer Opinion Survey reports banks continue to tighten lending standards citing:
- Less favorable or more uncertain economic outlook
- Reduced tolerance for risk
- Deterioration in liquidity positions,
- Worsening industry-specific problems
- Increased concerns about the effects of legislative changes, supervisory actions, or changes in accounting standards
- Decreased liquidity in the secondary market for loans
As interest rates rise and lending standards tighten, multiples have compressed with less leverage
FAQ: How expensive are the Magnificent 7?
The Magnificent 7 trades at a Forward P/E of 40.1x. This compares to the S&P500, which trades at 19.2x. Each of the respective sectors within the S&P500 trade at:
| Information Technology | 27.0x |
| Consumer Discretionary: | 25.7x |
| Consumer Staples: | 20.0x |
| Industrials: | 18.7x |
| Materials: | 18.1x |
| Healthcare | 17.5x |
| Communication Services: | 16.9x |
| Real Estate: | 16.8x |
| Utilities: | 16.6x |
| Financials: | 13.9x |
| Energy: | 11.9x |
- The S&P500 is trading a slight premium to its respective 5 and 10-year averages of 18.6x and 17.4x
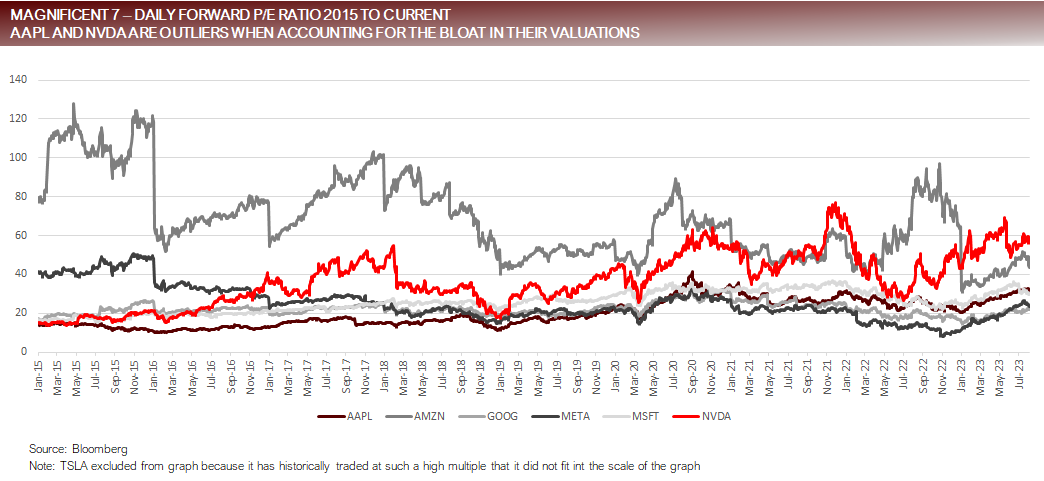
- The table below compares the current Forward P/E with the five years prior to the pandemic for the Magnificent 7. Note, that apart from AAPL and NVDA, and to some degree MSFT, the other companies are not expensive by historical standards.
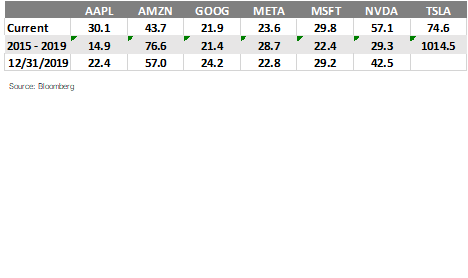
Magnificent 7 – not universally expensive by historical standards
Putting it all together
- The labor markets are cooling at a measured pace, which is supportive of the two parts story of the immaculate disinflation narrative – a gradual decline in employment combined with disinflationary pressures.
- A resurgence of inflationary pressures in the Big 3 – Food, Energy and Shelter – is threatening the second half of the immaculate disinflation narrative.
- The recent spike in interest rates represents the markets attempting to come to terms with the prospects of higher interest rates for longer because of inflation uncertainty and the Federal Government’s drunken sailor spending binge creating truck loads of US government debt that needs to find a home.
- The valuation picture for the Magnificent 7 is not universal. AAPL and NVDA, are outliers in premium from prior to the pandemic. It would be pretty easy to make a case that the Magnificent 7 is not particularly expensive by historical standards when looking at their P/Es. If their growth prospects have materially changed because AI is driving significant upside to their growth, as long as they continue to meet earnings expectations, it would be possible for multiples to expand further.
- With the latest Bloomberg survey indicating that two-thirds of investors expecting a recession by the end of 2024, and some of Wall Street’s most prominent strategists still calling for a recession and deflation, many investors are sidelined with fear of trying to pick up nickels in front of the recessionary steamroller lurking around the corner.
For more news, information, and analysis, visit the Fixed Income Channel.
DISCLOSURES AND IMPORTANT RISK INFORMATION
Performance data quoted represents past performance, which is not a guarantee of future results. No representation is made that a client will, or is likely to, achieve positive returns, avoid losses, or experience returns similar to those shown or experienced in the past.
Focus Point LMI LLC
For more information, please visit www.focuspointlmi.com or contact us at [email protected] Copyright 2023, Focus Point LMI LLC. All rights reserved.
The text, images and other materials contained or displayed on any Focus Point LMI LLC Inc. product, service, report, e-mail or web site are proprietary to Focus Point LMI LLC Inc. and constitute valuable intellectual property and copyright. No material from any part of any Focus Point LMI LLC Inc. website may be downloaded, transmitted, broadcast, transferred, assigned, reproduced or in any other way used or otherwise disseminated in any form to any person or entity, without the explicit written consent of Focus Point LMI LLC Inc. All unauthorized reproduction or other use of material from Focus Point LMI LLC Inc. shall be deemed willful infringement(s) of Focus Point LMI LLC Inc. copyright and other proprietary and intellectual property rights, including but not limited to, rights of privacy. Focus Point LMI LLC Inc. expressly reserves all rights in connection with its intellectual property, including without limitation the right to block the transfer of its products and services and/or to track usage thereof, through electronic tracking technology, and all other lawful means, now known or hereafter devised. Focus Point LMI LLC Inc. reserves the right, without further notice, to pursue to the fullest extent allowed by the law any and all criminal and civil remedies for the violation of its rights.
All unauthorized use of material shall be deemed willful infringement of Focus Point LMI LLC Inc. copyright and other proprietary and intellectual property rights. While Focus Point LMI LLC will use its reasonable best efforts to provide accurate and informative Information Services to Subscriber, Focus Point LMI LLC but cannot guarantee the accuracy, relevance and/or completeness of the Information Services, or other information used in connection therewith. Focus Point LMI LLC, its affiliates, shareholders, directors, officers, and employees shall have no liability, contingent or otherwise, for any claims or damages arising in connection with (i) the use by Subscriber of the Information Services and/or (ii) any errors, omissions or inaccuracies in the Information Services. The Information Services are provided for the benefit of the Subscriber. It is not to be used or otherwise relied on by any other person. Some of the data contained in this publication may have been obtained from The Federal Reserve, Bloomberg Barclays Indices; Bloomberg Finance L.P.; CBRE Inc.; IHS Markit; MSCI Inc. Neither MSCI Inc. nor any other party involved in or related to compiling, computing or creating the MSCI Inc. data makes any express or implied warranties or representations with respect to such data (or the results to be obtained by the use thereof), and all such parties hereby expressly disclaim all warranties of originality, accuracy, completeness, merchantability or fitness for a particular purpose with respect to any of such data. Such party, its affiliates and suppliers (“Content Providers”) do not guarantee the accuracy, adequacy, completeness, timeliness or availability of any Content and are not responsible for any errors or omissions (negligent or otherwise), regardless of the cause, or for the results obtained from the use of such Content. In no event shall Content Providers be liable for any damages, costs, expenses, legal fees, or losses (including lost income or lost profit and opportunity costs) in connection with any use of the Content. A reference to a particular investment or security, a rating or any observation concerning an investment that is part of the Content is not a recommendation to buy, sell or hold such investment or security, does not address the suitability of an investment or security and should not be relied on as investment advice.
This communication reflects our analysts’ current opinions and may be updated as views or information change. Past results do not guarantee future performance. Business and market conditions, laws, regulations, and other factors affecting performance all change over time, which could change the status of the information in this publication. Using any graph, chart, formula, model, or other device to assist in making investment decisions presents many difficulties and their effectiveness has significant limitations, including that prior patterns may not repeat themselves and market participants using such devices can impact the market in a way that changes their effectiveness. Focus Point LMI LLC believes no individual graph, chart, formula, model, or other device should be used as the sole basis for any investment decision. Focus Point LMI LLC or its affiliated companies or their respective shareholders, directors, officers and/or employees, may have long or short positions in the securities discussed herein and may purchase or sell such securities without notice. Neither Focus Point LMI LLC nor the author is rendering investment, tax, or legal advice, nor offering individualized advice tailored to any specific portfolio or to any individual’s particular suitability or needs. Investors should seek professional investment, tax, legal, and accounting advice prior to making investment decisions. Focus Point LMI LLC’s publications do not constitute an offer to sell any security, nor a solicitation of an offer to buy any security. They are designed to provide information, data and analysis believed to be accurate, but they are not guaranteed and are provided “as is” without warranty of any kind, either express or implied. FOCUS POINT LMI LLC DISCLAIMS ANY AND ALL EXPRESS OR IMPLIED WARRANTIES, INCLUDING, BUT NOT LIMITED TO, ANY WARRANTIES OF MERCHANTABILITY, SUITABILITY OR FITNESS FOR A PARTICULAR PURPOSE OR USE. Focus Point LMI LLC, its affiliates, officers, or employees, and any third-party data provider shall not have any liability for any loss sustained by anyone who has relied on the information contained in any Focus Point LMI LLC publication, and they shall not be liable to any party for any direct, indirect, incidental, exemplary, compensatory, punitive, special or consequential damages, costs, expenses, legal fees, or losses (including, without limitation, lost income or lost profits and opportunity costs) in connection with any use of the information or opinions contained Focus Point LMI LLC publications even if advised of the possibility of such damages.
