
Traditionally, the average investor has been advised to place 60% of their holdings in stocks and the other 40% in bonds. After all, diversification has long been the best way to even out the most volatile periods in the markets. While most investors have exposure to the U.S. fixed income market, exposure to international bonds also can help improve the diversification of a portfolio.
Unfortunately, bonds have gotten a bad rap during certain market periods, leaving some investors to wonder whether bonds still deserve such a large share of their portfolio. For example, Goldman Sachs reported that the classic 60/40 portfolio generated a return of only 2% annually during the so-called lost decade in the early 2000s, versus the average long-term annual return of 11.1%.
However, after the unusual market of 2022, which saw bonds and stock plunge alongside each other, the diversification benefits of holding both are back. In fact, investors may benefit even more by diversifying their bond portfolio to include both domestic and international bonds, and a great way to do this is through exchange-traded funds.
Vanguard offers two of the top bond ETFs: the Vanguard Total Bond Market Index Fund (BND) and the Vanguard Total International Bond Index Fund (BNDX).
BNDX’s Differentiated Performance
Of course, the most obvious difference between these two ETFs is that one holds U.S. bonds and the other holds international bonds. BND is a passively managed ETF that tracks the Bloomberg U.S. Aggregate Bond Index. BNDX is also a passively managed ETF, although it tracks the Bloomberg Global Aggregate Ex-USD Float Adjusted RIC Capped Index.
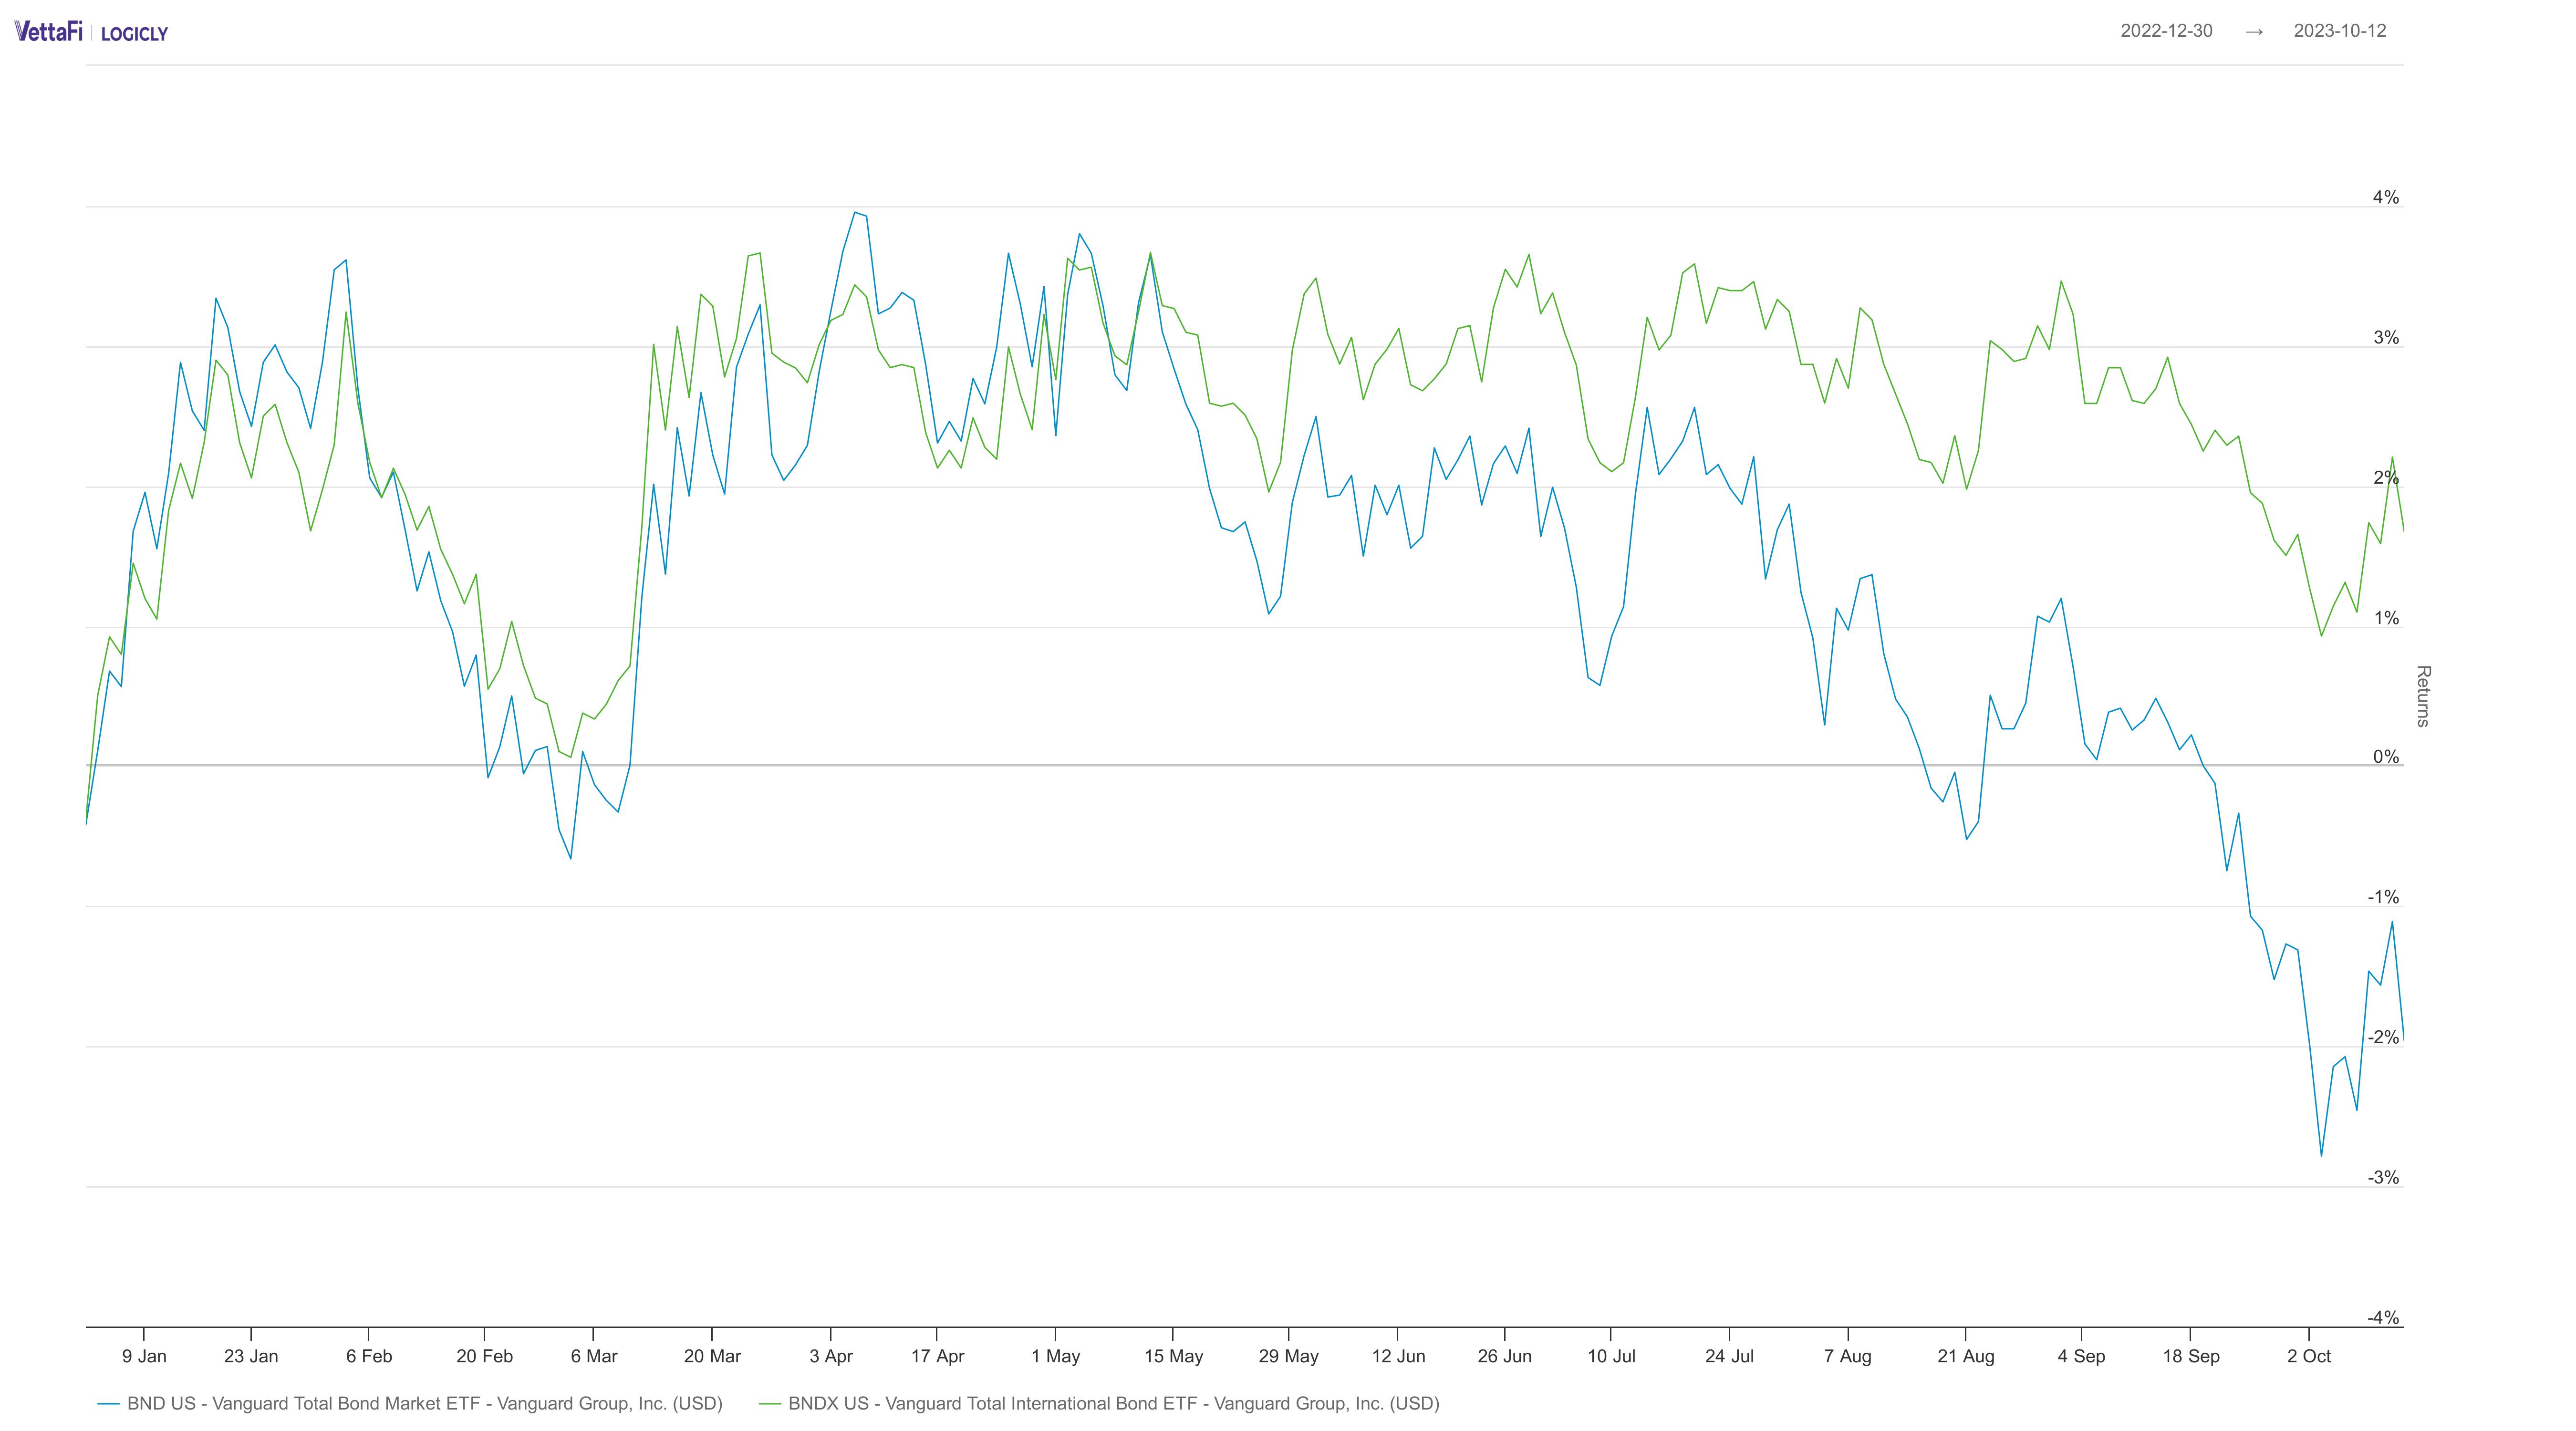
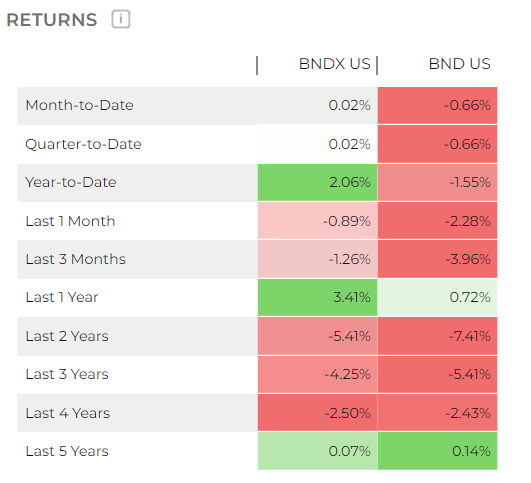
There are some key similarities and differences between BND and BNDX in terms of performance. For example, both are in the red on a month-to-date and quarter-to-date basis, with BND off 0.77% and BNDX down 0.34% over both windows.
However, on a year-to-date basis, BND is down 1.66%, while BNDX is up 1.7%. In fact, a deeper dive reveals that BNDX has been performing better than its U.S. counterpart recently. BNDX is down 1.25% over the last month, while BND has tumbled 2.23%. Over the last year, BNDX is up 1.53%, while BND is down 0.61%.
Other Key Comparison Points
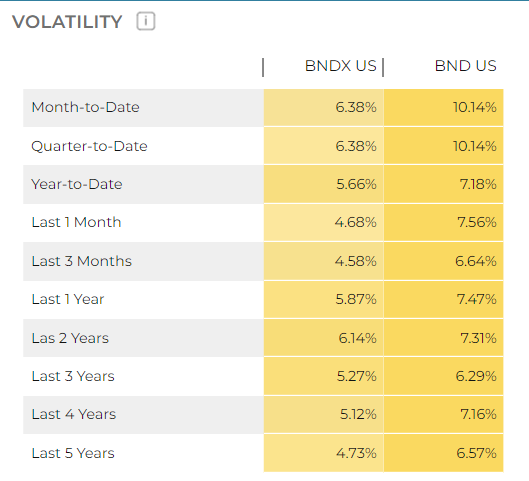
Interestingly, BND and BNDX are both roughly flat for the last five years annualized, with BNDX up 0.1% and BND gaining 0.2%. Meanwhile, BND’s volatility has been running at roughly twice that of BNDX — or more over some time frames.
For example, BND’s month-to-date volatility is 10.1%, versus BNDX’s volatility of 6.4%. On a year-to-date basis, BND has recorded a volatility of 7.2%, versus BNDX’s volatility of 5.7%.
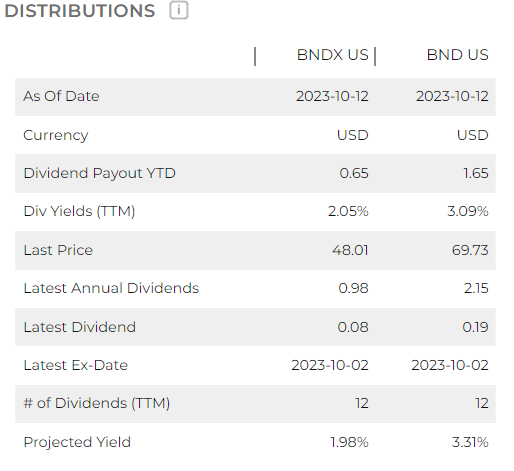
In terms of costs, BND’s expense ratio stands at 0.03%, compared to BNDX’s expense ratio of 0.7%. Additionally, BND has $94.7 billion in assets under management, versus BNDX’s AUM of $50.5 billion. BND has also been around much longer, with its inception date of April 3, 2007, while BNDX’s inception date was June 4, 2013.
Meanwhile, BNDX’s distributions over the last year are lower than BND’s. BND’s year-to-date dividend payout is 1.65, versus BNDX’s pay out of 0.65. Additionally, BND offers a dividend yield of 3.1%, while BNDX’s yield is 2.1%. Further, BND’s projected yield stands at 3.3%, compared to BNDX’s projected yield of 2%.
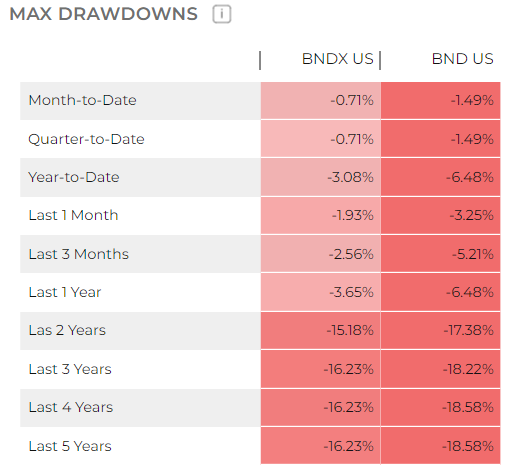
The maximum drawdowns for BNDX tend to be somewhat smaller than those for BND, which is likely because of its broad geographic exposure. Year to date, the maximum drawdown for BNDX is 3.1%, while BND’s is 6.5%. On a five-year annualized basis, BNDX has a maximum drawdown of 16.2% versus 18.6% for BND.
Why Include International Bonds in a Portfolio?
Of course, diversification is always a key benefit when it comes to adding multiple categories of securities within each asset class. After all, sometimes U.S. bonds may become weighed down by U.S interest-rate policy, while international bonds may take off due to the policies set by other central banks.
U.S. bonds are simply less correlated with non-U.S. bonds. As a result, Vanguard, for example, recommends that investors place at least 30% of their total fixed income exposure in international bonds. The firm noted that international bonds make up roughly 24% of the liquid, investable market and more than half of the global bond market.
Additionally, international bond funds can reduce your portfolio’s risk, smoothing out its returns during turbulent market periods. Historically, global bonds have tended to be less volatile, a fact that’s clearly evident in the comparison of BND’s and BNDX’s volatility above. In some cases, international bonds have even outperformed U.S.-only bond strategies.
At the end of the day, international bond ETFs like BNDX may just plug an important hole within an investor’s portfolio by offering improved hedging, less volatility, and the potential for greater returns, especially when the markets turn topsy-turvy.
Data provided by LOGICLY as of October 13, 2023.
For more news, information, and analysis, visit the Fixed Income Channel.
