
It’s no secret that we are currently in a high interest rate environment. The Federal Funds rate, the benchmark rate in the U.S. set by the Federal Open Market Committee (FOMC), currently sits between the range of 5.00% and 5.25%. This matches where rates were in 2007, right before the financial crisis. As high as rates are, however, we may be due for even tighter monetary policy this year.
Inflation in the United States has come down from its peak of 9.1% in June 2022 to around 4% today. It remains higher than the Federal Reserve’s 2% inflation target. The Fed has repeatedly expressed its view in 2023 that this goal will not change any time soon. Rate hikes are the main tool the Fed is endowed with to combat inflation. The plurality of FOMC participants believes that we are due for a 5.75% fed funds upper bound by the end of the year. This is expressed in the dot plot below, where each dot is one members’ view.
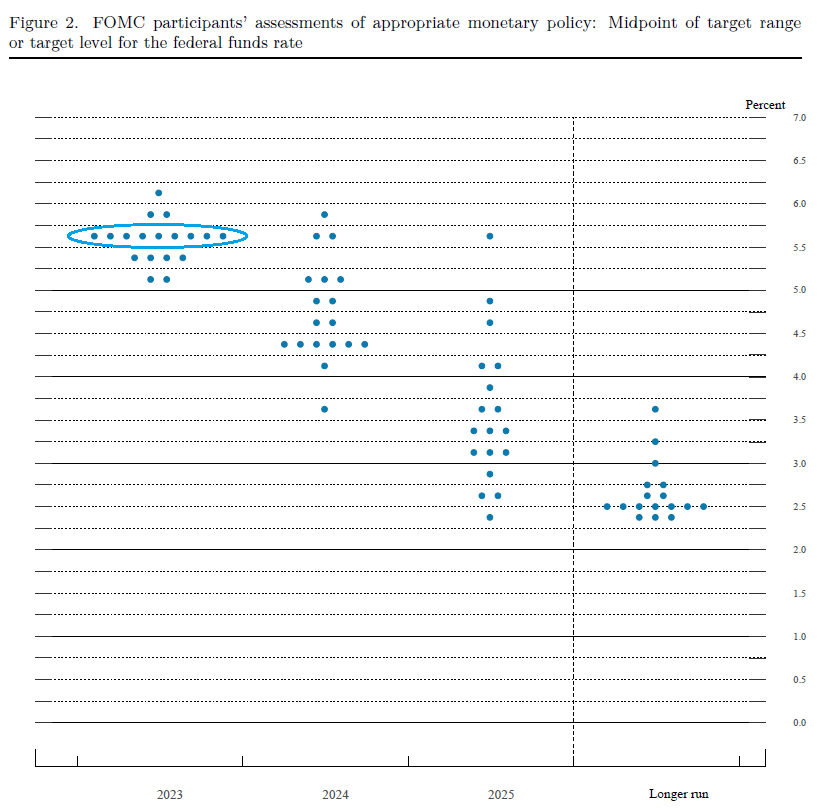
Source: FOMC projections from June 2023 meeting.
If this forecast comes to pass, we are due for the highest interest rates in over two decades. This affects everything from credit card APRs to mortgage rates. While rates on financial liabilities are likely to keep climbing, investors can employ various strategies to potentially benefit from this new economic reality. Here are three strategies worth considering:
U.S. Treasury Bills
U.S. Treasurys are considered one of the safest investments due to their creditworthiness and stability of the U.S. government. These securities currently hold a composite AAA rating from the three major credit rating agencies. The likelihood of default is extremely low, making them a reliable choice for risk-averse investors.
The yield curve is currently highly inverted. This means that short-term bonds have a higher yield than their longer dated counterparts. As of July 6th, six-month Treasury bills to maturity yield 5.54%, whereas the longest dated Treasurys, 30-year bonds, yield 4.01%. Investors can take advantage of this phenomenon by purchasing short-dated Treasury ETFs, which target this part of the curve.
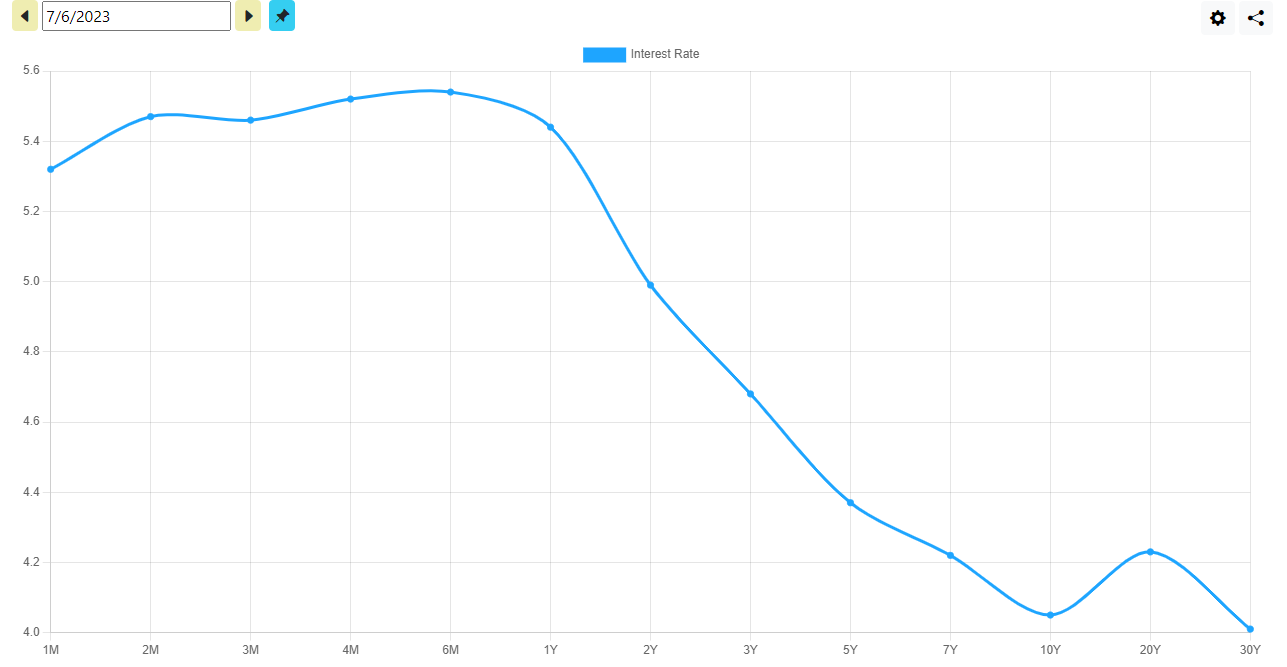
Source: www.ustreasuryyieldcurve.com
The choice of Treasury ETF depends on one’s objectives and risk tolerance. While Treasurys are considered to hold no credit risk, they are sensitive to interest rates, a measure known as duration. Duration, which is measured in years, provides an estimate of the bond’s price volatility in response to fluctuations in interest rates. Note this relationship is not perfect due to a concept called convexity. However, it works well for small changes in rates.
Those seeking to minimize duration have a few funds to choose from. One stands out due to its low fees and high liquidity. The iShares 0-3 Month Treasury Bond ETF (SGOV) has 0.09 years of duration, a 30-Day SEC Yield of 5.18%, and a net expense ratio of just 0.07%. It is also among the most liquid ultra-short Treasury ETFs, with a median bid/ask spread of 0.01% and $11 billion in AUM. If interest rates were to increase by 1% in a year, the price return of approximately -0.09% would be more than made up for by higher bond coupons as the portfolio managers reinvest matured proceeds. Conversely, if rates were to fall materially (perhaps due to a recession), the price return on the upside would be minimal.
ETFs with a longer duration, though still within the higher yielding one-year point, include State Street’s 3-12 Month T-Bill ETF (BILS) and the Goldman Sachs Access Treasury 0-1 Year ETF (GBIL). These funds have slightly higher fees at 0.14% and 0.12%, respectively. Still, higher durations closer to half a year corresponding with the longer maturities of their portfolios.
Preferred Stock
Preferred stock represents ownership in a company with elements combining common stock and bonds. Preferreds are issued with a stated par value. They usually pay a fixed dividend rate which is expressed as a percentage of this value. Like bonds their price fluctuates with movements in interest rates and the creditworthiness of the issuer. They also usually do not come with voting rights and rank between common stock and bonds in repayment priority in the case of bankruptcy.
Most preferreds are perpetual, meaning they have no maturity date and, therefore no mandated return of initial capital. Some are retractable. This means the company can call back the shares and exchange them for cash at the stated par value. As with bonds, the only thing that could stop payments on your standard fixed rate preferreds is them being called back or an issuer default.
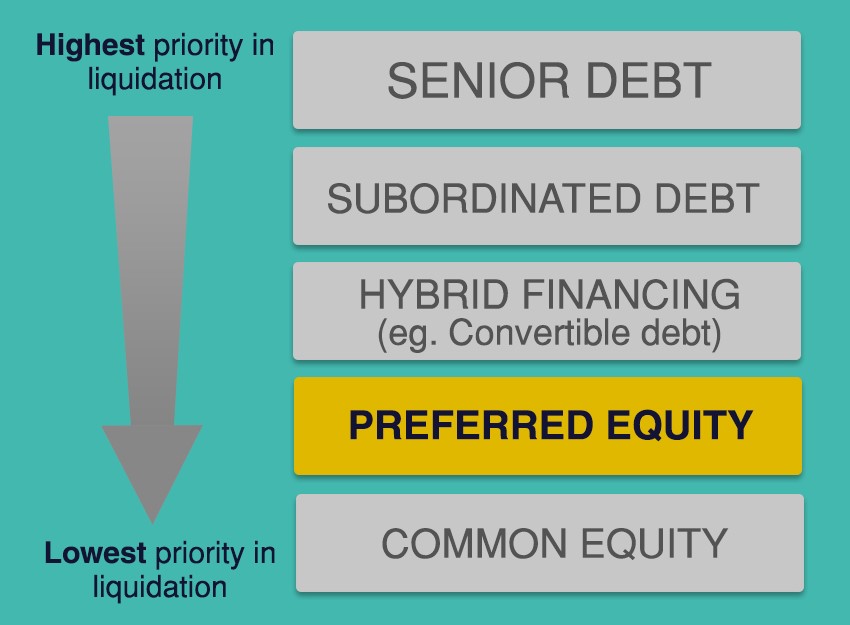
Source: RBC
While these bond-like features give them less potential for capital appreciation, preferreds are often considered a more stable investment compared to common stock. The fixed dividend payments and priority in receiving dividends and assets in case of liquidation make preferred stock less volatile than common stock. This stability can be attractive to investors seeking consistent income and lower risk compared to common stock.
The oldest and most liquid preferred stock ETF is the iShares Preferred and Income Securities ETF (PFF). It was launched in 2007 and currently has $13 billion in assets. As of May 31st, the fund had a 30-day SEC yield of 6.62%. Its expense ratio of 0.45% is the lowest among peers, but higher than most bond ETFs. Note this higher yield comes with credit risk. Among the preferreds that are rated, nearly the entire portfolio is rated BBB or lower. About three-quarters of the portfolio is in fixed dividend securities, while the remainder is in floating rate. The fixed rate portion therefore has duration while the floating preferreds do not.
Another option is the First Trust Preferred Securities & Income ETF (FPE), which sports a much higher 0.85% expense ratio. This is an actively managed strategy, and the portfolio management team has flexibility to change the duration and credit quality of the portfolio depending on market conditions. Furthermore, while PFF’s index focuses on U.S. securities, FPE typically only holds half of the portfolio in the U.S. The fund currently has a duration of 4 years. PFF is classified as an equity fund and iShares does not publish fixed income statistics like duration.
Corporate Floating Rate Bonds
Floating rate bonds, also known as variable rate bonds or simply floaters, are fixed-income securities with interest rates that adjust periodically based on a reference benchmark rate. Historically, most floaters were benchmarked to the London Interbank Offered Rate (LIBOR). However, since March 2020, issuance based on the Secured Overnight Financing Rate (SOFR) has outpaced LIBOR.
The largest issuer of floaters are banks, who prefer to have the interest on some of their liabilities float with a reference rate, given their investment income is sensitive to rates as well. Many other types of corporations issue these instruments as well. This is especially the case if they have immediate funding needs but believe rates may fall soon. Note since 2014 the U.S. Treasury has also issued floaters, benchmarked to the highest accepted discount rate of the most recent 3-month bill auction.
Corporate floaters have their coupon rate expressed as a spread over the benchmark rate. For example, a floating rate bond might have a coupon rate of SOFR + 1%, which means the interest paid to bondholders will be equal to the prevailing LIBOR rate plus an additional 1%. This spread is analogous to the issuer’s credit rating. Most floaters have both a cap and a floor, though some only have one and rarely neither. A cap represents the maximum interest the note will pay, while a floor represents the minimum.
Numerous ETFs target this large bond market. The vast majority of assets are benchmarked to U.S. dollar-denominated, investment-grade floaters. The two category leaders are the iShares Floating Rate Bond ETF (FLOT) and the SPDR Bloomberg Investment Grade Floating Rate ETF (FLRN). Both track the same index, the Bloomberg US Floating Rate Notes (<5Y) Index. They also feature identical expense ratios at 0.15%, but FLOT has about three times the AUM.
Coming in at one basis point cheaper is the VanEck IG Floating Rate ETF (FLTR), which tracks the MVIS® US Investment Grade Floating Rate Index. The main difference between these indices is their face value minimum – bonds in the Bloomberg Index must have a minimum of $300 million outstanding while for the MVIS Index this number is $500 million. Since these funds all have durations near zero, investors should pay attention to credit spreads, which can be a material contributor to returns.
For more news, information, and analysis, visit the Financial Literacy Channel.
