

By Daniel Prince, CFA
KEY TAKEAWAYS
- Chasing performance, fear of missing out, and focusing on the negatives are three common mistakes many investors may make.
- History shows investors who overreact to near-term market events typically end up doing worse than if they stuck to their long-term plan.
- Just having an awareness of these typical pitfalls may help improve your portfolio’s performance.
Nobody’s perfect, especially when it comes to investing. Heck, even Warren Buffett’s firm reported a $44 billion second-quarter loss as its investment portfolio slumped.1 One reason even the best investors may fail to keep pace with the broader market is because we’re only human, born to make mistakes.
In our daily lives, we know it’s hard to break bad habits, like eating too much junk food. The same is true for investing. Just as understanding which foods are better for you, knowledge is power when it comes to your portfolio.
So here are three common mistakes investors make — and some tips for how to address them.
PERFORMANCE CHASING
The average investor tends to choose funds based on whether they recently beat their benchmarks, presumably because they believe these funds will continue to outperform.2 However, the data indicates the best-performing funds have rarely stayed at the top for long. Out of 549 actively managed domestic equity funds that were in the top quartile in June 2017, fewer than 3% remained in the top quartile four years later.3 Finding active funds with the ability to persistently beat their benchmark could add meaningful value to portfolios, but they may be difficult to find before the fact.
The same is true of investing in individual stocks. Many of us, especially those new to investing, are drawn to the “high-fliers”; unfortunately, the phrase ‘like moths to a flame’ often applies here.
Choosing a stock or fund because it recently performed well can lead you to ignore long-term evidence in favor of current trends. When investors act almost exclusively on short-term market events, it can support performance-chasing tendencies that can hurt long-term returns.
Tip: “Past performance is no guarantee of future returns” is not a footnote to be ignored; keep this phrase top of mind when you’re considering any investment. Just like driving, it’s better to invest looking at the road ahead vs. staring in the rearview mirror. Other criteria should also be considered when seeking a fund to meet investment goals, such as the investment objective, fees, and taxes, for example. iShares Core ETFs have shown an ability to deliver top-quartile returns while keeping costs and taxes low, and may help investors achieve their financial goals.4
HINDSIGHT BIAS
If you’ve ever thought “I shoulda seen that coming”, you’re not alone.
It may be common for people to think the past was predictable, which could lead to “herding” behavior in the markets. This occurs when investors purchase assets after a strong period of performance based on the misguided belief they “knew” the investment would perform well. FOMO, or “fear of missing out,” plays a role here.
As with performance chasing, the data show that money tends to follow returns — often with detrimental results. For example, investors piled into equity funds in 1999 after technology stocks had soared — just as the bubble was about to burst. Similarly, investors flocked to bond funds after the Great Financial Crisis, and many missed the subsequent bull market in stocks as a result.
Tip: Hindsight may be 20-20, but there’s really no way to predict the future. Chasing the hot trends may be tempting but successful long-term investors may be best served by building a plan and sticking to it.
Chasing performance can lead to poor outcomes
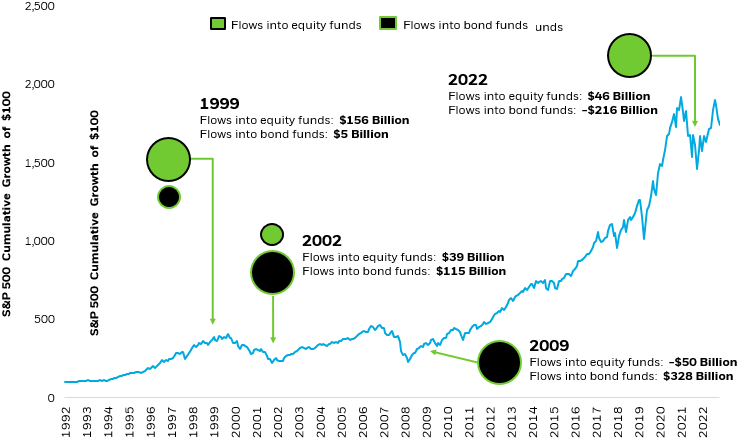
Source: BlackRock and Morningstar. Data covers period 12/31/1992 to 12/31/2021. Equity funds contain all ETFs and Mutual funds in the Morningstar US equity category. Bond funds contain all ETFs and Mutual funds in the Morningstar Taxable bond category. Flow figures are as of 12/31 of each year.
Index performance is for illustrative purposes only. Index performance does not reflect any management fees, transaction costs or expenses. Indexes are unmanaged and one cannot invest directly in an index. Past performance does not guarantee future results.
Chart description: Chart showing how money has often flowed into stock funds after periods of strong market performance.
LOSS AVERSION
While our cave-dwelling ancestors couldn’t grok the modern world, human evolution hasn’t kept pace with the rate of technological change. Our brains remain hardwired to avoid danger, be it a saber-tooth tiger or recent declines in our portfolio.5
For most investors, the pain of investment losses stings harder and lasts longer than the joys of similar-sized gains. As a result, many of us focus more heavily on the short-term, particularly during periods of market upheaval. Unfortunately, history shows investors who overreact to market events typically end up doing worse than if they stuck to their long-term plan.
Consider the following:
- From 1919 through 2021, the U.S. stock market has never had negative returns on a rolling 20-year basis. And since 1972, the S&P 500 hasn’t had negative returns on any rolling timeframe longer than 12 years.6
- In the past 28 years, the S&P 500 had an average intra-year decline of nearly 15%. Yet the index had positive annual returns in over 70% of those years.7
- Since 1989, the S&P 500 outperformed cash 88% of the time on a rolling 10-year basis (see chart below).8
Tip: It’s critical to focus on your time in the market rather than worrying about timing the market. Building a diversified portfolio can smooth the ride, which can help you stay the course even through turbulent markets. iShares Core ETFs can make this easy by providing low-cost access to global stocks and bonds. Additionally, minimum volatility strategies such as the iShares MSCI USA Min Vol Factor ETF (USMV) can help reduce risk within the stock portion of a portfolio, which can help you stay in the market, for the long-term.
Stocks vs. Cash: Time has been on the side of equities
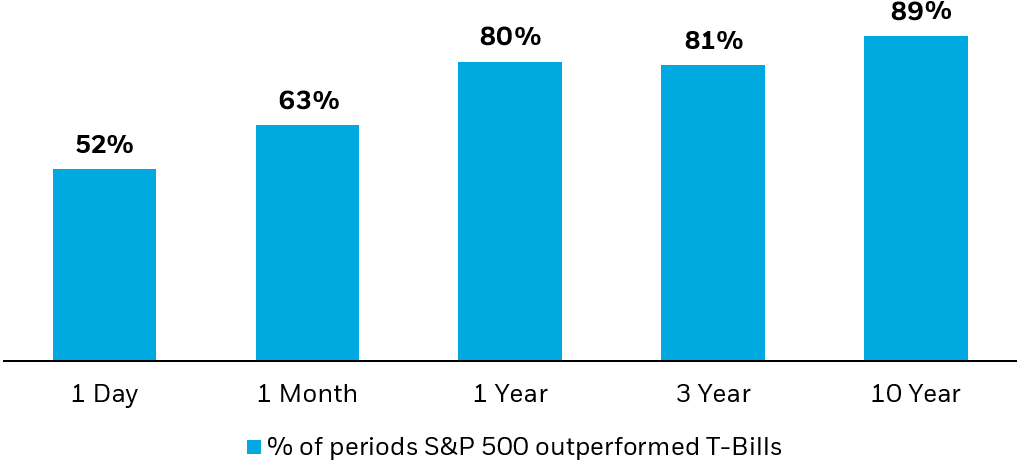
Source: Morningstar. Data covers period 12/31/1989 to 12/31/2021. Stock returns are represented by the S&P 500 total return index. Cash returns are represented by 3 Month US T-Bills.
Index performance is for illustrative purposes only. Index performance does not reflect any management fees, transaction costs or expenses. Indexes are unmanaged and one cannot invest directly in an index. Past performance does not guarantee future results. Index performance does not represent actual Fund performance. For actual fund performance, please visit www.iShares.com or www.blackrock.com.
Chart description: Bar chart showing the percentage of rolling periods during which the S&P 500 outperformed U.S. Treasury bills; the probability of stocks outperforming cash historically increases with time.
CONCLUSION
Of course, breaking bad habits is easier said than done (and potato chips taste good!). We know there’s no magic wand to change human nature but hopefully having awareness of these common errors can help you avoid costly mistakes and potentially achieve better returns in your portfolio.
This article was originally published on iShares.com on Oct 3, 2022.
© 2023 BlackRock, Inc. All rights reserved.
1 Berkshire Hathaway Inc. second-quarter results, released Aug. 6, 2022.
2 Hsu, Jason C. and Myers, Brett W. and Whitby, Ryan J., Timing Poorly: A Guide to Generating Poor Returns While Investing in Successful Strategies (May 1, 2015). Journal of Portfolio Management, Vol. 42, No. 2, 2016.
3 Source: S&P Dow Jones Indices: S&P Persistence Scorecard as of June 2021. The S&P Persistence Scorecard is released twice per year and uses a survivorship bias free mutual fund database to track the consistency of top performers over yearly consecutive periods. Index funds, sector funds, and index-based dynamic (bull or bear) funds are excluded from the sample. Only the share class with the highest previous return for each fund is used. Past performance does not guarantee future results.
4 Morningstar, as of 6/30/2022. Comparison universe is ETFs and mutual funds in the Morningstar category and uses total return. IVV, IJH, and IJR 89%, 72% and 92% of their ETF and mutual fund peers over the last ten years. Performance may be different for other time periods. Past performance is no guarantee of future results.
5 Source: Evolved attitudes to risk and the demand for equity — PubMed (nih.gov).
6 Source: Bloomberg, Crestmont Research.
7 Source: BlackRock, MSCI and Morningstar. Calendar year returns for period 1994 to 2021.
8 Source: Morningstar. Data covers period 12/31/1989 to 12/31/2021.
Carefully consider the Funds’ investment objectives, risk factors, and charges and expenses before investing. This and other information can be found in the Funds’ prospectuses or, if available, the summary prospectuses, which may be obtained by visiting the iShares Fund and BlackRock Fund prospectus pages. Read the prospectus carefully before investing.
Investing involves risk, including possible loss of principal.
The iShares Minimum Volatility Funds may experience more than minimum volatility as there is no guarantee that the underlying index’s strategy of seeking to lower volatility will be successful.
Diversification and asset allocation may not protect against market risk or loss of principal.
Buying and selling shares of ETFs may result in brokerage commissions.
The strategies discussed are strictly for illustrative and educational purposes and are not a recommendation, offer or solicitation to buy or sell any securities or to adopt any investment strategy. There is no guarantee that any strategies discussed will be effective.
The information presented does not take into consideration commissions, tax implications, or other transactions costs, which may significantly affect the economic consequences of a given strategy or investment decision.
This material contains general information only and does not take into account an individual’s financial circumstances. This information should not be relied upon as a primary basis for an investment decision. Rather, an assessment should be made as to whether the information is appropriate in individual circumstances and consideration should be given to talking to a financial professional before making an investment decision.
The information provided is not intended to be tax advice. Investors should be urged to consult their tax professionals or financial professionals for more information regarding their specific tax situations.
The Funds are distributed by BlackRock Investments, LLC (together with its affiliates, “BlackRock”).
The iShares Funds are not sponsored, endorsed, issued, sold or promoted by Bloomberg, BlackRock Index Services, LLC, Cboe Global Indices, LLC, Cohen & Steers, European Public Real Estate Association (“EPRA® ”), FTSE International Limited (“FTSE”), ICE Data Indices, LLC, NSE Indices Ltd, JPMorgan, JPX Group, London Stock Exchange Group (“LSEG”), MSCI Inc., Markit Indices Limited, Morningstar, Inc., Nasdaq, Inc., National Association of Real Estate Investment Trusts (“NAREIT”), Nikkei, Inc., Russell, S&P Dow Jones Indices LLC or STOXX Ltd. None of these companies make any representation regarding the advisability of investing in the Funds. With the exception of BlackRock Index Services, LLC, who is an affiliate, BlackRock Investments, LLC is not affiliated with the companies listed above.
Neither FTSE, LSEG, nor NAREIT makes any warranty regarding the FTSE Nareit Equity REITS Index, FTSE Nareit All Residential Capped Index or FTSE Nareit All Mortgage Capped Index. Neither FTSE, EPRA, LSEG, nor NAREIT makes any warranty regarding the FTSE EPRA Nareit Developed ex-U.S. Index, FTSE EPRA Nareit Developed Green Target Index or FTSE EPRA Nareit Global REITs Index. “FTSE®” is a trademark of London Stock Exchange Group companies and is used by FTSE under license.
©2023 BlackRock, Inc or its affiliates. All Rights Reserved. BLACKROCK, iSHARES, iBONDS, ALADDIN and the iShares Core Graphic are trademarks of BlackRock, Inc. or its affiliates. All other trademarks are those of their respective owners.
iCRMH1022U/S-2419949