

By Chris Hausman, Swan Global Investments
With all of the volatile political events happening domestically and internationally, the low market volatility over the past few years has puzzled investors. Many look at the low VIX and are confused as to why the markets don’t seem to be responding to unsteady current events in a corresponding fashion.
There are many reasons why volatility is low. There are intertwined relationships in the financial markets today, and assessing these relationships can provide a better understanding of volatility within a present and historical context.
Misconceptions about the Volatility and the VIX
Many investors look at volatility and, more specifically, the VIX as indicators of fear in the market. Contrary to popular belief, volatility is not an indication of fear. Volatility is simply the measurement of supply and demand manifested through market participants actively buying and selling.
Unfortunately, the VIX has a reputation that it should accurately measure the risk in the marketplace and serve as a “one-stop-shop” indicator for it. The expectation that the VIX is an actual representation of volatility or risk is inaccurate. Not surprisingly, the reliability of the VIX as a predictor of future market movements has suffered in recent years, and many incorrectly interpret this as if it simply does not work anymore. The VIX is not broken because it continues to measure what it was always designed to measure: the implied volatility of 30-day options in the S&P 500 index.
The VIX merely measures how many investors are buying or selling short-term options and can be used as a barometer for how much portfolio “insurance” is being purchased via SPX options. Insurance can be purchased for protecting downside market movements or upside movements, the latter in an attempt to participate with market gains. Recently, there has been an increase in buyers of upside VIX calls and VIX call spreads. What this means is that portfolio managers are using VIX calls to hedge increases in volatility, and this has had a dampening effect on SPX option volatility.
How Low Is Volatility Really?
Going into the summer of 2017, S&P 500 realized volatility was in the low single-digit percentiles of its distribution range going back nearly 90 years. Measures of S&P 500 short term implied volatility expressed by the VIXIndex in late July 2017 touched an all-time intraday record low of 8.84.
This low volatility environment, however, is nothing new. The VIX experienced low bouts of volatility like this in 2005 and 2006. Volatility cycles between high and low periods, just as all market cycles undergo some degree of change either through external stimuli or evolution.
![]() The daily closing historical average (since 1990) of the VIX has been slowly declining and now stands at 19.4. Since 2003, the VIX has closed below 16.25 approximately 50% of the time, and half of those occurrences have been under 13.2. With this in mind, a VIX in the 12–13 range is not “surprisingly” low.
The daily closing historical average (since 1990) of the VIX has been slowly declining and now stands at 19.4. Since 2003, the VIX has closed below 16.25 approximately 50% of the time, and half of those occurrences have been under 13.2. With this in mind, a VIX in the 12–13 range is not “surprisingly” low.
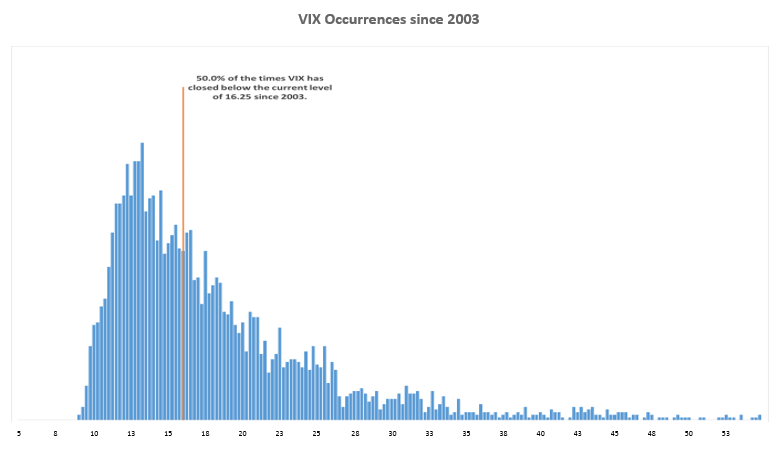
Source: TradeStation, Swan Global Investments
The current streak of no VIX closes above 20 is the third longest in history. The longest one occurred between 2004–2006 and lasted 558 days. Another notable period was between 1991 and 1996 when central banks were also accommodative in a pro-business environment.