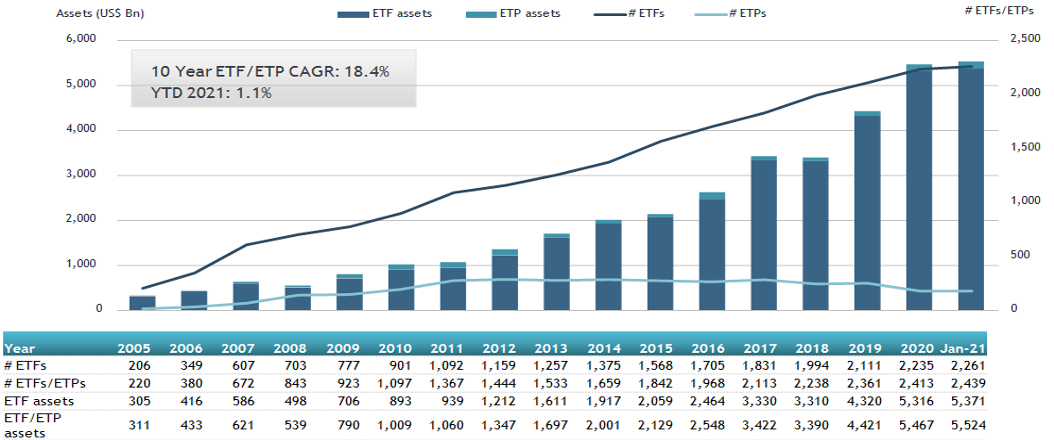
On Tuesday, ETFGI, a leading independent research and consultancy firm covering trends in the global ETFs and ETPs ecosystem, reported that assets invested in ETFs and ETPs listed in the United States reached a new record of $5.52 trillion at the end of January.
$57.23 billion in net inflows was gathered in January, the second-largest net inflows, which is greater than the $41.90 billion in net inflows gathered in 2019 but less than the $75.96 billion gathered in January 2018. Assets increased by 1.1%, from $5.47 trillion at the end of December to $5.52 trillion at the end of January, according to ETFGI’s January 2021 US ETFs and ETPs industry landscape insights report, the monthly report which is part of an annual paid-for research subscription service.
“The S&P 500 posted a loss of 1% for January due to the sell-off during the last week of the month. Small and mid-cap stocks outperformed in January, with the S&P Mid-Cap 400 and the S&P SmallCap 600 up 2% and 6%, respectively. Slower-than-expected COVID-19 vaccine distribution affected global impacted equities globally. The Developed markets ex- the U.S. ended the month down 1% while emerging markets were up 3% for the month,” according to Deborah Fuhr, managing partner, founder, and owner of ETFGI.
Growth in US ETF and ETP assets as of the end of January 2021


The ETFs and ETPs industry in the United States had 2,439 products, assets of $5.52 Trillion, from 180 providers listed on 3 exchanges at the end of January.
In January 2021, ETFs/ETPs gathered net inflows of $57.23 Bn. Equity ETFs/ETPs listed in the US reported net inflows of $26.45 Bn in January, bringing YTD net inflows for 2021 to $26.45 billion, more than the $19.91 Bn in net inflows equity products attracted in January 2020. Fixed income ETFs/ETPs listed in US reported net inflows of $14.70 Bn during January, which is more than the $13.60 Bn in net inflows fixed income products attracted in January 2020. Commodity ETFs/ETPs accumulated net inflows of $461 Mn in January, which is less than the $1.88 Bn gathered in January 2020.
Active ETFs/ETPs saw net inflows of $15.13 Bn during January, significantly more than the net inflows of $5.01 Bn in January 2020.
Substantial inflows can be attributed to the top 20 ETFs by net new assets, which collectively gathered $41.96 Bn during January. The Financial Select Sector SPDR Fund (XLF US) gathered 4.15 Bn.
Top 20 ETFs by net new assets January 2021: US
| Name |
Ticker |
Assets |
NNA |
NNA |
| Financial Select Sector SPDR Fund |
XLF US |
28,331.47 |
4,149.58 |
4,149.58 |
| iShares Core Total USD Bond Market ETF |
9,692.85 |
3,713.58 |
3,713.58 |
|
| iShares MSCI EAFE Value ETF |
10,300.21 |
3,272.99 |
3,272.99 |
|
| iShares Core MSCI Emerging Markets ETF |
73,723.65 |
3,156.00 |
3,156.00 |
|
| ARK Innovation ETF |
22,609.04 |
3,097.15 |
3,097.15 |
|
| Vanguard Total Stock Market ETF |
202,732.92 |
2,824.17 |
2,824.17 |
|
| Vanguard Total Bond Market ETF |
70,221.98 |
2,745.86 |
2,745.86 |
|
| ARK Genomic Revolution Multi-Sector ETF |
10,699.23 |
2,435.05 |
2,435.05 |
|
| iShares Global Clean Energy ETF |
6,538.74 |
1,657.33 |
1,657.33 |
|
| iShares Core U.S. Aggregate Bond ETF |
86,266.80 |
1,594.07 |
1,594.07 |
|
| Vanguard Intermediate-Term Corporate Bond ETF |
43,754.05 |
1,567.31 |
1,567.31 |
|
| Vanguard S&P 500 ETF |
177,910.66 |
1,558.20 |
1,558.20 |
|
| Vanguard Total International Bond ETF |
38,400.91 |
1,404.03 |
1,404.03 |
|
| JPMorgan BetaBuilders Developed Asia EX-Japan ETF |
3,076.13 |
1,336.48 |
1,336.48 |
|
| Vanguard Short-Term Bond ETF |
30,812.70 |
1,298.87 |
1,298.87 |
|
| Vanguard Small-Cap ETF |
39,541.92 |
1,291.66 |
1,291.66 |
|
| JPMorgan BetaBuilders Japan ETF |
7,456.86 |
1,282.46 |
1,282.46 |
|
| Energy Select Sector SPDR Fund |
15,393.63 |
1,229.03 |
1,229.03 |
|
| SPDR Dow Jones Industrial Average ETF |
24,986.09 |
1,173.08 |
1,173.08 |
|
| Vanguard Value ETF |
62,137.88 |
1,171.41 |
1,171.41 |

The top 10 ETPs by net new assets collectively gathered $2.23 Bn during January. The iShares Silver Trust (SLV US) gathered $1.18 Bn.
Top 10 ETPs by net new assets January 2021: US
| Name |
Ticker |
Assets |
NNA |
NNA |
| iShares Silver Trust |
SLV US |
16,496.27 |
1,181.76 |
1,181.76 |
| ProShares Ultra VIX Short-Term Futures |
UVXY US |
22,45.30 |
273.75 |
273.75 |
| SPDR Gold MiniShares Trust |
GLDM US |
41,44.47 |
186.45 |
186.45 |
| iPath Series B S&P 500 VIX Short-Term Futures ETN |
VXX US |
1,421.30 |
172.83 |
172.83 |
| iShares Gold Trust |
IAU US |
31,561.48 |
117.32 |
117.32 |
| ProShares VIX Short-Term Futures ETF |
VIXY US |
483.78 |
81.98 |
81.98 |
| Aberdeen Standard Physical Silver Shares |
SIVR US |
975.87 |
74.67 |
74.67 |
| iShares S&P GSCI Commodity-Indexed Trust |
GSG US |
922.35 |
55.32 |
55.32 |
| iPath Shiller CAPE ETN |
CAPE US |
315.75 |
42.83 |
42.83 |
| Invesco DB Agriculture Fund |
DBA US |
700.87 |
42.25 |
42.25 |

Investors have tended to invest in Equity ETFs/ETPs during January.
Register now for the ETFGI Global ETFs Global Summit on ESG and Active ETFs Trends, March 24th & 25th Register Here.
For more market trends, visit ETF Trends.
