

By Marc Odo, Swan Global Investments
The objective of this ongoing educational series of blog posts is to sort through, explain, and organize all of the various performance metrics that are available to the financial analyst, but most investors really want just two things:
- They want their wealth to appreciate at a rapid rate
- They do not want to deviate from that path of wealth appreciation
Luckily, there’s a ratio for that: Zephyr K-Ratio[1]. This ratio measures the consistency of wealth creation over time.
The Steeper the Slope, The Faster the Climb
Let’s begin with an illustration to help understand this new metric.
Below we see a cumulative return graph for the S&P 500 over the last 20 years[2]. Superimposed over the actual data is a straight, best-fit line.
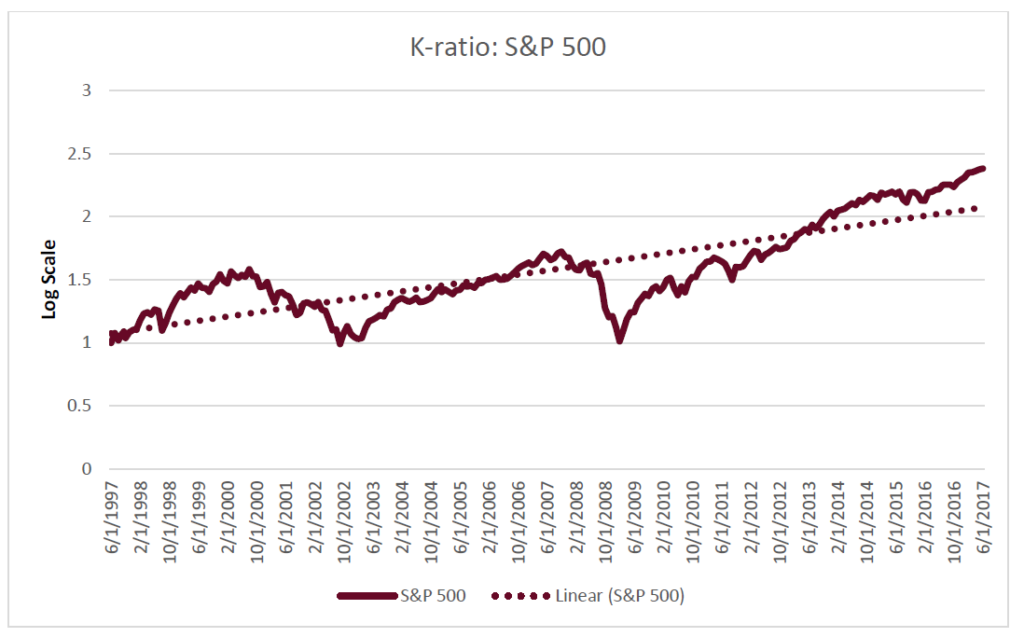
Source: Zephyr StyleADVISOR, Swan Global Investments.
The slope of the line is the return measure, so the steeper the slope of that line, the better. A steeper slope indicates a more rapid pace of wealth appreciation.
Obviously in real life the path of wealth appreciation is not a straight line. There are many ups and downs along the way. However, a straight line of wealth appreciation can be thought of as an ideal. If an investment offered a consistent rate of
wealth appreciation with no deviations on a month-to-month or year-to-year basis, it would likely find an enthusiastic pool of investors.
Calculating & Evaluating the Zephyr K-Ratio
The K-ratio is the slope of the best-fit line that measures capital appreciation divided by the standard error of the mean, which it uses as its measure of risk.
The standard error of the mean is subtly but importantly different than the standard deviation used in most performance and risk statistics. While standard deviation measures how much individual observations of data tend to be dispersed from the mean value, standard error of the mean is a test of the mean itself—it is a way to indicate how precise or accurate a mean value is.
Using the standard error of the mean as a measure of risk allows us to see just how closely an actual return pattern matches that idealized straight line. The smaller the standard error of the mean, the closer the actual return series is to the idealized straight line. Conversely, a large standard error of the mean indicates that the actual path the investment takes meanders far and wide off the straight line.