
Many investors utilize the yield curve shape as an indicator of economic conditions. The relationship between short-term and long-term rates offer valuable insights of the market participants aggregate assessment of expected market risk and return for various horizons. It is often mentioned by financial pundits that prior to each of the last 5 U.S. recessions, the yield curve inverted. Thus, it is tempting to interpret this week’s 2-year/10-year yield curve inversion as a reliable recession signal. However, that reasoning is bluntly incorrect. Over the last 40 years, the yield curve has inverted approximately 30 times and, in most cases, it has taken many years from the moment of a first inversion to the start of a recession. As for equity performance, historically, U.S. equity markets have continued to rally for years after an initial yield curve inversion. Hence, the yield curve offers no useful information to predict the timing of a recession or an equity pullback. That said, we believe the current geopolitical environment is poised to slow global growth and create increased equity market volatility, but with the current strong economy, we don’t foresee a U.S. recession coming within the next twelve months.
Under normal conditions, investors demand a premium to hold long-term bonds over short-term bonds (“term premium”). The term premium is intuitive in the sense that investors are being compensated for undertaking additional risk. However, when investors are worried about the future, they tend to increase their purchases of long-term bonds. That buying activity pushes long-term bond prices up and yields down. And in extreme cases, long-term rates fall to the point where the term premium becomes negative. Over the last 40 years, the yield spread between constant maturity 10-Year and 2-Year treasuries has turned negative roughly dozens of times prior, during, and after recessions. During the same period, the average time between an initial yield curve inversion and the start of the next recession has been 20 months, with a wide range of 9 to 34 months. Therefore, there is no reliable relationship between the time lag (or number) of yield curve inversions and the starts or end of a recession. Furthermore, the average U.S. equity markets performance from an initial yield curve inversion to the following market peak preceding the recession is over 30%. This indicates that there is an opportunity for plenty of equity upside even after the yield curve inverts.
A recession is defined as “a significant decline in economic activity spread across the economy, lasting more than a few months, normally visible in real GDP, real income, employment, industrial production, and wholesale-retail sales.” Currently, none of those variables show signs of significant deterioration. In fact, some variables indicate that the economy, albeit slowing, is in the best shape in decades (e.g., employment). However, geopolitical factors, such as the trade war with China and its impact on global growth, can have serious consequences for equity markets. We expect increased market volatility and a possibly a correction in U.S. equity markets in short order, but we don’t foresee a U.S. recession coming in the next 12 months. Thus, we remain cautiously optimistic about equity markets and welcome volatility as an investment opportunity rather than a threat.
The Innealta Dynamic portfolios utilize a proprietary three-lenses approach (i.e., fundamental, macroeconomic, and behavioral) to evaluate the risk-reward potential across different asset classes, regions, and sectors. We believe that data-driven decisions have the potential to improve investment decision-making and ultimately outcomes. For more information about our market views, commentaries, and investment solutions, please contact us at [email protected].
[1] The National Bureau of Economic Research (NBER)
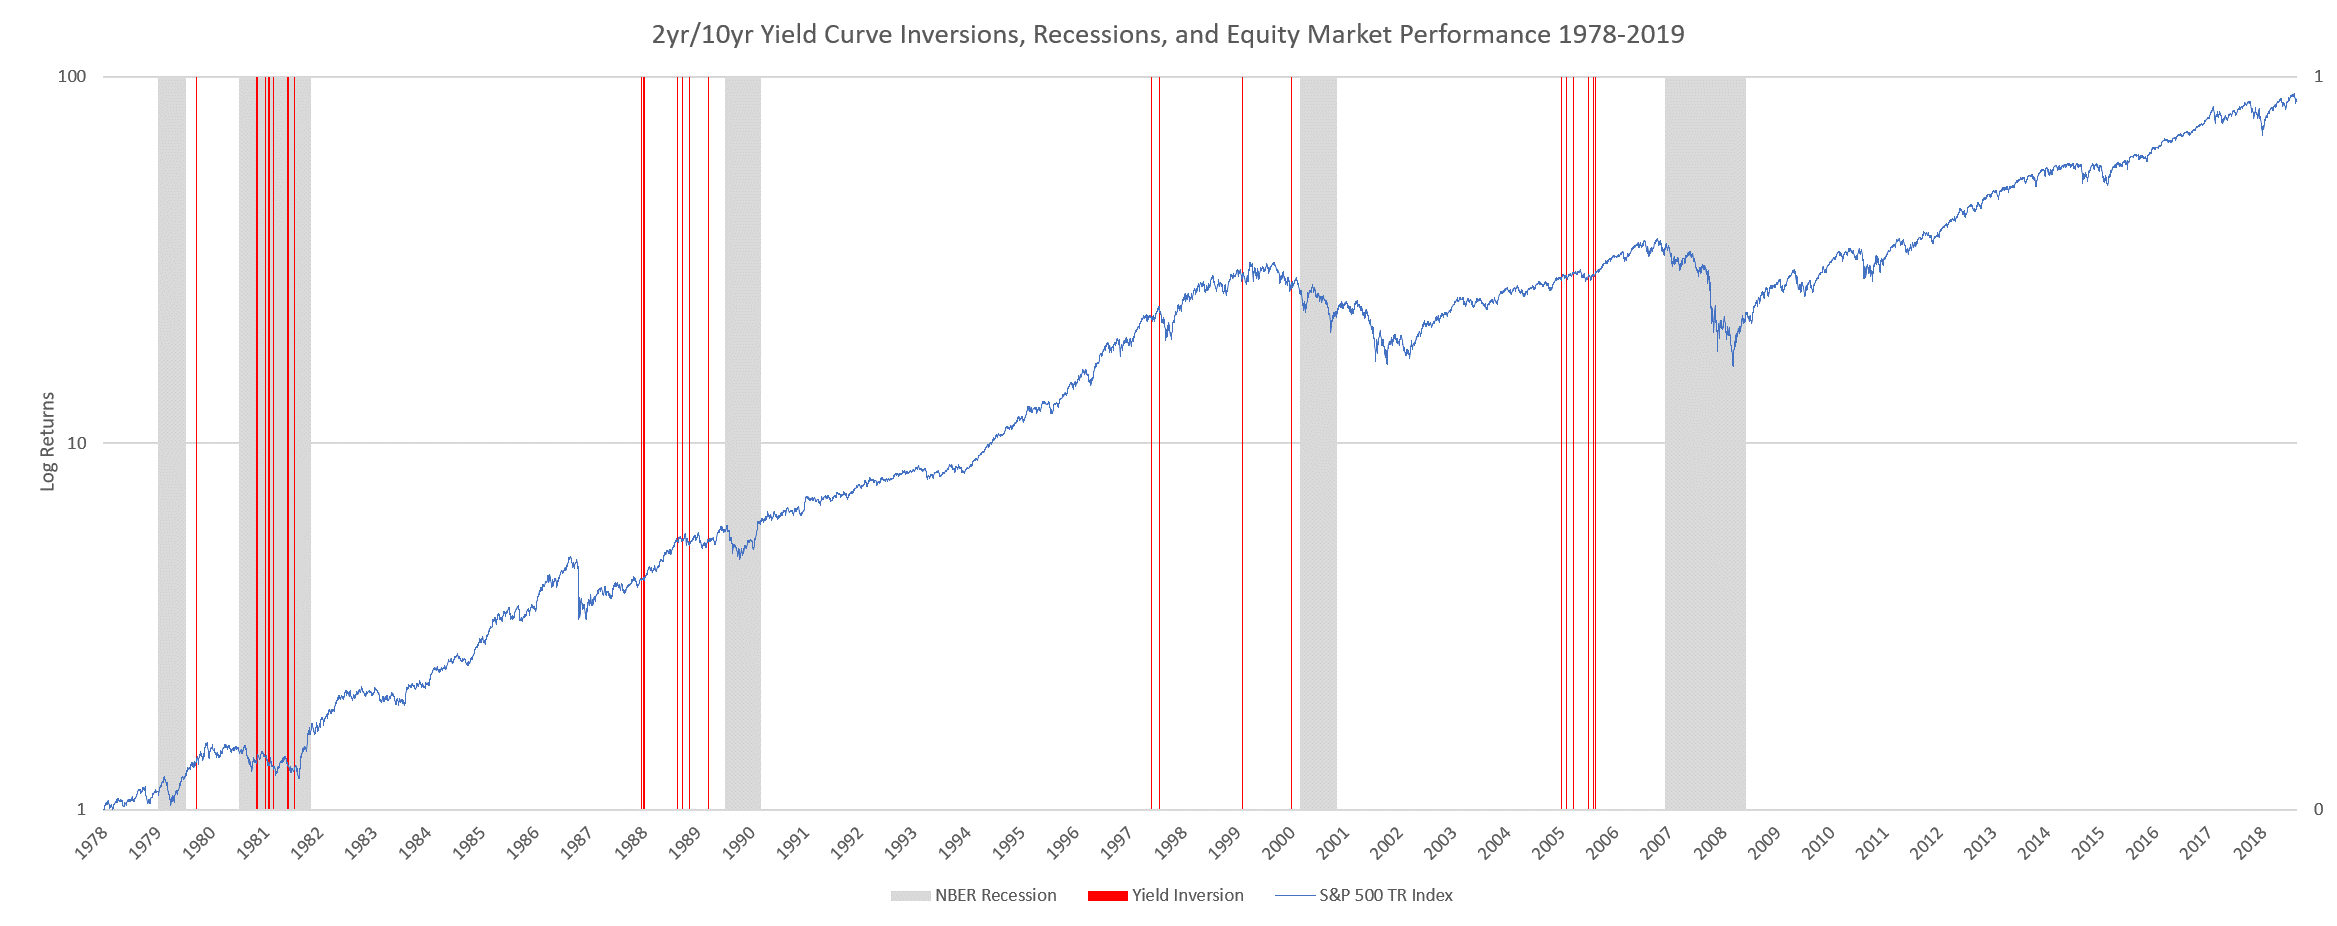
Figure: Source Innealta Capital using daily data from 12/31/1979 to 08/14/2019 from Federal Reserve Bank of St. Louis, National Bureau of Economic Research (NBER), and Bloomberg.
The S&P 500 Index is a diversified large cap U.S. index that holds companies across all eleven GICS sectors.
This material is for informational purposes and is intended to be used for educational and illustrative purposes only. It is not designed to cover every aspect of the relevant markets and is not intended to be used as a general guide to investing or as a source of any specific investment recommendation. It is not intended as an offer or solicitation for the purchase or sale of any financial instrument, investment product or service. This material does not constitute investment advice, nor is it a substitute for such professional advice or services, nor should it be used as a basis for any decision or action that may affect your business. Before making any decision or taking any action that may affect your business, you should consult a qualified professional adviser. In preparing this material we have relied upon data supplied to us by third parties. The information has been compiled from sources believed to be reliable, but no representation or warranty, express or implied, is made by Innealta Capital, LLC as to its accuracy, completeness or correctness. Innealta Capital, LLC does not guarantee that the information supplied is accurate, complete, or timely, or make any warranties with regard to the results obtained from its use. Innealta Capital, LLC has no obligations to update any such information.
Wall Street sign post with American national flags in background by ARTvertize/Shutterstock.com edited by Innealta Capital
293-INN-08/15/2019
