
BCM 4Q19 Market Commentary
By BCM Investment Team
The fourth quarter of 2019 brought the decade to a close in a manner consistent with U.S. investors’ experience during the past ten years. Calming trade tensions propelled the S&P 500 index to a 9.07% total return and 22 new all-time closing highs. Trade tension between the U.S. and China has been one of the largest macroeconomic risk factors hanging over the global economy for the better part of the past two years. Therefore, it’s no surprise that the global equity markets rallied into, and following, the announcement of a “Phase 1” trade deal between the two countries. As the moniker “Phase 1” would suggest, the agreement is a de-escalation as opposed to a resolution, but—semantics aside—it is a welcomed reprieve and seems to be a step in the right direction.
Assuming the trade truce lasts, the next question is whether the expected increase in economic activity—and ultimately corporate earnings—materializes. Corporate earnings markets have high hopes, as judged by the 18x forward earnings multiple that the S&P 500 now trades at. The last time the S&P 500 traded at such a high multiple to forward earnings was before the 2017 Tax Cuts and Jobs Act (TCJA), which increased the index’s earnings by nearly 20% overnight. We believe that companies will have to begin to meet these high expectations before any further material upside in equities occurs.
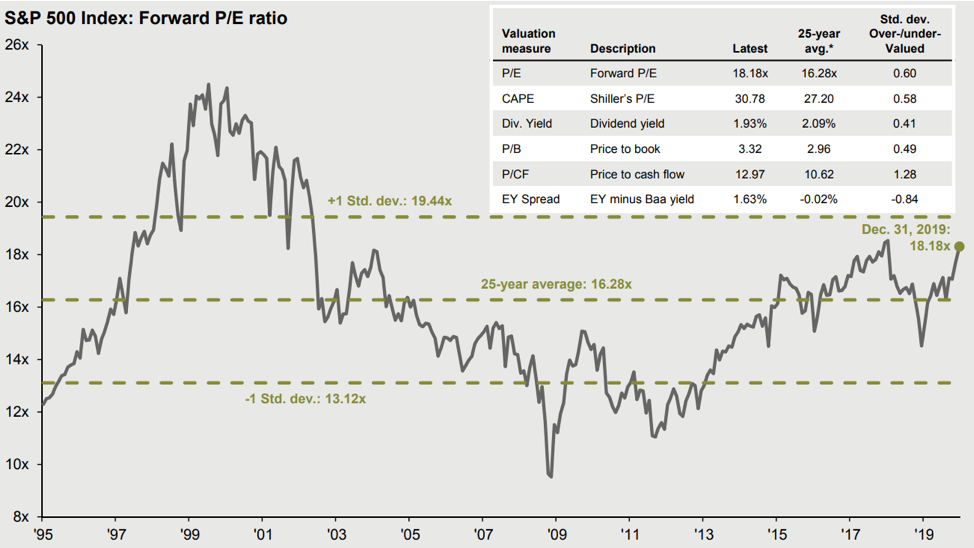
Source: FactSet, FRB, Robert Shiller, Standard & Poor’s, Thomson Reuters, J.P. Morgan Asset Management. Price to earning is price divided by consensus analyst estimates of earning per share for the next 12 months as provided by IBES since January 1995, and FactSet for December 31, 2019. Average P/E and standard deviations are calculated using 25 years of IBES history. Shiller’s P/E uses trailing 10-years of inflation-adjusted earnings as reported by companies. Dividend yield is calculated as the next 12-month consensus dividend divided by most recent price. Price to book ratio is the price divided by book value per share. Price to cash flow is price divided by NTM cash flow. EY minus Baa yield is the forward earnings yield (consensus analyst estimates of EPS over the next 12 months divided by price) minus the Moody’s Baa seasoned corporate bond yield. Std. dev. over-/under-valued is calculated using the average and standard deviation over 25 years for each measure. *P/CF is a 20-year average due to cash flow data availability.
Guide to the Markets – U.S. Data are as of December 31, 2019.
In the past, we’ve used our fourth quarter letter as a chance to take a step back and provide a year-end review. As this year-end also coincides with a more momentous milestone, the conclusion of the decade, we believe it will prove more insightful to focus on that timeframe instead. As the global economy recovered from what is considered the worst economic calamity since the Great Depression, the U.S. economy and—by extension—the S&P 500 proved to be positive outliers in an otherwise sluggish global landscape. For the ten years ending on 12/31/19, the S&P 500 realized a total return of 256.39% compared to total returns of 80.68%, 48.31%, and 44.45% for the EAFE (Europe, Australasia and Far East) Index, MSCI Emerging Markets Index and Bloomberg Barclays U.S. Aggregate Bond Index, respectively.

Source: Bloomberg, Beaumont Capital Management, 12/31/2009 through 12/31/2019. Index returns are gross of fees.
Although, with the benefit of hindsight, it is not surprising that the U.S. has outperformed over the past decade1, it’s worth remembering that the prior decade was nearly a mirror image. From the beginning of 2000 to the end of 2009, of the four indices mentioned above, the S&P 500 produced the worst result. Valuations aside, it would appear that the U.S. has the deck stacked in its favor going into the next decade, but we ask investors to remember the prevailing outlook in 1999 and 2009. Investors may have been skeptical in 1999, but there was little outright pessimism—and pessimism was certainly pervasive in 2009. We’re not suggesting that the next decade will look like any of the decades that preceded it; instead, we’re reminding investors of the wide range of outcomes that are possible. Investors’ expectations tend to anchor to their recent experience, but the future is much more uncertain.

Source: Bloomberg, Beaumont Capital Management, 12/31/1999 through 12/31/2009. Index returns are gross of fees.
BCM’s quantitatively driven rules-based strategies are designed to help investors deal with this uncertainty. We believe that a properly diversified portfolio—one that is robust in the face of an uncertain future—requires diversification among management style as much as, if not more so than, among asset classes. Managers such as BCM, who attempt to adapt your portfolio to the changing market environment, can help your portfolio realize differentiated results over time. In some market environments, such as the past decade, a differentiated and diversified result may reduce absolute portfolio performance, but no manager can allocate with the benefit of hindsight. Instead, we must invest for a wide range of future outcomes with the confidence that our portfolio will prove robust under whatever circumstances the future may bring.
Before we conclude, we’d also like to provide an update on the progress that we’ve made as a business over the past decade. This past year, BCM celebrated its tenth birthday and we’ve come a long way over those ten years. We’ve grown from nothing more than a hobby to an asset management firm with a national presence and 24 full-time positions. While we believe that our success suggests that there is demand in the market for strategies like ours, we recognize that we could never have come this far without clients who understand and value the investment attributes that we are attempting to provide.
As always, we thank you for your confidence and for your business.
This article was contributed by Dave Haviland, Portfolio Manager at Beaumont Capital Management, a participant in the ETF Strategist Channel.
For more insights like these, visit BCM’s blog at blog.investbcm.com.
Disclosures:
[1] Where do we begin. The Federal Reserve recapitalized the banking system, the shale revolution, biotechnology, consumer technology, etc. While it’s easy to argue about other actions that Congress could have taken, the only major error, that we’ll likely all agree on, is the lack of a material infrastructure program.
Copyright © 2020 Beaumont Capital Management LLC. All rights reserved.
All materials appearing in this commentary are protected by copyright as a collective work or compilation under U.S. copyright laws and are the property of Beaumont Capital Management. You may not copy, reproduce, publish, use, create derivative works, transmit, sell or in any way exploit any content, in whole or in part, in this commentary without express permission from Beaumont Capital Management.
Past performance is no guarantee of future results. Index performance is shown on a gross basis and an investment cannot be made directly in an index. The performance of any ETFs, as contributors or detractors to the strategy, are provided on a gross basis. An Exchange Traded Fund (ETF) is a security that tracks an index, a commodity or a basket of assets like an index fund, but trades like a stock on an exchange. ETFs experience price changes throughout the day as they are bought and sold. All BCM strategies invest only in long-only ETFs.
This material is provided for informational purposes only and does not in any sense constitute a solicitation or offer for the purchase or sale of a specific security or other investment options, nor does it constitute investment advice for any person. The material may contain forward or backward-looking statements regarding intent, beliefs regarding current or past expectations. The views expressed are also subject to change based on market and other conditions. The information presented in this report is based on data obtained from third party sources. Although it is believed to be accurate, no representation or warranty is made as to its accuracy or completeness.
As with all investments, there are associated inherent risks including loss of principal. Stock markets, especially foreign markets, are volatile and can decline significantly in response to adverse issuer, political, regulatory, market, or economic developments. Sector and factor investments concentrate in a particular industry, and the investments’ performance could depend heavily on the performance of that industry and be more volatile than the performance of less concentrated investment options and the market as a whole. Securities of companies with smaller market capitalizations tend to be more volatile and less liquid than larger company stocks. Foreign markets, particularly emerging markets, can be more volatile than U.S. markets due to increased political, regulatory, social or economic uncertainties. Fixed Income investments have exposure to credit, interest rate, market, and inflation risk.
Diversification does not ensure a profit or guarantee against a loss.
The Standard & Poor’s (S&P) 500® Index is an unmanaged index that tracks the performance of 500 widely held, large-capitalization U.S. stocks. Indices are not managed and do not incur fees or expenses. The S&P Small Cap 600® Index is an unmanaged index that tracks the performance of 600 widely held, small-capitalization U.S. stocks. The MSCI World Index is a free float-adjusted market capitalization weighted index that is designed to measure the equity market performance of developed markets. The MSCI World ex-U.S. Index is a free float-adjusted market capitalization weighted index that is designed to measure the equity market performance of developed markets, excluding the United States. The MSCI ACWI Index captures large and mid-cap representation across 23 Developed Markets and 26 Emerging Markets countries. The MSCI ACWI Index ex-U.S. captures large and mid-cap representation across 22 Developed Markets and 26 Emerging Markets countries, excluding the United States. The Bloomberg Barclay’s U.S. Aggregate Bond Index is a broad base index and is often used to represent investment grade bonds being traded in the United States.
“S&P 500®”, and “S&P Small Cap 600®” are registered trademarks of Standard & Poor’s, Inc., a division of S&P Global, Inc. MSCI® is the trademark of MSCI Inc. and/or its subsidiaries.
The BCM investment strategies may not be appropriate for everyone. Due to the periodic rebalancing nature of our strategies, they may not be appropriate for those investors who desire regular withdrawals or frequent deposits.
For Investment Professional use with clients, not for independent distribution.
Please contact your BCM Regional Consultant for more information or to address any questions that you may have.
Beaumont Capital Management was originally created in 2009 as a separate division of Beaumont Financial Partners, LLC. Beaumont Capital Management LLC spun off as its own entity as of 1/2/2020. Beaumont Financial Partners, LLC was originally registered as Beaumont Trust Associates in 1981 and was reorganized into Beaumont Financial Partners, LLC in 1999.
Beaumont Capital Management LLC. 75 2nd Ave, Suite 700, Needham, MA 02494 (844-401-7699)
