
Last Week’s Macro Data:
- PCE (Personal Consumption Expenditure) data eased in February and almost all measures came in lower than forecasts, suggesting inflation has cooled:
- Headline PCE Deflator rose 5.0% YoY, slightly below the 5.1% consensus and down from January’s 5.3% measure. It increased 0.3% MoM, printing closely in line with expectations and cooling from the prior month’s 0.6% gain.
- Core PCE Deflator was up 4.6% YoY, slightly softer than both the estimate and January’s 4.7% reading. It gained 0.3% MoM, less than the 0.4% forecast and easing from the previous month’s 0.5% rise.
- Personal Spending increased 0.2% MoM, dropping from January’s 2.0% gain. Personal Income was up 0.3% MoM, also easing from the prior month’s 0.6% gain.

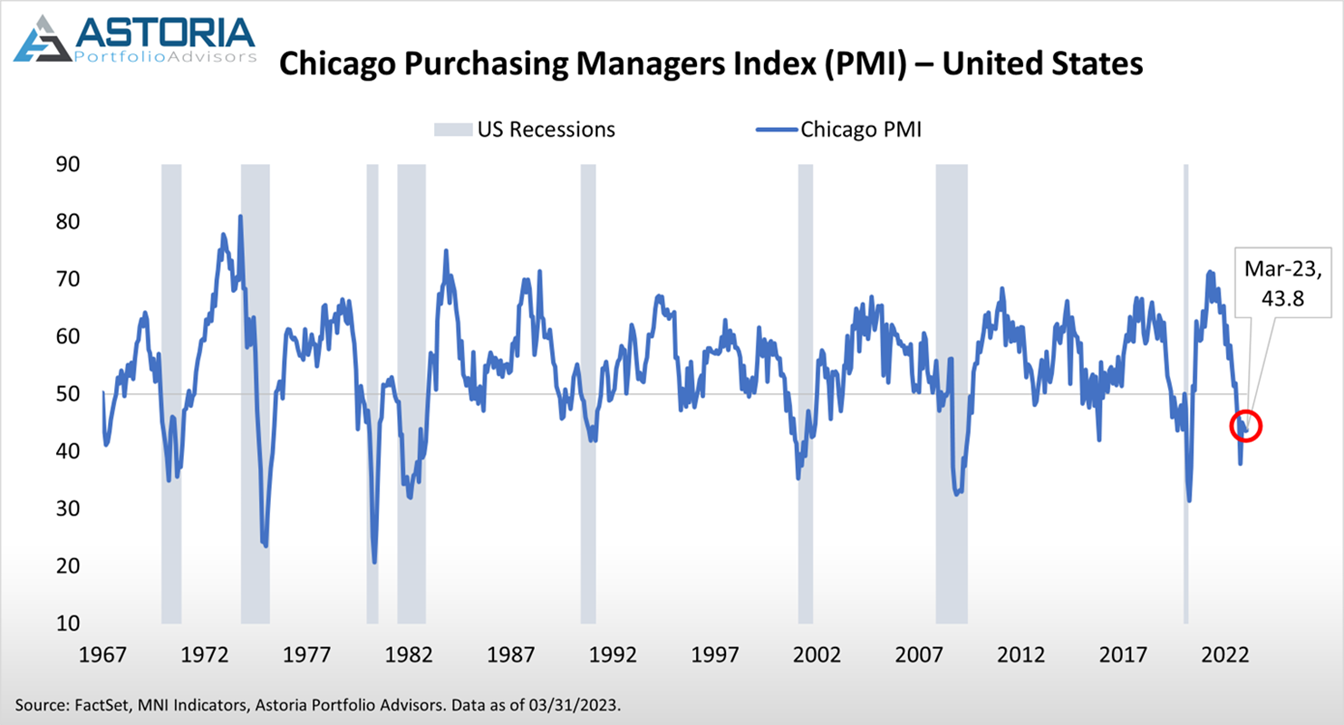
- The Chicago PMI registered 43.8 in March, slightly beating both the forecast and February’s reading of 43.6. However, the measure remains below 50, signaling contraction in the Chicago region for the seventh straight month.
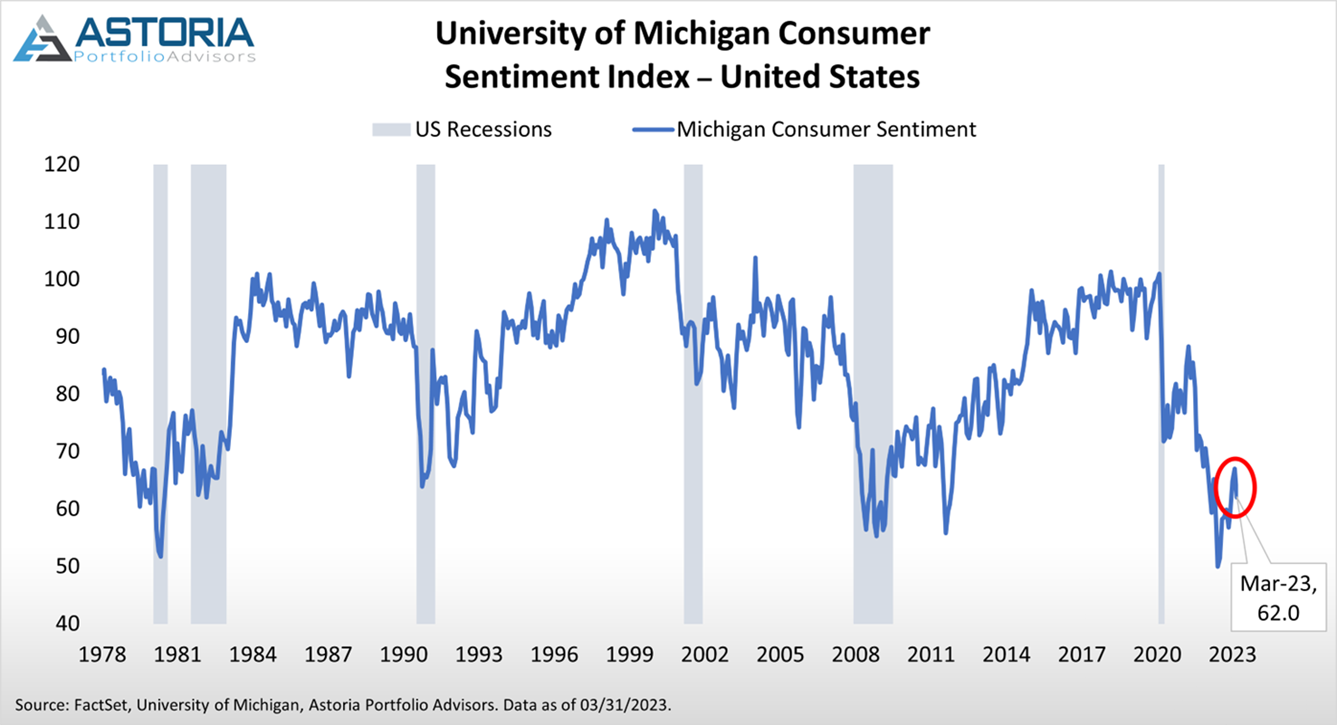
- The Michigan Consumer Sentiment Index (final) printed 62.0 in March, down slightly from the 63.4 preliminary and missing the original consensus of 67.0. It also fell from the previous month’s 67.0 reading, suggesting consumers are pessimistic regarding the health of the economy.
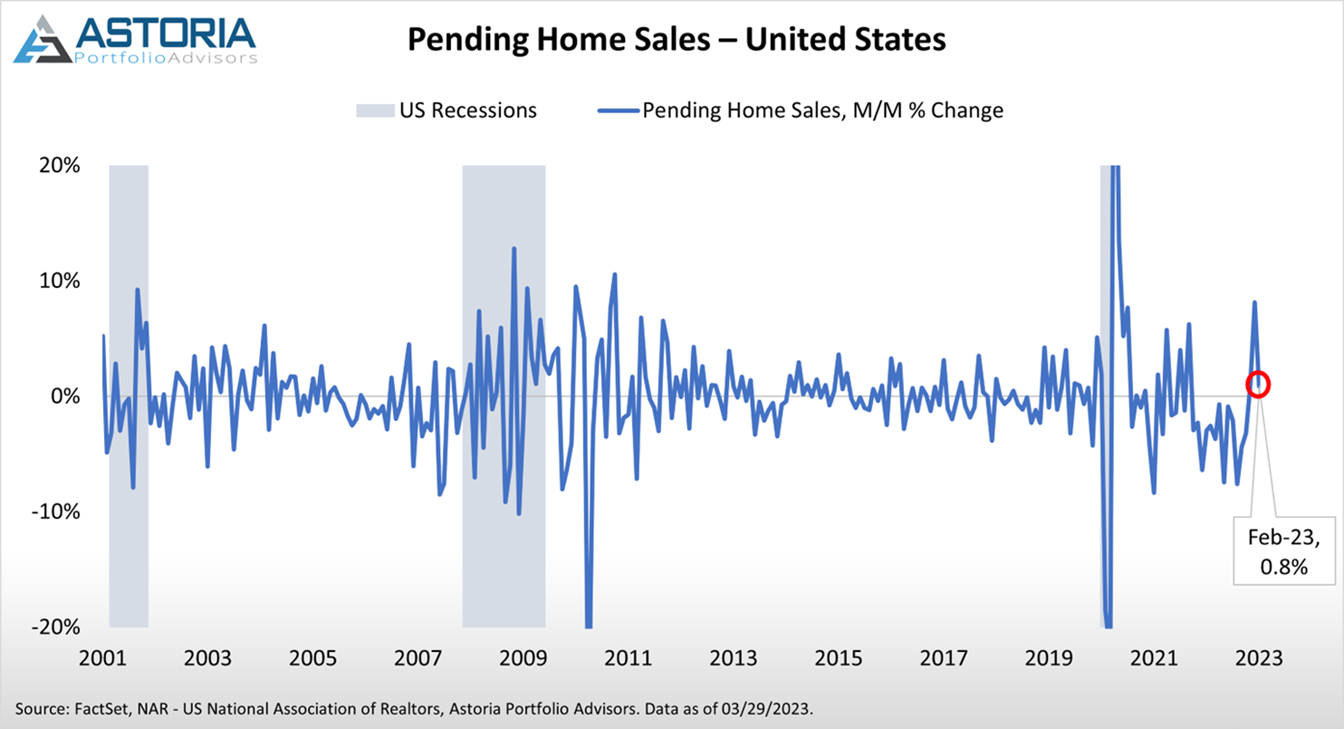
- Pending Home Sales increased 0.8% MoM in February, exceeding the forecasted 3.0% decline but down notably from January’s 8.1% rise. Despite this third consecutive monthly gain, suggests higher mortgage rates may be pressuring the housing market’s recovery.
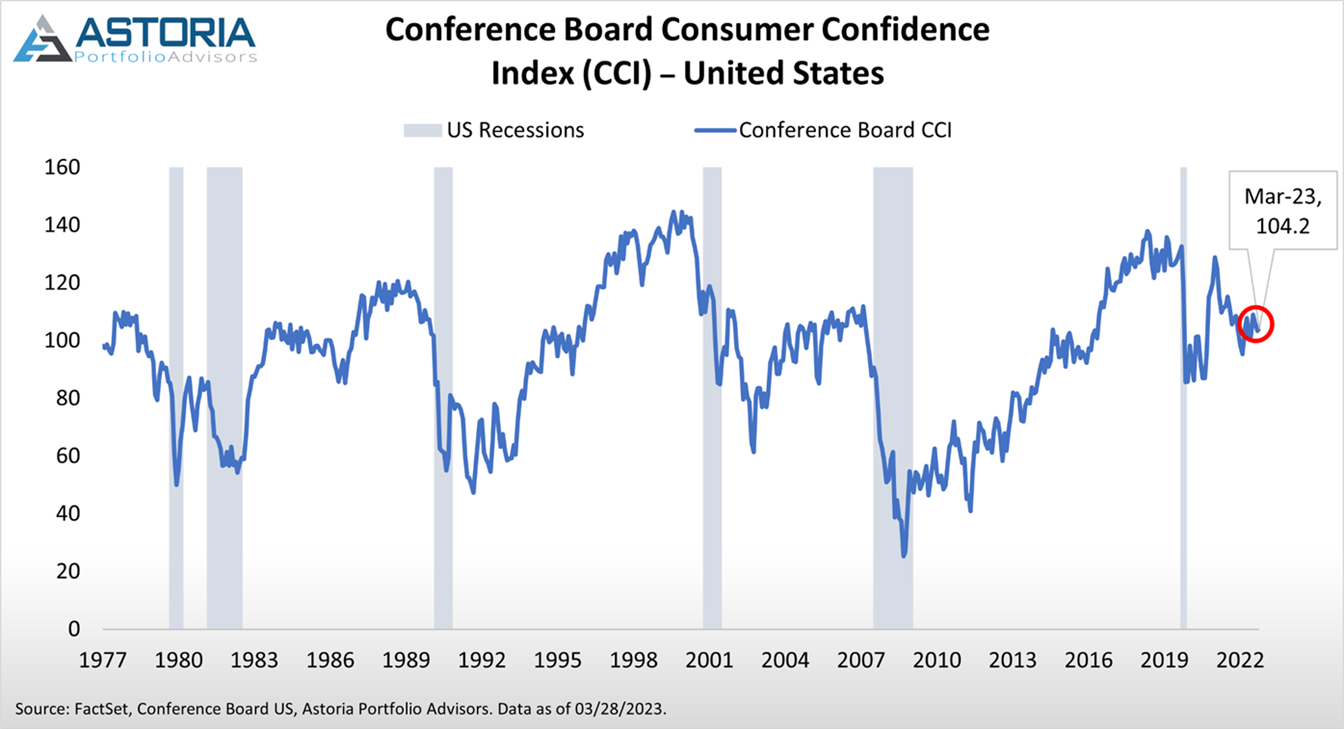
- The Conference Board Consumer Confidence Index came in at 104.2 for March, beating the expected 100.9 and up slightly from the prior month’s 103.4. Indicates consumer views on current and short term business/labor conditions have slightly improved.
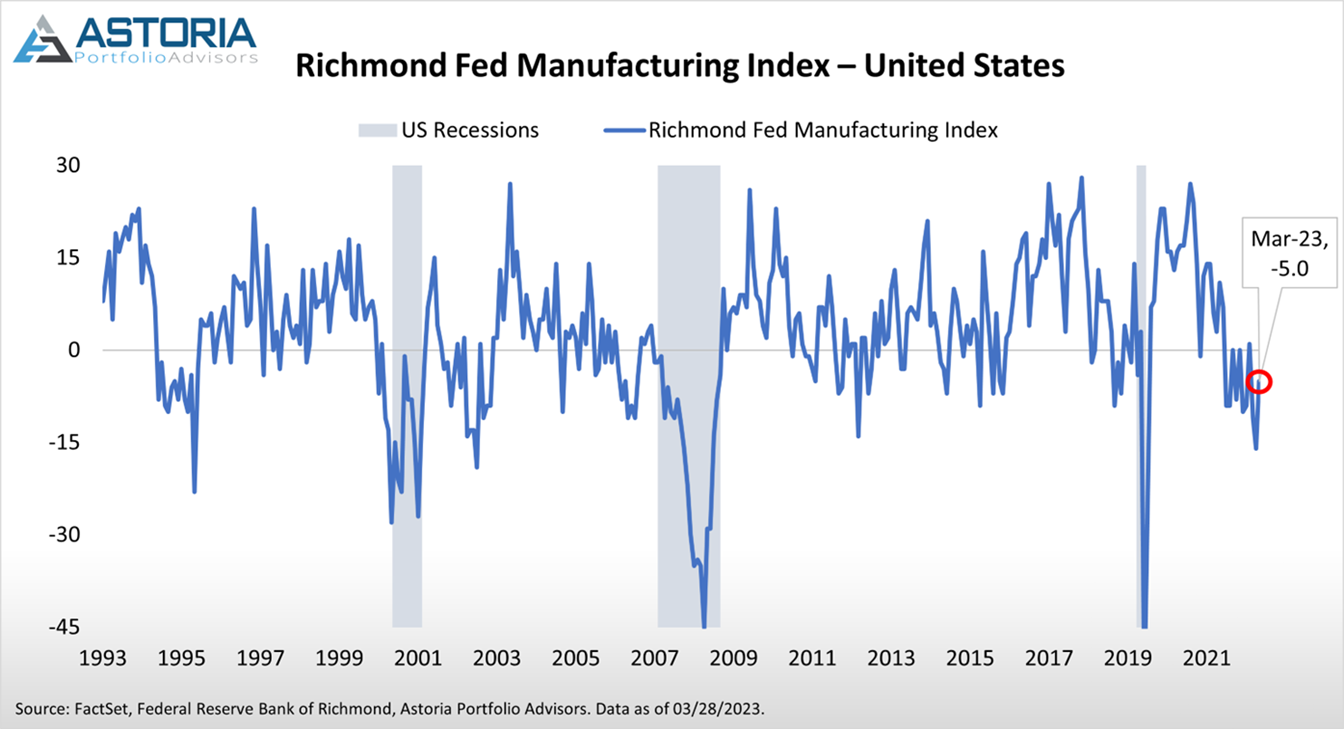
- The Richmond Fed Manufacturing Index printed -5.0 in March, ahead of the -8.0 consensus and rising from February’s -16.0. Still in negative territory, but signals improving factory activity in the Fifth Federal Reserve District relative to the previous month. Also marks the first increase since December 2022.
- The Dallas Fed Manufacturing Index came in at -15.7 in March, missing the consensus of -11.5 and down from the previous month’s -13.5. Suggests factory activity in Texas continues to decline.

Friday’s (3/24/2023) Update:
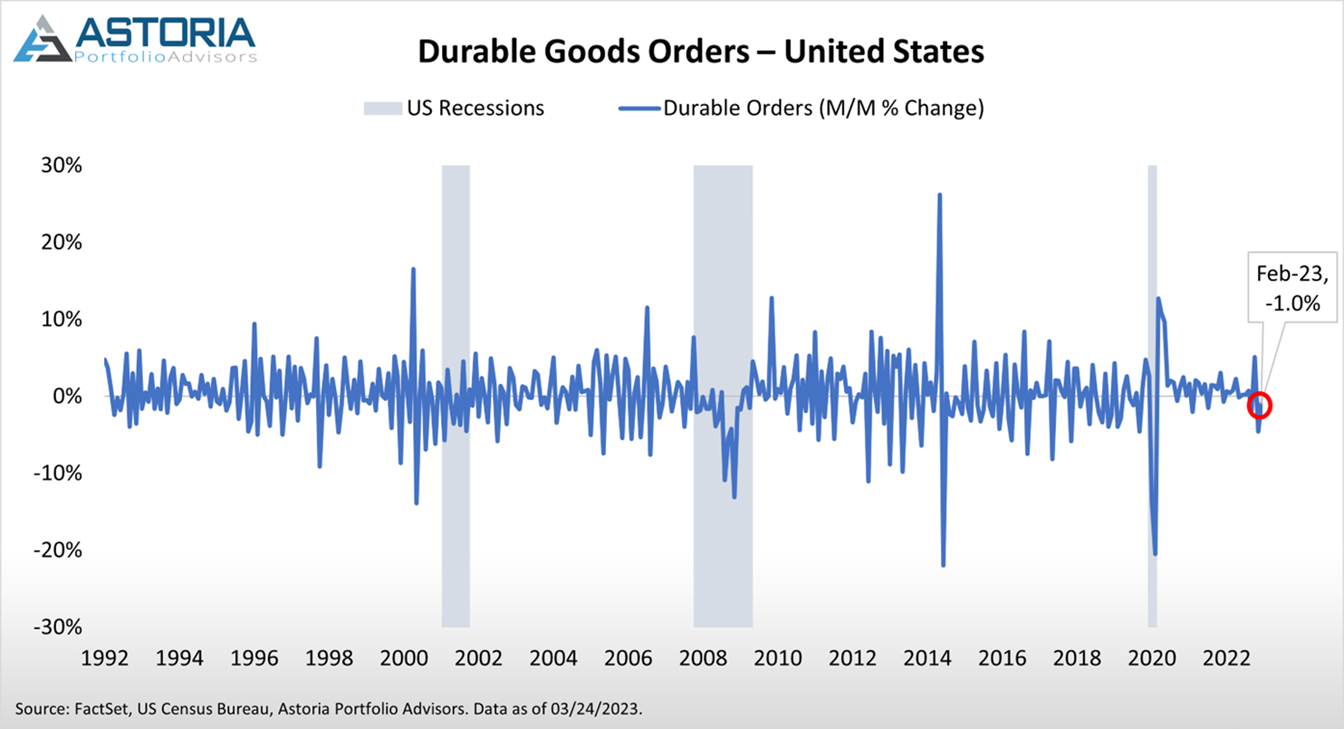
- Durable Goods Orders (preliminary) decreased 1.0% MoM in February, missing the predicted 1.0% increase but up from the prior month’s 5.0% drop. Signals economic weakness as demand for goods continued to decrease, though contraction eased relative to January.
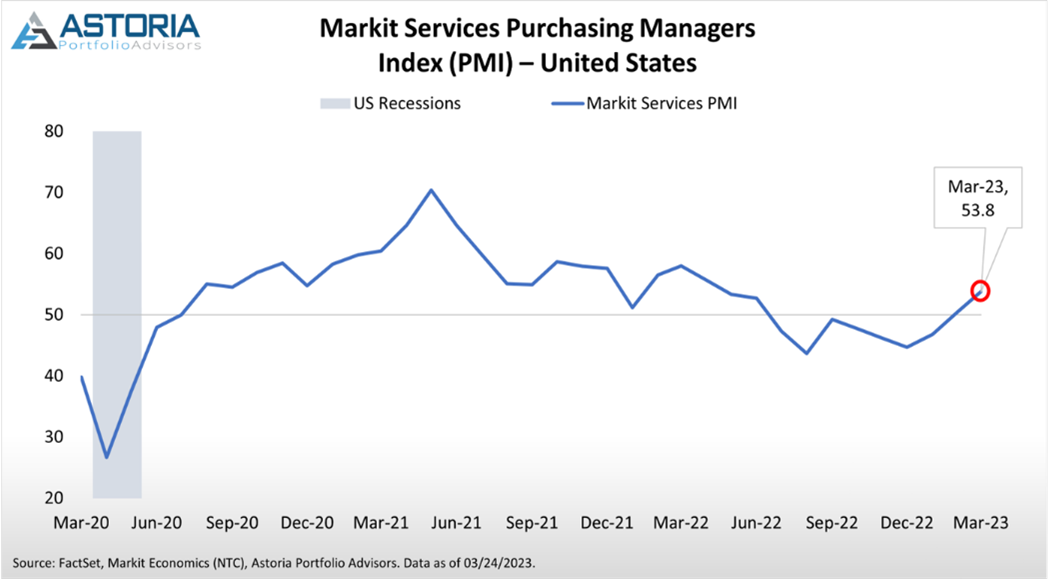
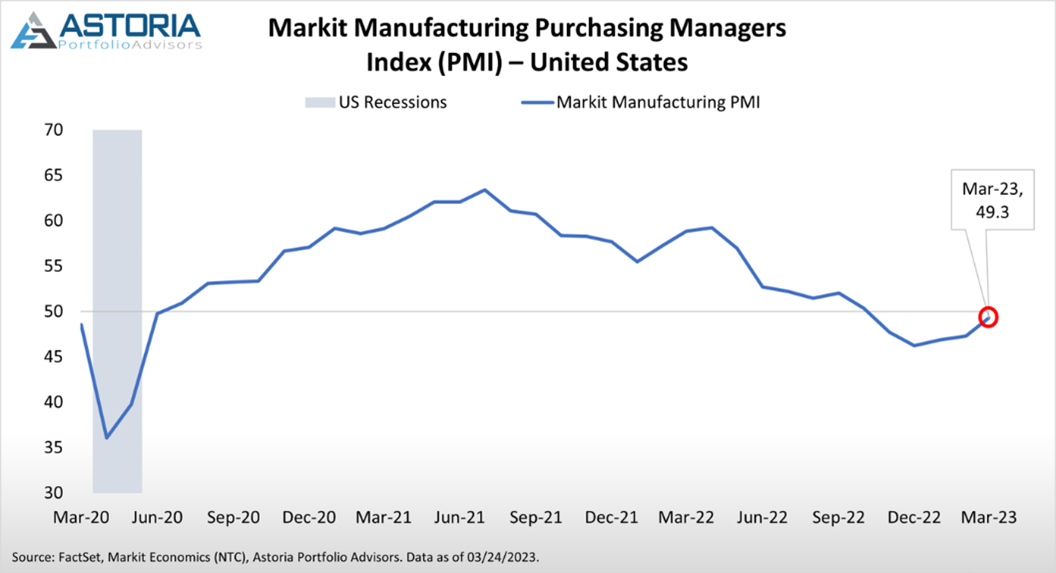
- Both Markit PMIs (preliminary) beat expectations in March, suggesting strengthening in the manufacturing and servicing sectors of the economy. However, Markit Manufacturing PMI still lies in contractionary territory:
- Markit Manufacturing PMI (preliminary) printed 49.3, coming in above the 47.2 estimate and upwards of February’s 47.3 reading.
- Markit Services PMI (preliminary) registered 53.8, exceeding the 50.3 forecast and improving from the previous month’s 50.6 measure.
Additional Content:
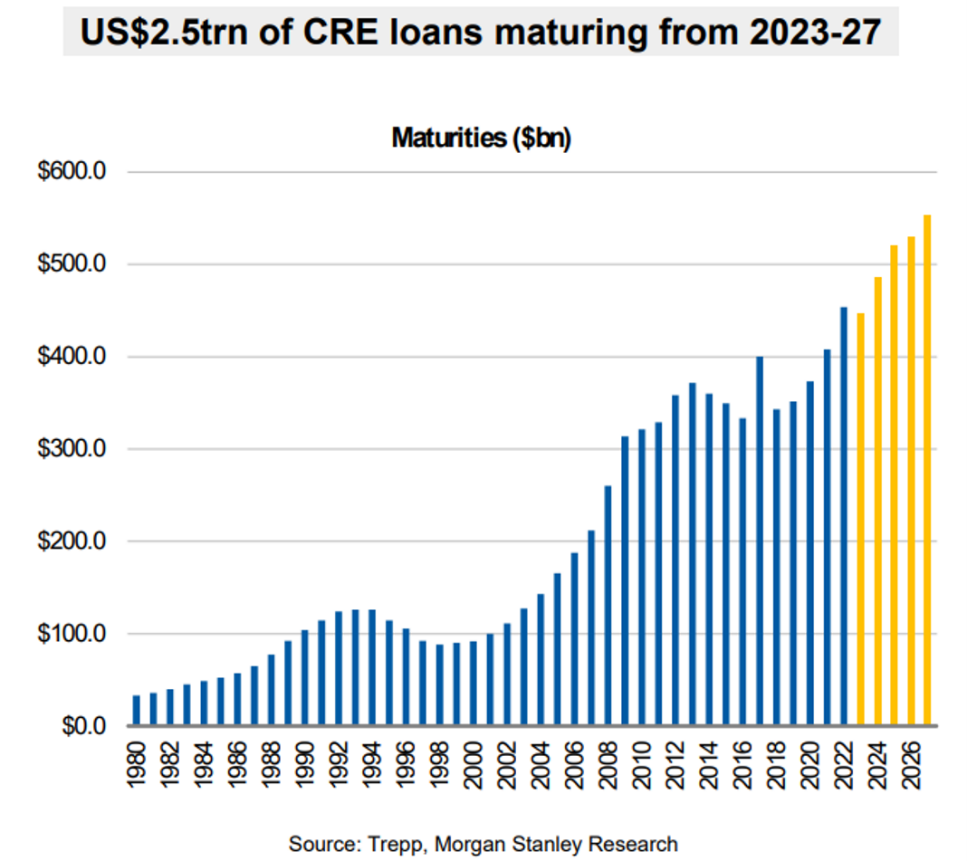
- Will commercial real estate (CRE) be the next shoe to drop? Post pandemic, commercial real estate demand has decreased as work from home has gained popularity and property valuations have lowered. Moreover, vast amounts of existing CRE loans were financed when interest rates were near zero, and $2.5 trillion of these loans are maturing over the next 5 years. These will have to be refinanced in an environment of substantially higher rates and tighter lending standards, potentially leading to defaults and losses to banks. Given approximately 70% of total CRE loan exposure is held by small to mid-sized banks, could potential losses absorbed by these banks pose a larger threat to the economy?
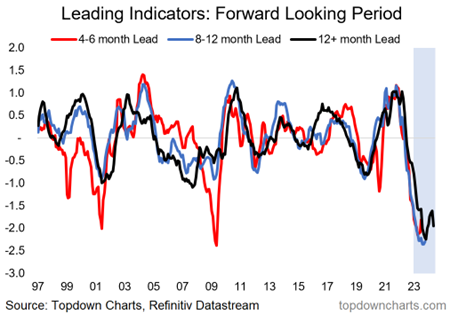
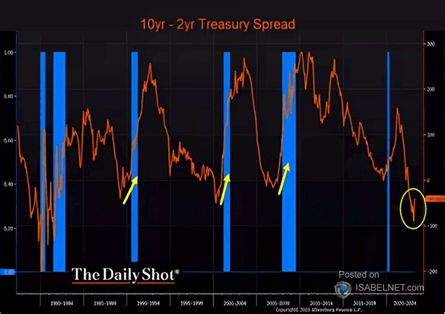
- According to Topdown Charts, 4-6 month, 8-12 month, and 12+ month leading indicators are all signaling a recession. Additionally, rate volatility has recently hit levels last seen in 2008 and the 2-year US Treasury yield has fallen sharply, causing the 2s10s Treasury yield curve to re-steepen from its trough. Such a move in yields has historically occurred just before economic slowdowns. Does this suggest the US is closer to the pending recession?
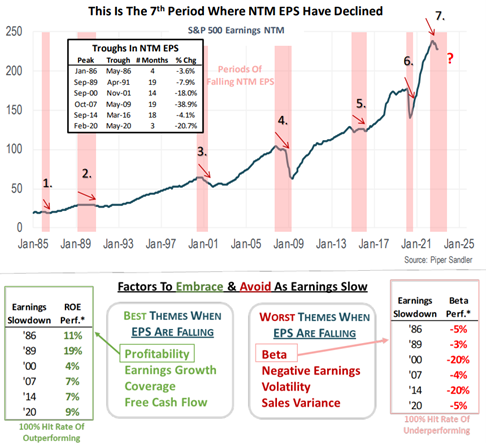
- Across the 6 earnings downturns that have occurred since 1985, companies with higher profitability, strong earnings growth, attractive interest coverage ratios, and above average free cash flows have historically outperformed. As next twelve months earnings estimates for the S&P 500 have turned negative, these metrics and factors suggest now may be an appropriate time to increase exposure to high quality stocks.
Best,
Nick
For more news, information, and analysis, visit the ETF Strategist Channel.
Past performance is not indicative of future performance. Any third-party websites provided on www.astoriaadvisors.com are strictly for informational purposes and for convenience. These third-party websites are publicly available and do not belong to Astoria Portfolio Advisors LLC. We do not administer the content or control it. We cannot be held liable for the accuracy, time-sensitive nature, or viability of any information shown on these sites. The material in these links is not intended to be relied upon as a forecast or investment advice by Astoria Portfolio Advisors LLC and does not constitute a recommendation, offer, or solicitation for any security or investment strategy. The appearance of such third-party material on our website does not imply our endorsement of the third-party website. We are not responsible for your use of the linked site or its content. Once you leave Astoria Portfolio Advisors LLC’s website, you will be subject to the terms of use and privacy policies of the third-party website. Refer here for more details.
Photo Source: Astoria Portfolio Advisors
