
- We believe return enhancements and diversification are the main reasons investors seek out alternative assets and investment strategies
- We believe traditional asset classes exposure through conventional asset allocation methods do not offer exposure to alternative risk premia
- Our research suggests there are diversification benefits from macro investing due to utilizing more flexible investment mandates to access a broad range of asset classes and exposures
WHAT IS MACRO INVESTING
We spend a lot of time at Astor talking about Macroeconomics and the discipline of macro-style investing. Founded by Rob Stein on a philosophy that macro inputs are key to determining risk asset price direction, Astor has managed strategies with macro variables as the key input for nearly 20 years. This includes multi-asset, sector rotation, income and pure alternative products. Prior to Astor, our portfolio managers held positions managing quantitative macro funds, large bank currency trading, equity option trading, and as Federal Reserve analysts.
Macro investing is an investment discipline that can utilize a myriad of approaches, with long and short positions across a broad range of asset classes, to implement an investment thesis. The process that informs this thesis can be a discretionary macroeconomic view (ie; inflation, oil price supply/demand). It can also be determined by data analysis between the relationship of asset prices (ie; spreads, currency values), typically referred to as quantitative global macro. Our CIO of Astor said in a recent blog:
“Macro strategies, in my mind, are the purest of alternative products – able to go anywhere and do anything in a quest for returns for investors.” – John Eckstein
Investors have loads of options when it comes to passive equity and fixed income market exposure, all over the world. We believe these should be the core of every investor’s portfolio. But markets experience volatility, and each investor’s needs are unique throughout their investing lifecycle. Creating a durable portfolio requires a solid core but also solutions that can add additional value over time. In this write up, we will discuss the attributes that we think make Macro investing attractive.
WHY MACRO NOW
At any given point in market and economic cycles, there are issues that investors must contend with that require a change in outlook. Occasionally there are more extenuating problems, like the tech bubble in 2000-01 and the financial crisis in 2007-08 that ask more from investors. The global pandemic of 2020 presented as idiosyncratic a problem as investors have ever faced. Markets have by and large recovered as the global economy continues to mend. The current environment presents structural concerns that investors and asset allocators must contend with.
Traditional portfolio allocations of equities and bonds run the risk of not providing adequate return to investors over the coming years. We believe the combination of historically low yields and fairly-priced equity markets suggest returns may be hard to come by, at least if historical averages hold true. Capital Market Assumptions have declined in recent years, forecasting lower than average public investment returns. Yields are a big factor in this forecast. As we evolve from the worst of the pandemic, a new variable with potential risks has entered the conversation: inflation. The economic acceleration in 2021 combined with higher prices and structural employment issues, may challenge that ‘status quo’. While some inflationary pressure is welcome, higher levels of unexpected inflation could force the Fed to switch gears on asset purchases and other accommodative policies
that have helped the economy (and equity markets) in recent years. Investors have not had to model for this in some time, which could impact portfolio outcomes and positioning.
Inflation or not, market dynamics have evolved in the past year. A post-pandemic economic acceleration is a probable outcome, but that will not come without its challenges, as discussed. A goldilocks scenario of low rates with strong equities is possible, but we feel that is not the base-case scenario at this point.
THE USE CASE
Understanding how macro strategies arrive at their outcome helps to support their use case in an overall portfolio. Long exposure to traditional asset classes like equities and fixed income are what most investors know. They come with certain risk and return profiles. But they are just that: long exposure to a given risk premium. With the flexibility to take different, directional investment positions, macro strategies can take an active outright exposure to a theme. They can also hedge the risk to existing positions if warranted. In the case of equity
markets, for instance, a macro strategy can hedge by reducing, taking off or going short the equities to mitigate this market specific risk. Another example is inflation. A macro strategy could hypothetically be long oil as commodity prices rise, while also being short U.S. Treasuries in expectation of rising yields.
While a macro investing approach certainly can lead to taking long equity asset class exposure, we believe the investing approach tends to lead to lower correlation over time to equities and even fixed income. Correlation is the first point of reference when evaluating diversification and alternatives options. The alternative’s universe is made up of passive assets and active strategies, of which Macro investing is a type. Alternative assets and strategies can have a lower correlation to equity and fixed income assets, to provide a diversification benefit to traditional portfolio allocations.

The above table is a simplified illustration of the relationship amongst various asset classes. For the purpose of illustration through the rest of the paper, we will be using the HFRI Macro (Total) Index as representative of global macro investing strategies. This is an index of investment managers that utilize a common thematic strategy of global macro investing. The index includes managers that use both systematic and/or discretionary approaches to investing in broad financial instruments, with the common theme of how macroeconomic data will impacts asset prices.
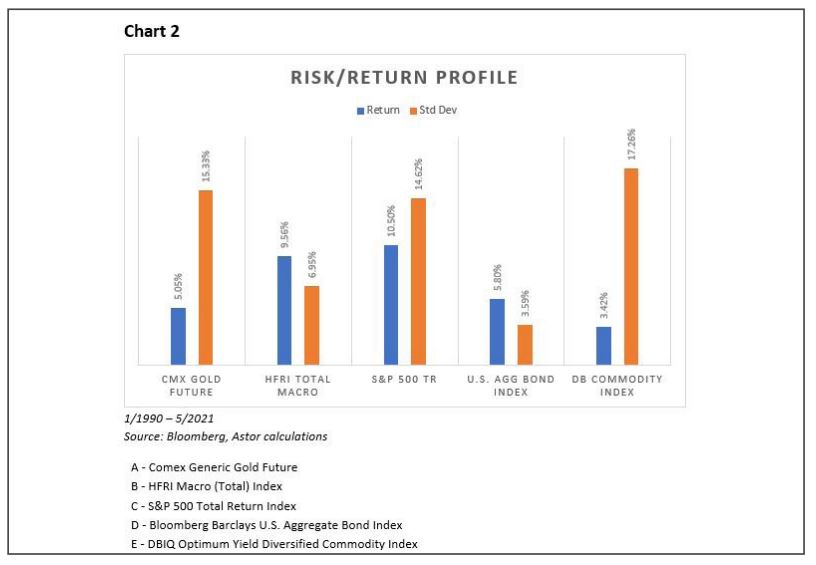
The S&P 500 and the U.S. Agg Bond Index represent traditionally utilized asset allocation tools. Gold futures and the DB Commodity Index represent alternative assets that can provide passive alternative risk premia. The HFRI Macro (Total) Index represents an aggregation of macro-focused investment styles, also designed to expose investors to a unique alternative risk premia compared to traditional assets.
Chart 2 below illustrates the return and risk profile of these investments. As is no surprise, high quality bonds (U.S. Agg Bond) offer an attractive risk profile, which along with a stable yield attracts many risk-minded investors and has offered good diversification through its low correlation to equity markets. In recent years, public equity markets have offered the most attractive return, creating an opportunity cost for allocating to other asset classes. However, we can see below that over a longer time period, other assets can offer a reasonable return, with some having greater risk-adjusted returns than public equity markets, while providing solid correlation benefits to traditional asset allocation.
As yields have declined, individual and institutional investors alike added risk to their portfolios by ‘yield reaching’, increasing the portfolio correlation to risk-based events. As a result, traditional asset allocation may only go so far in times of market stress. We believe investors can benefit from alternative risk premia in their portfolio that at times have lower correlations to traditional equities and fixed income.
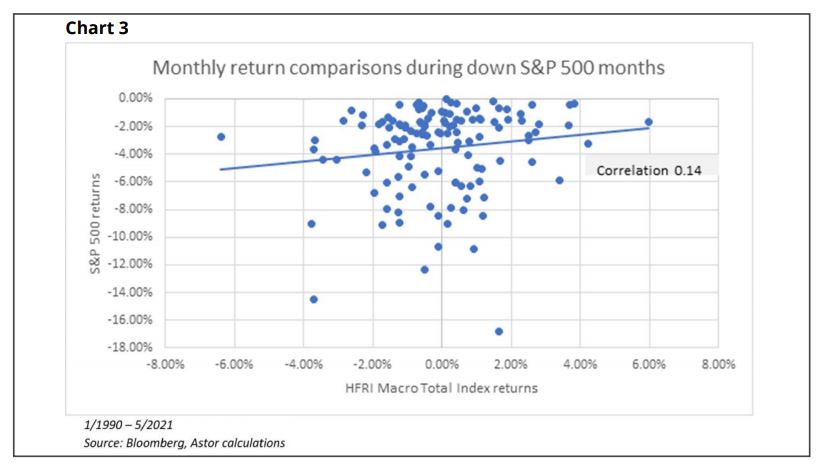
Looking back to chart 1, we see the HFRI Macro (Total) Index has a 0.32 correlation to the S&P 500 over the past 30 years. While positive, these assets certainly do not display a strong tendency to move together. We broke the data sample down further to analyze how they behave in down months for the S&P 500. When constructing portfolios, it’s important to see how assets behave in periods when risk increases to understand the true behavior.
- In months when the S&P 500 posted a negative return, the correlation between the HFRI Macro (Total) Index and the S&P 500 fell to 0.14 (see the scatter plot in chart 3).
- The average return for the HFRI Macro (Total) Index in these down months was -0.08%, compared to -3.62% for the S&P 500.
There is no guarantee that these relationships persist moving forward, but it does demonstrate an independence between the two indexes. This is an important characteristic when looking at investments to diversify a portfolio.
A correlation data point provides a snapshot of a relationship. It’s a good reference point, but it doesn’t exactly tell you what the path looked like getting there. If we had the luxury of closing the time capsule and coming back in 20 or 30 years, only the result matters. Unfortunately, financial needs and other decision points can occur along the way. The journey itself is important. In the chart below, we took the analysis a step further and observed how the correlation itself moved over the 30-year period.
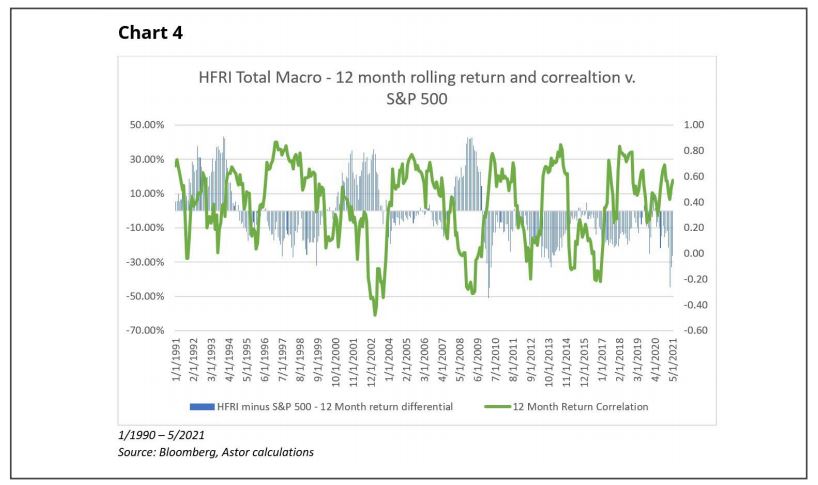
We also looked at the performance spread of the HFRI Macro (Total) Index against the S&P 500 Index and found some interesting results. In periods where correlation declined, the HFRI Macro (Total) Index showed periods of outperformance.
- While the correlation coefficient between the indexes was 0.32 over the period, the rolling 12-month correlation between the indexes was as high as 0.85 and as low as -0.50.
- This tells us there were 12-month periods where the S&P 500 Index and the HFRI Macro (Total) Index had negative correlation, which typically occurred when the HFRI Macro (Total) Index outperformed the S&P 500 Index over the given period.
SUMMARY DISCUSSION
Portfolio diversification is an oft-pursued process, many times with sub-optimal outcomes. The marketplace has created numerous tools to help diversify company idiosyncratic risk, namely index investment through funds. Systemic risk, however, appears to catch investors off-guard. The reason? As we mentioned before, correlations are a snapshot of a relationship, but don’t represent best and worst-case moments in that relationship. When systemic market risk begins to increase, such as Feb/Mar of 2020, asset correlations have a tendency to increase as investors seek liquidity and sell assets somewhat indiscriminately. What this means is that assets with lower correlations to equities, such as gold and other commodities, tend to see their diversification
benefits fade at the most inopportune times. We think a flexible macro-investing approach can identify this dynamic change and adjust exposure accordingly. We think of research supports this idea of macro investing having correlation benefits in periods where equity markets are challenged.
DISCLOSURES
Astor Investment Management LLC (“Astor”) is a registered investment adviser with the Securities and Exchange Commission. This is not a solicitation to offer investment advice or services in any state where to do so would be unlawful. Analysis and research are provided for informational purposes only, not for trading or investing purposes. All opinions expressed are as of the date of publication and subject to change. They are not intended as investment recommendations. These materials contain general information and have not been tailored for any specific recipient. Astor and its affiliates are not liable for the accuracy, usefulness, or availability of any such information or liable for any trading or investing based on such information. There is no assurance that Astor’s investment programs will produce profitable returns or that any account will have similar results. You may lose money. Past results are no guarantee of future results and no representation is made that a client will or is likely
to achieve results that are similar to those shown. Any particular client may experience results different from other clients. Factors impacting client returns, results, and allocations include account inception, money transfers, client-imposed restrictions, strategy and product selection, fees and expenses, and broker/dealer selection, as well as other factors. An investment cannot be made directly into an index. Please refer to Astor’s Form ADV Part 2A Brochure for additional information regarding fees, risks, and services.
DEFINITIONS
Bloomberg Barclays US Aggregate Bond Index: The Bloomberg Barclays U.S. Aggregate Bond Index is a broad-based index representing the dollardenominated, investment grade bond market and includes Treasuries,
government securities, and mortgage securities.
COMEX Gold Futures: A contract for 100 troy ounces of gold bullion traded on the COMEX exchange through the Chicago Mercantile Exchange. Statistics shown here are calculated using the front month contract. Commodity: An investment in physical commodities such as precious metals, agriculture crops, livestock, and energy sources or a futures contract for these assets.
Correlation: A statistical measure of the interdependence of two or more random variables, computed using monthly returns. Fundamentally, the value indicates how much of a change in one variable is explained by a
change in another. Specifically, the correlation between the portfolio and the S&P 500 Index. A correlation of 1 implies the security moves in the same direction as the index and a correlation of -1 implies the opposite. A
correlation closer to 0 indicates that the portfolio does not move with the movements of the index.
DBIQ Optimum Yield Diversified Commodity Index: The DBIQ Optimum Yield Diversified Commodity Index is an index that tracks a portfolio of 14 physical commodities and is rebalanced annually to pre-determined base weights. The Index is managed by DWS Investment Management Americas Inc. with licensing from Deutsche Bank AG.
HFRI Macro (Total) Index: The index performance is rebalanced monthly and calculated net of all fees. The HFRI Macro (Total) Index is an unmanaged, equal-weighted composite of funds listed in the HFR Database having
either $50 million or greater in assets or a 12-month track record. HFRI is a registered trademark of Hedge Fund Research, Inc. An investment cannot be made directly into an index.
Risk Premium: The excess return of an investment asset over a risk-free rate of return.
Rolling Calculations: Refers to calculations where each data point is calculated by summing a set interval of past data points (e.g.36 month rolling calculation would consist of 36 months of data at each point).
Standard Deviation: A measure of the degree of variation of returns around the mean (average) return. The higher the volatility of the investment returns, the higher the standard deviation.
Standard & Poor’s 500 Total Return Index: The S&P 500 Index measures the performance of 500 large cap stocks, which together represent approximately 80% of the total equities market in the United States. The
total return calculation includes the price-plus-gross cash dividend return. The S&P 500 is registered trademark of McGraw Hill Financial.
Yield: The income return on an investment.
