
By Nottingham Advisors
The Fed’s “transitory” inflation thesis was put to the test once again in September as August data continued to flow in pointing to measurably higher prices across the product and service spectrum. While shying away from setting a precise time horizon for softening prices, Fed Chair Powell has repeatedly suggested that price increases should soon begin abating. A lot rests on when exactly that time is, as many price moves appear to be stickier than once thought.
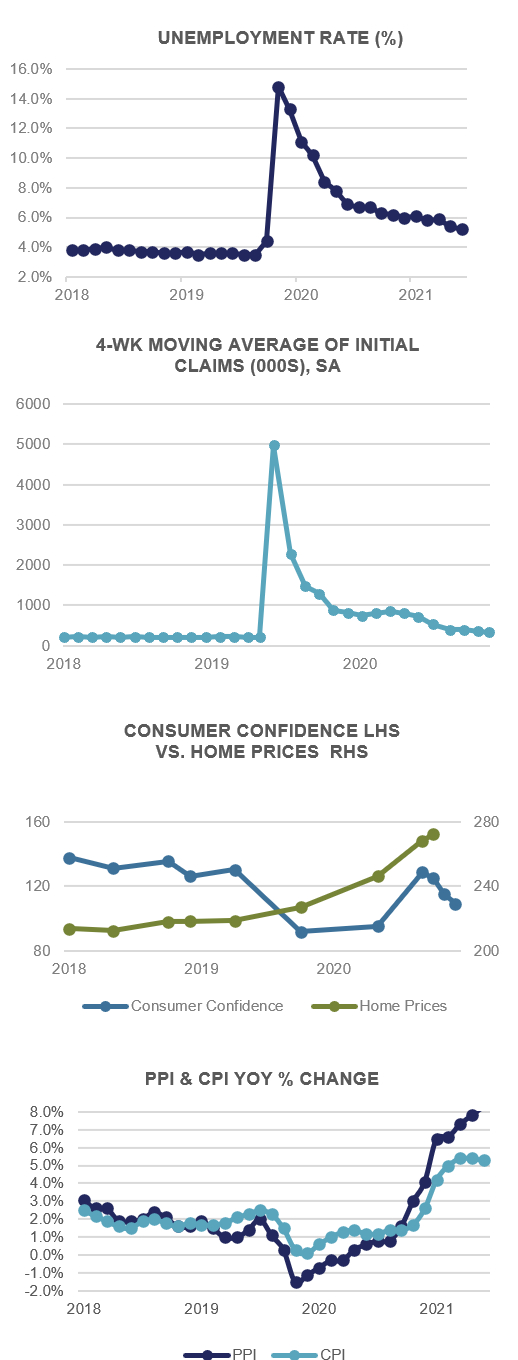
Consumer prices rose +0.3% MoM and +5.3% YoY in August, while at the wholesale level, PPI surged +0.7% MoM and +8.3% YoY. The Fed’s favored inflation measure, the PCE Deflator rose +0.4% MoM and +4.3% YoY in August, well ahead of their target range of plus or minus +2.0%. Perhaps tellingly, Personal Income rose just +0.2% during the period while Personal Spending jumped +0.8% – a case of too many dollars chasing still too few goods.
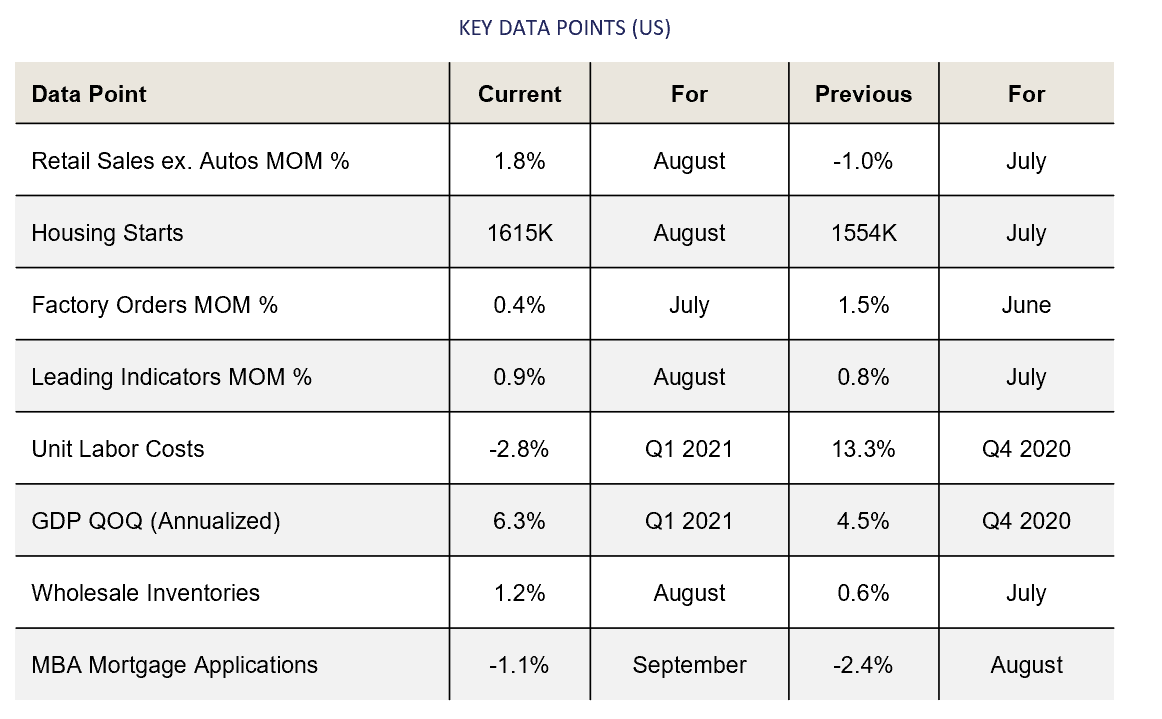
Perhaps nowhere has the jump in prices been more evident (or painful to first-time home buyers) than in the housing market. For the year ending July 31st, the S&P CoreLogic CS 20 City home price index rose +19.95%, following a +1.55% jump on the month alone. Housing Starts in August rose +3.9% while Pending Home Sales leapt +8.1%. There remains a fundamental supply and demand mismatch in the housing market that is not easily or rapidly fixable. Even with the recent move higher in mortgage rates, demand should remain strong over the foreseeable future.
As for the stickiness of recent price increases, the labor market will be a key barometer. As the Unemployment Rate for August dropped to 5.2%, Average Hourly Earnings jumped by +0.6% MoM and are now up +4.3% YoY. $15 per hour has widely been adopted as a base level wage for low-skilled and seasonal labor, including fast-food restaurants and much of the travel and leisure space. Wage increases are notoriously tricky to roll back once in place.
As we’ve suggested in prior Market Wraps, a lot depends on the nature of the “transitory” argument. Searches for the term “stagflation” are on the rise (coincident with gas prices north of $4 per gallon) and echoes of the 1970’s are being heard, albeit under vastly different circumstances. The Fed can only hope we see some relief in near-term prices or bond investors will begin demanding a much higher inflation premium than is being priced in now.
Domestic Equity
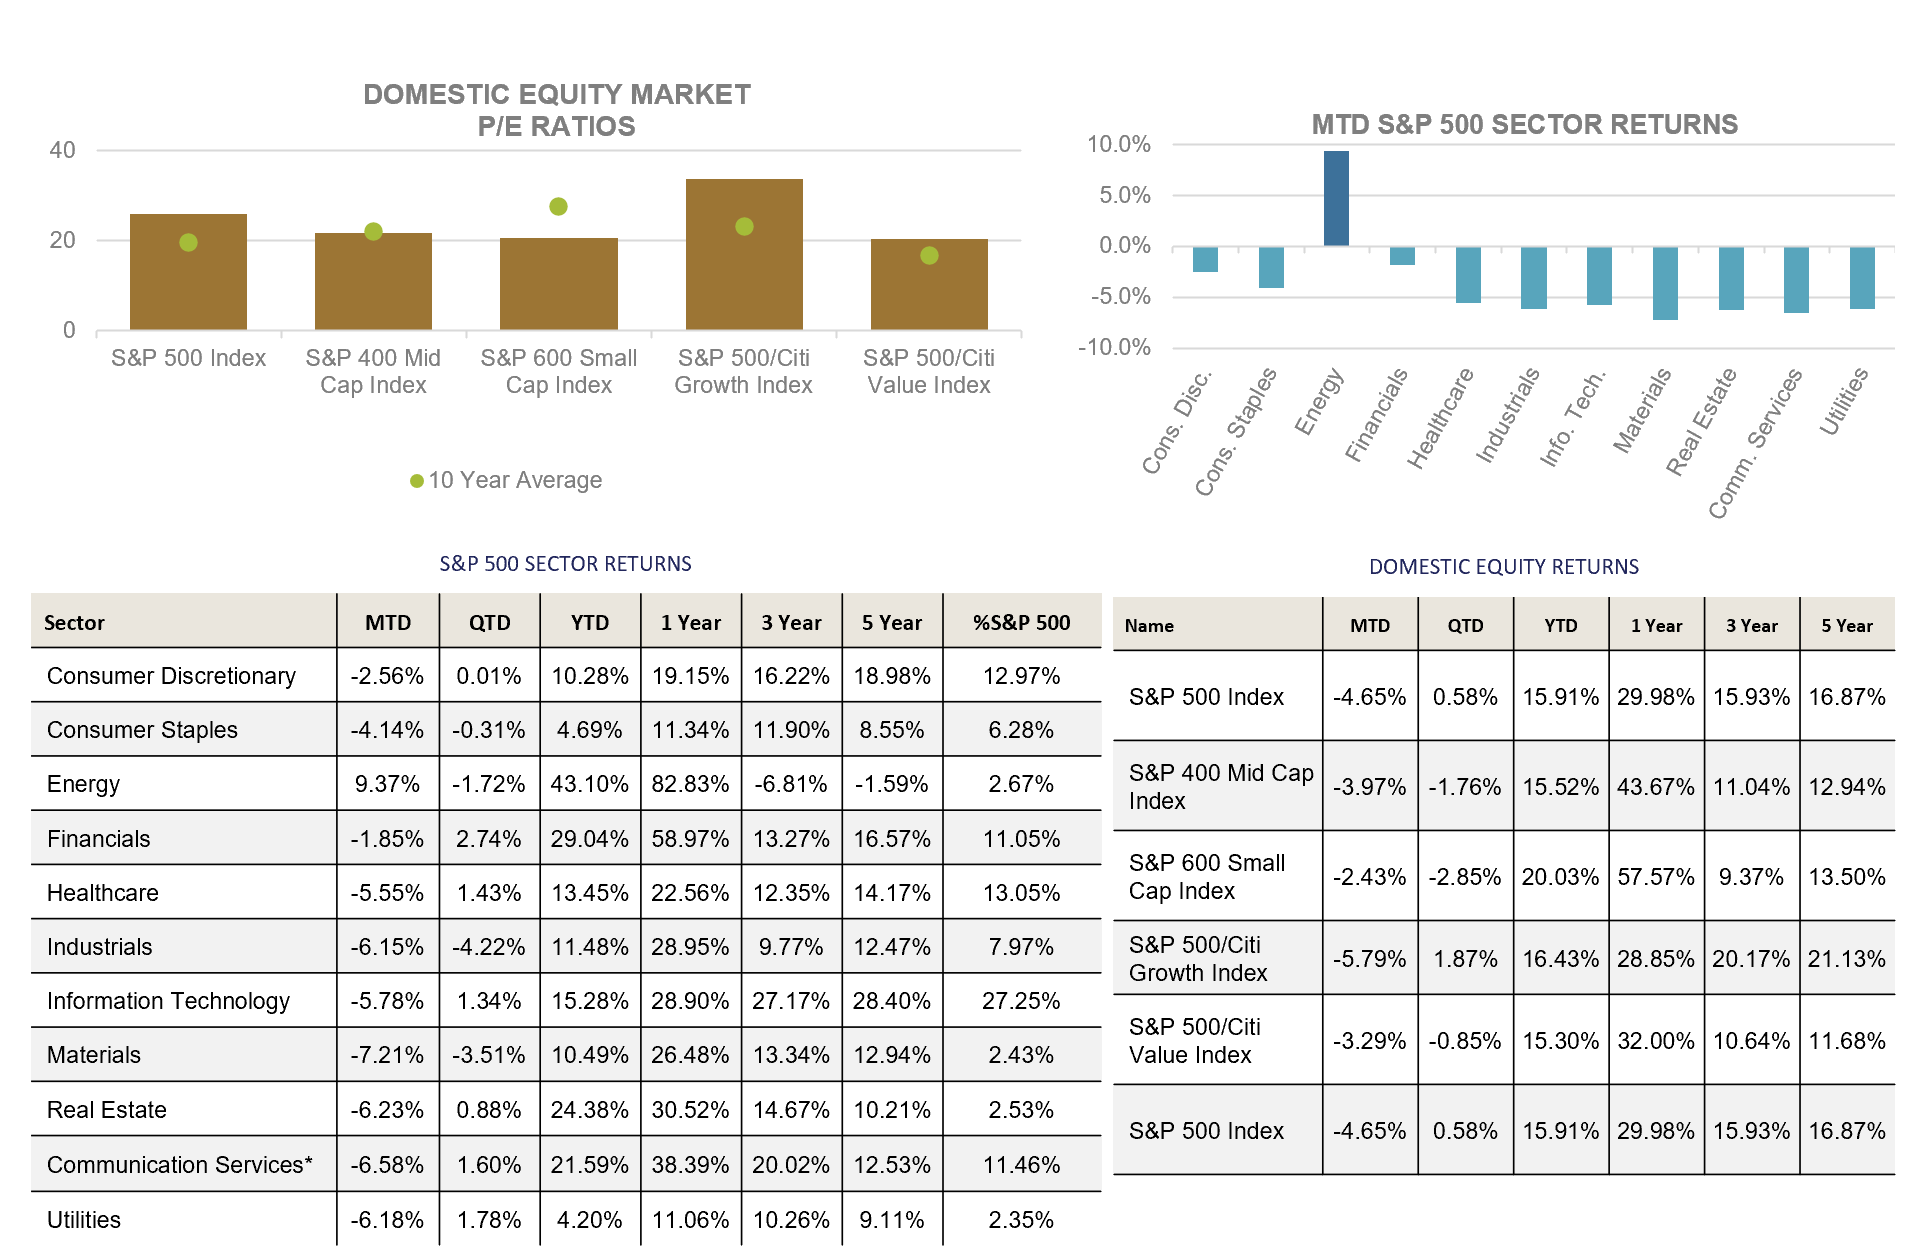
Equity markets retreated from all-time highs in September as the benchmark S&P 500 Index fell -4.65% to close at 4,308. Mid- and Small-Caps, as measured by the S&P 400 and 600 Indices faired better, falling -3.97% and -2.43%, respectively. Despite September’s drawdown, Large-Caps actually returned +0.58% during the quarter, and remain up +15.92% YTD. Mid-and Small-Caps returned -1.76% and -2.84%, respectively on the quarter, and remain up +15.52% and +20.05% YTD. Angst over inflation, Congressional gridlock, and changes in monetary policy weighted on investors, with volatility spiking +40.4%.
From a sector standpoint, Energy was the lone positive performer on the month, returning +9.44% as West Texas Intermediate (WTI) crude oil hit a 3-year high, and energy prices broadly speaking rose. For the year, Energy has returned +43.22%; however, still has a -1.59% annualized return over the trailing five-year period.
Of the 10 sectors posting negative returns on the month, Financials were the least bad of the group, losing -1.85% as interest rates rose and the yield curve steepened as the Federal Reserve announced a tapering announcement could come as soon as the Fed’s November 2-3 meeting. Consumer Discretionary and Consumer Staples stocks were the next best performers, losing -2.56% and -4.14% on the month. Cyclicals such as Materials and Industrials were near the bottom of the pack, losing -7.21% and -6.15% on the month as the U.S. Dollar hit a year to date high and talks over the much anticipated infrastructure bill were delayed in the House.
With anxiety over rising interest rates the Growth vs. Value debate intensified, with the S&P 500 Citi Growth Index giving back -5.79%, underperforming Value by 250bps; however, both have performed similarly YTD, whereas Growth has outperformed Value by more than 9 percentage points annually over the past five years.
International Equity
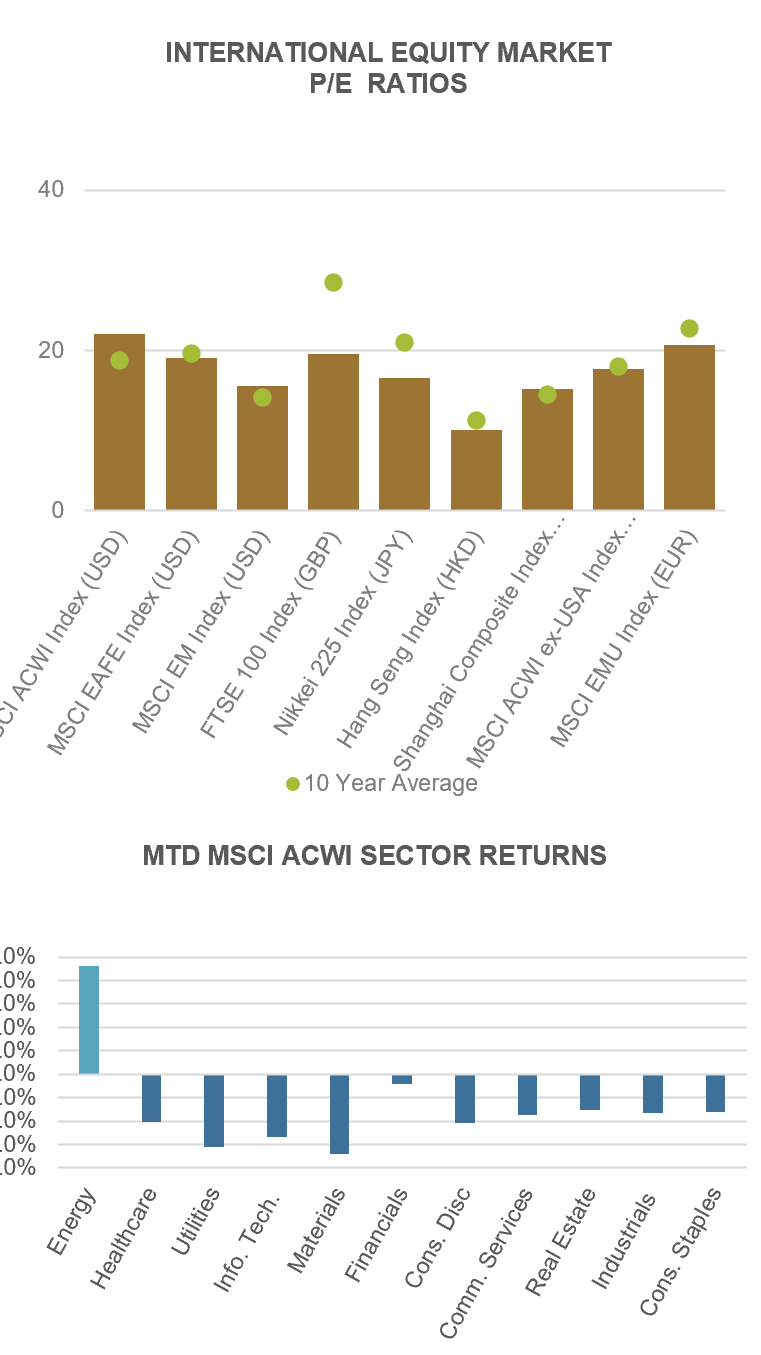
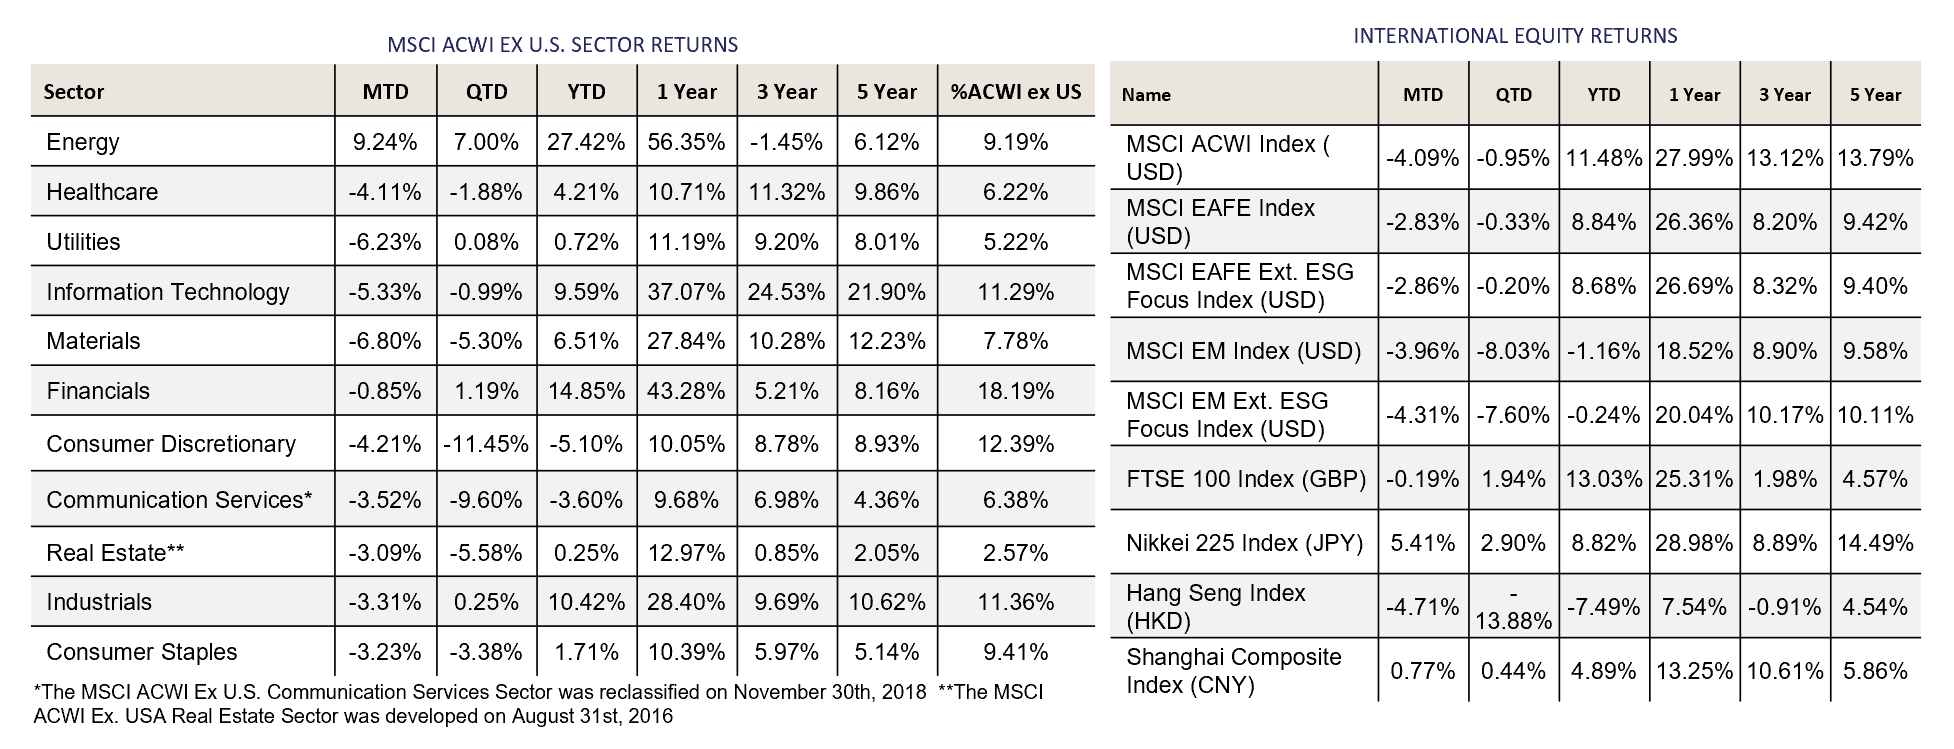
International equities fared better than U.S. equities in September, as both Developed Markets (DM) and Emerging Markets (EM) remained resilient in the face of a stronger U.S. Dollar. DM, as measured by the MSCI EAFE Index, lost -2.83% on the month, while EM, as measured by the MSCI EM Index gave back -3.96%. For the year, international equities have struggled, with DM returning +8.84%, while EM has lost -1.16%. Continued uncertainty around covid-19 variants, supply chain bottlenecks, and geopolitics have plagued international equities year to date; however, upticks in vaccination rates and doses given should help to alleviate some pressure in Q4.
At the sector level, Energy was the top performer, gaining +9.24% on the month as Brent Crude prices hit multi-year highs and natural gas prices surged. A combination of outages, lack of renewable access, and below average gas supplies have driven prices higher. Financials benefitted from rising interest rates globally, but still finished the month in the red, losing -0.85% on the month. Materials and Utilities were the hardest hit, shedding -6.80% and -6.23%, respectively.
From a regional standpoint, the Eurozone, as measured by the MSCI EMU Index, returned -5.18%, hurt by a rising U.S. Dollar. Japan was a bright spot, with the Nikkei 225 Index gaining +5.41% in JPY terms (+4.02% in USD terms), as Prime Minister Suga announced he would be stepping down after barely 1-year on the job. A new Prime Minister could usher in additional fiscal stimulus and help boost vaccination rates, which have lagged other DM countries, benefitting equities on a hedged basis should the Yen weaken on additional easing.
UK equities, as measured by the FTSE 100 Index, lost a scant -0.19% on the month in GBP terms as the Pound weakened against the Dollar; however, the UK remains up +13.03% on the year (+11.46% in USD terms), outperforming the rest of DM.
Fixed Income
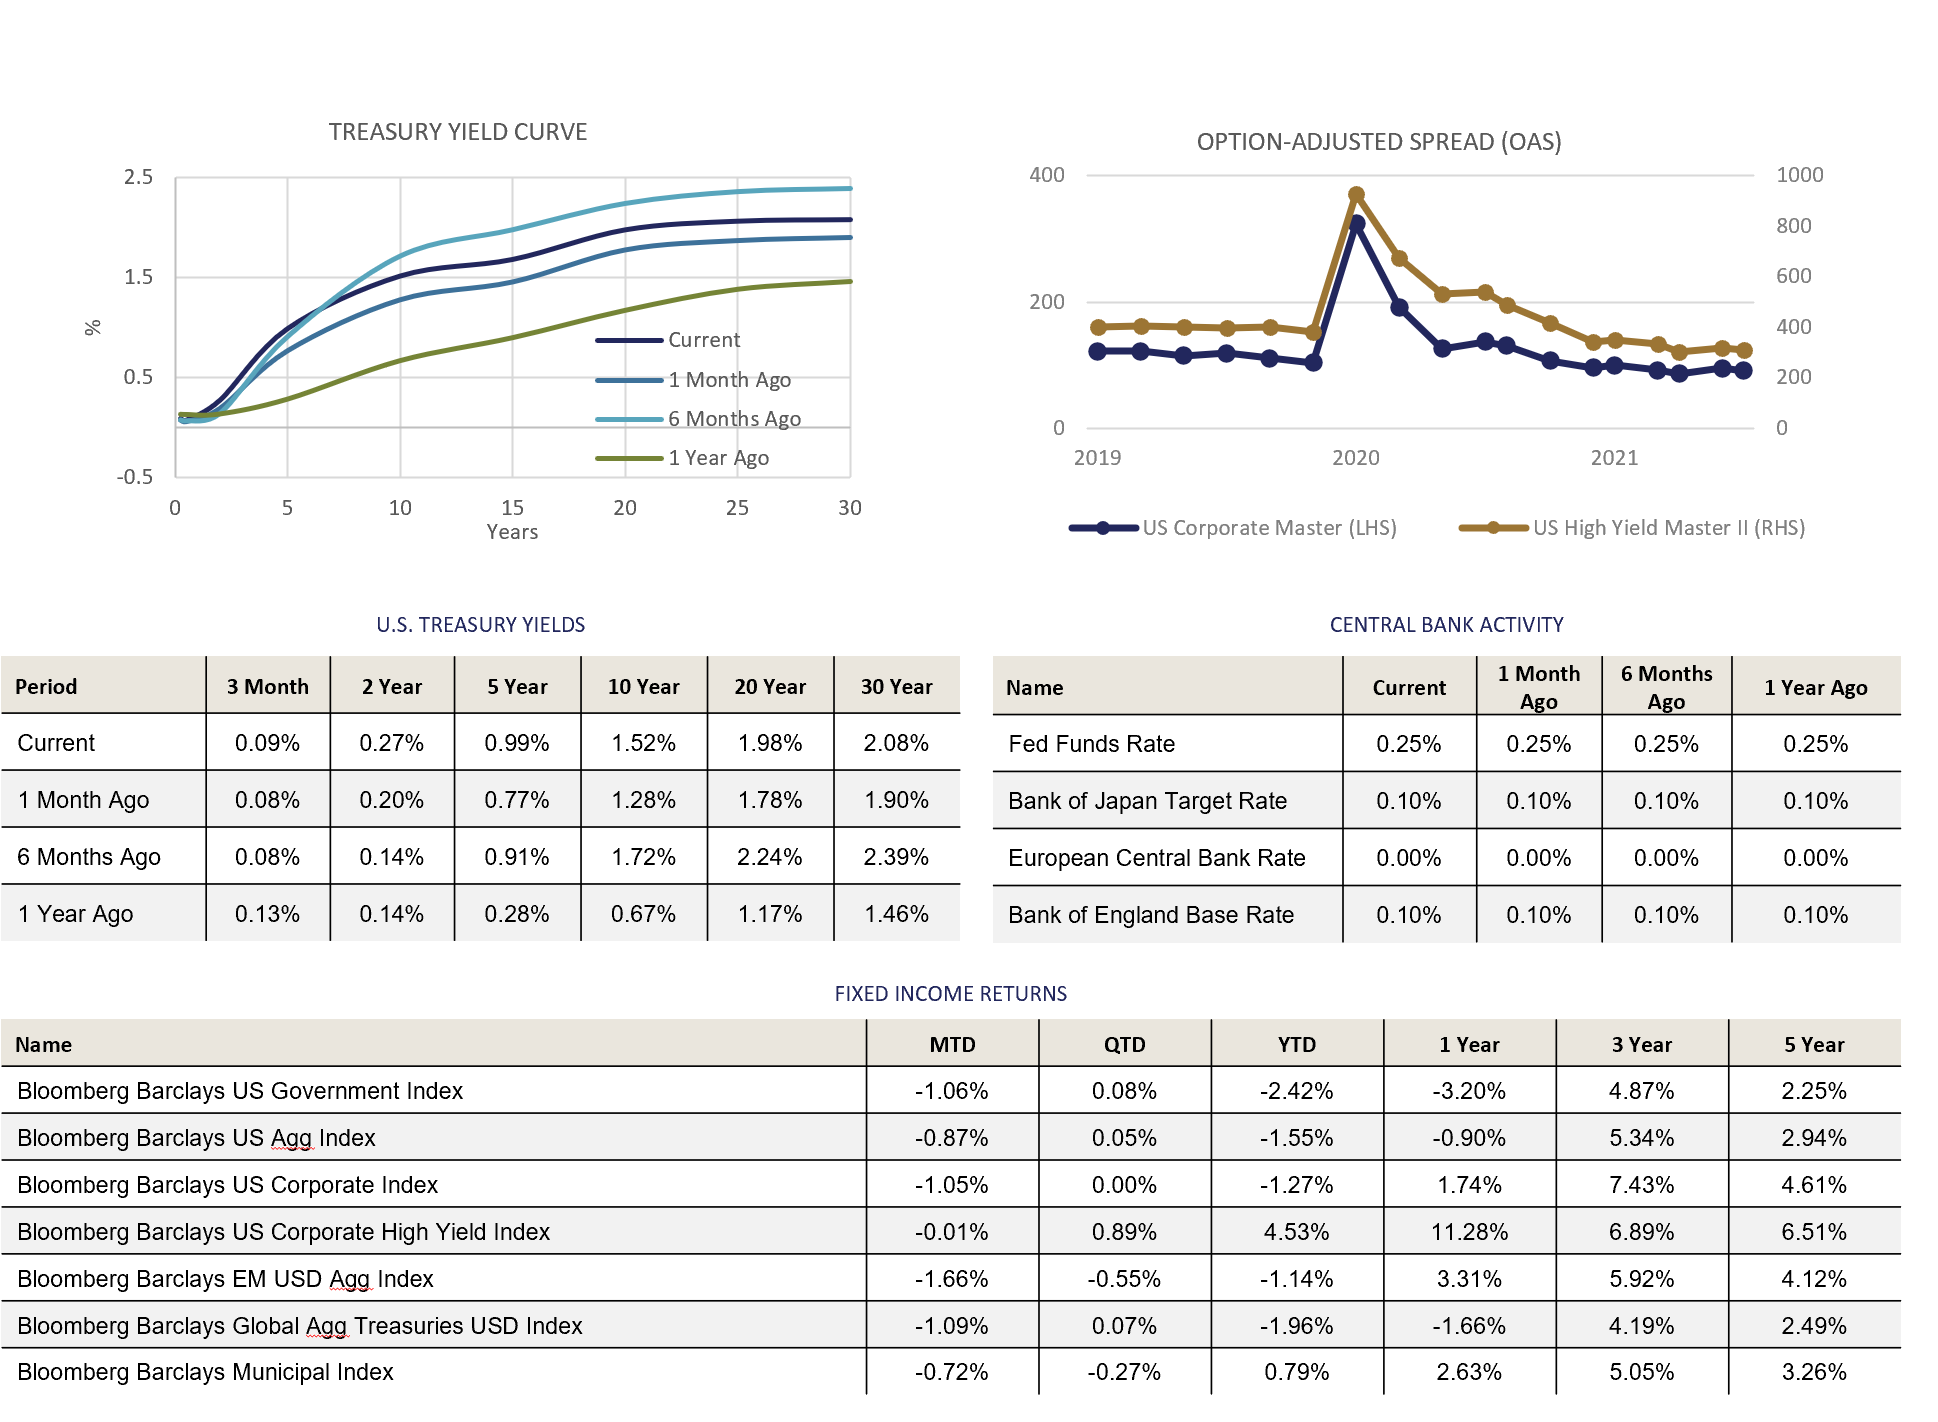
The bond market seems to have been awakened from its slumber. What caused the sudden awakening is not as clear. Fed Reserve Chairperson Jerome Powell has clarified his thinking in recent speeches and press conferences. He admits that inflation may be more sticky and less transitory than he supposed, that tapering QE asset purchases will very likely begin in the near future, and that it may be difficult to quell inflation (during a period a labor market slack) with Monetary Policy when it is fueled by possibly rate-insensitive pent-up demand.
China’s Evergrande debacle, continued above trend inflation readings, quickly rising global energy prices, and more supply chain kinks could also be playing in to this month’s move higher in interest rates. Even with the move higher, real rates (nominal rates adjusted for inflation) remain negative. Even with these concerns in the background, we have yet to experience a strong risk-off move in the market. Credit spreads have been a bit jittery over the past few months, but remain within spitting distance of their 2021 lows.
For the month of September, Investment Grade bonds turned in negative returns due to the rise in interest rates. Treasuries, Corporates, and the broad indices were all affected, almost uniformly. Municipal bonds were down, but less so than the taxable universe, continuing their trend of outperformance.
High Yield again lead the way in returns, closing out the month a single basis point to the good.
Quarter to Date, the Investment Grade numbers look better, treading water at roughly flat. High Yield returned almost a full percentage point in Q3.
The Year to Date returns really highlight Municipal (0.79%) and High Yield (4.53%) returns. The Investment Grade indices are all negative. The decline in bond prices driven by rising interest rates was too large to be offset by the relatively modest yields the bonds earned.
Alternative Investments
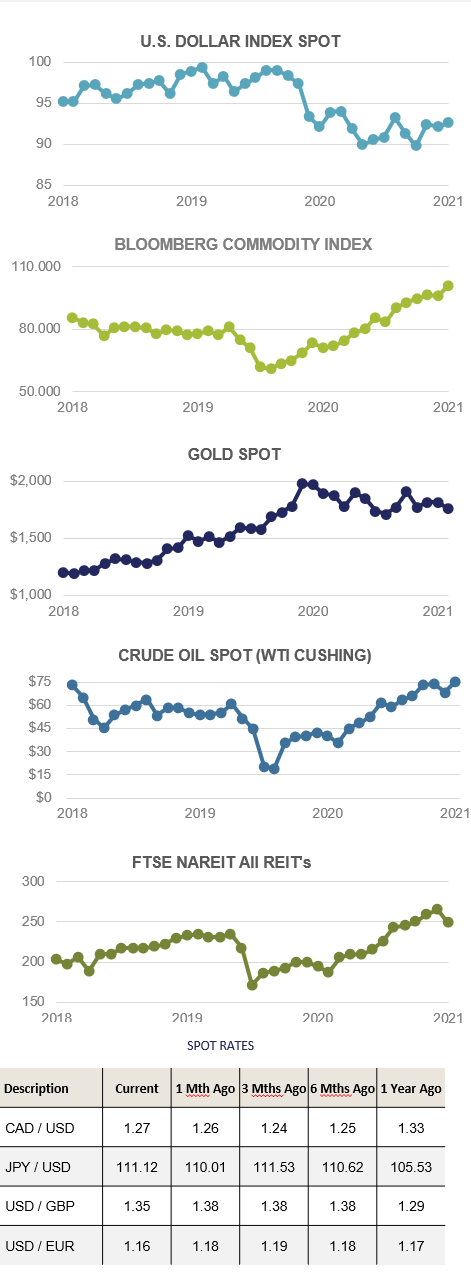
Alternative Investments were mainly positive in September, in contrast to broad equities and fixed income. The US Dollar, as measured by the DXY Index, rose +1.73% on the month as rates in the US bond market began to rise. Despite a stronger dollar, commodities, as measured by the Bloomberg Commodity Index, rose +4.97% on the month.
Inflation has been more sticky than the “transitory” label it is often given and rising commodity prices from lumber to oil to natural gas that are passed on to consumers have contributed.
An unreliable supply chain and environmental issues have caused input prices to rise throughout the year. Many commodity producers are limiting spending to new supply output in an attempt to lower carbon emissions and minimize environmental damage. Lower supply combined with recovering demand has caused the price of industrial metals to rise and many commodity analysts see the supply/demand imbalance persisting. In addition to constrained supply, specific commodities such as copper may play a leading role in the green economy because it is such an integral component to renewable energy generation causing demand to rise even further.
Global carbon futures is one relatively new asset class that allows investors to go long the price of carbon as carbon emission regulation tightens worldwide. Carbon credit futures contracts track the price of carbon in the largest global emission trading systems (ETS), also known as Cap and Trade systems, worldwide. The IHS Markit’s Global Carbon Index tracks the three largest global carbon futures market and is up a staggering +63% YTD. In addition to recent strong performance, carbon futures have historically had a low correlation to most traditional asset classes and may be beneficial as a portfolio diversifier.

ESG
The SEC has made it clear that it is interested how fund managers are voting their proxies in regard to executive pay (G), mergers (S and/or G), and the environment (E). This will make it easier for investors to verify that their concerns are being taken into account by the fund mangers they choose to invest their money with.
SEC Chairperson Gary Gensler has also made it clear that he is interested in requiring companies to share more detailed climate-change related risks in their quarterly and annual filings. In the near future we expect to see a proposal requiring disclosure of climate-related risks. It is likely that the disclosures will bear a resemblance to the current disclosures recommended by the Financial Stability Board’s Taskforce on Climate-related Disclosures (TCFD).
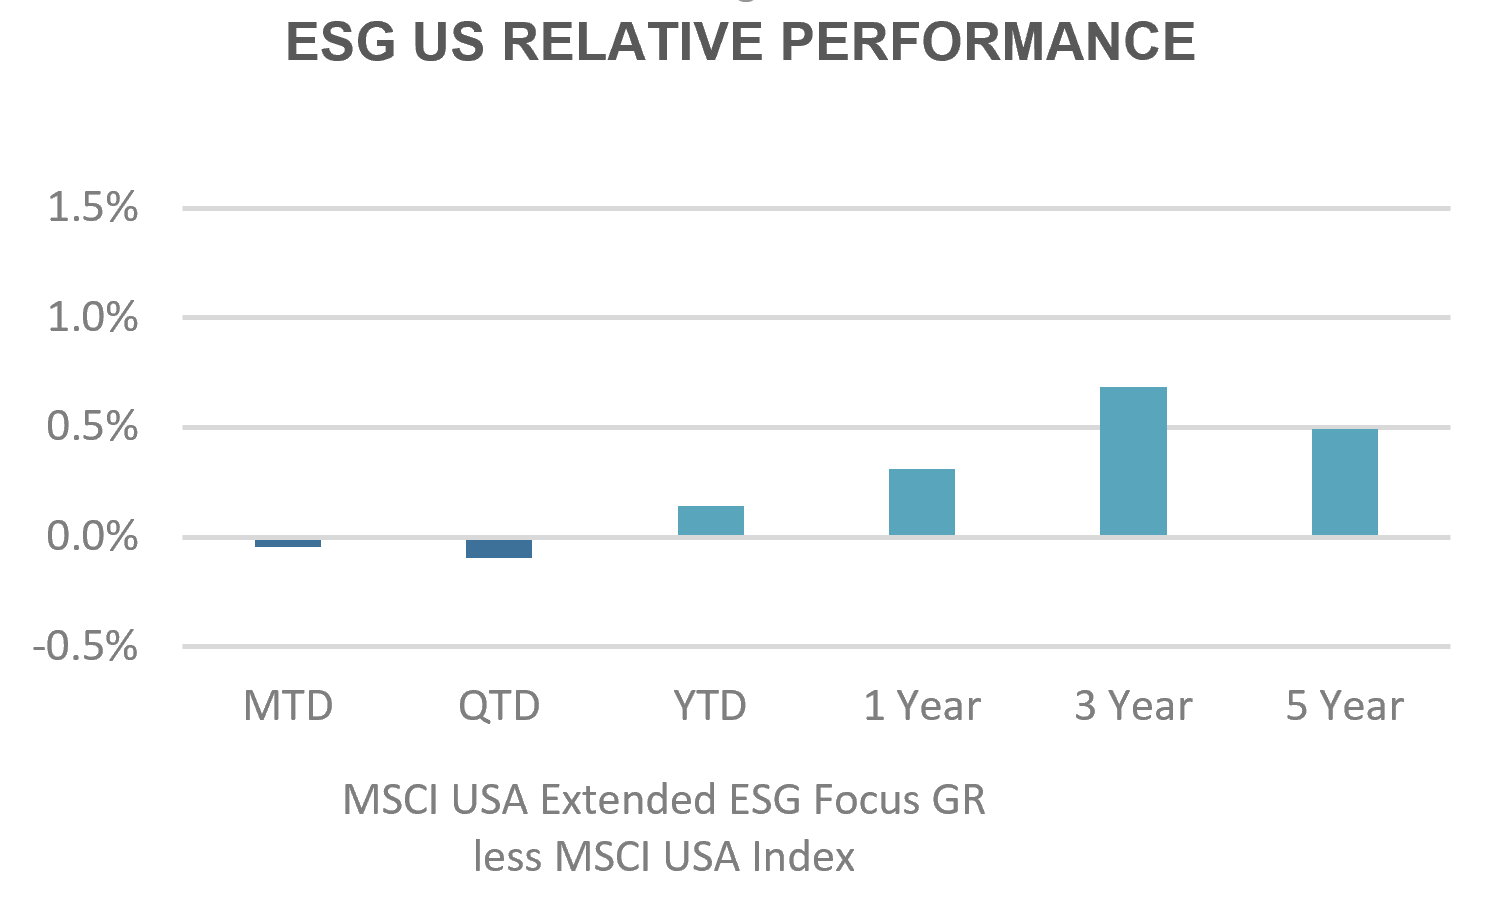
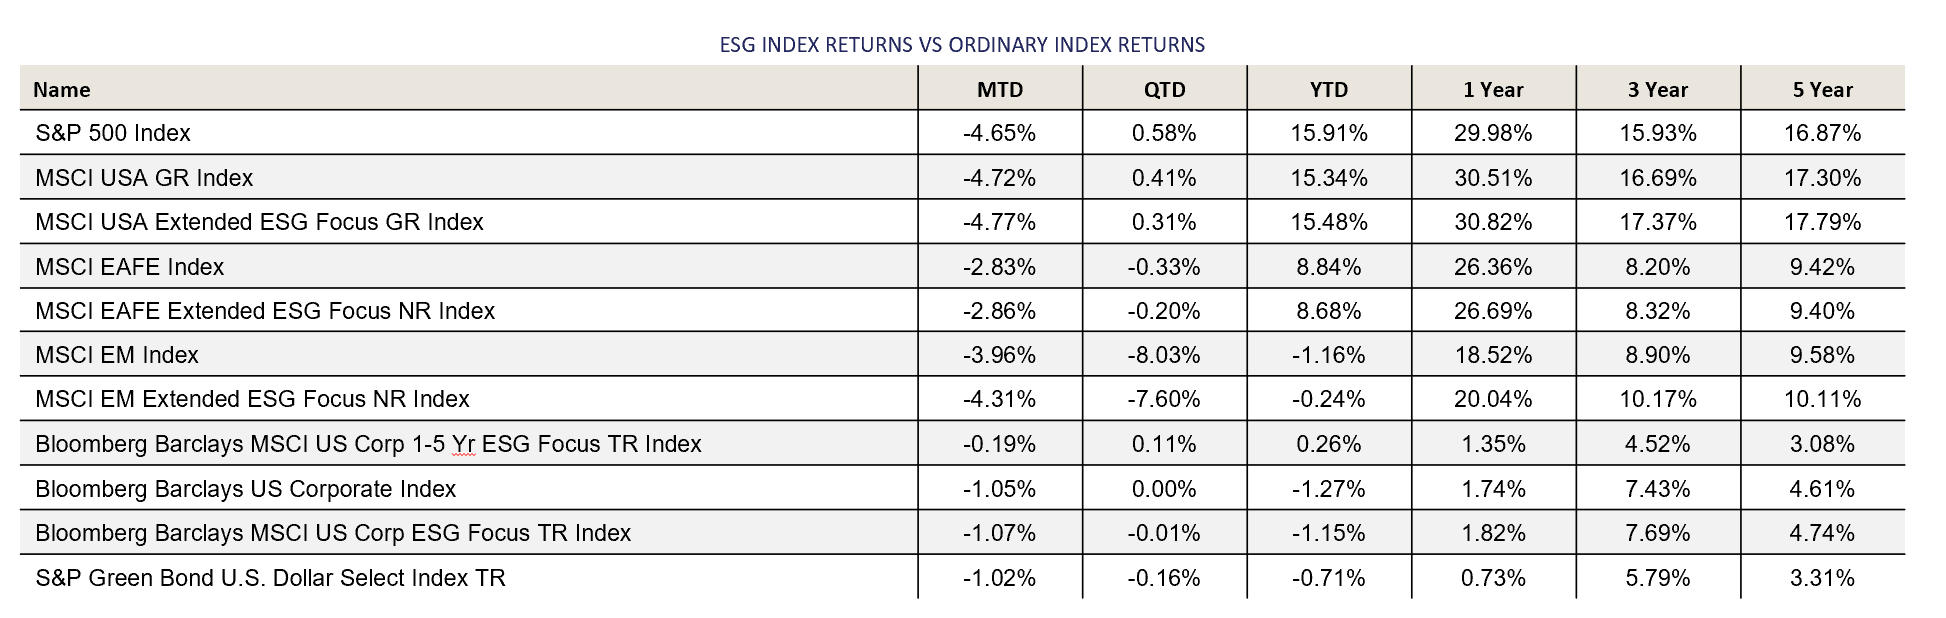
September returns for the ESG equity indices have been lackluster, with the U.S. and EAFE coming in relatively flat at down 5 basis points and down three basis points respectively. Emerging Markets saw a larger lag in the month, which was related to decline in China Internet/Tech exposure, which is slightly larger in the ESG integrated index.
The ESG aligned U.S. index was marginally behind its counterpart in the month and quarter, while still contributing outperformance YTD, and in all longer time periods.
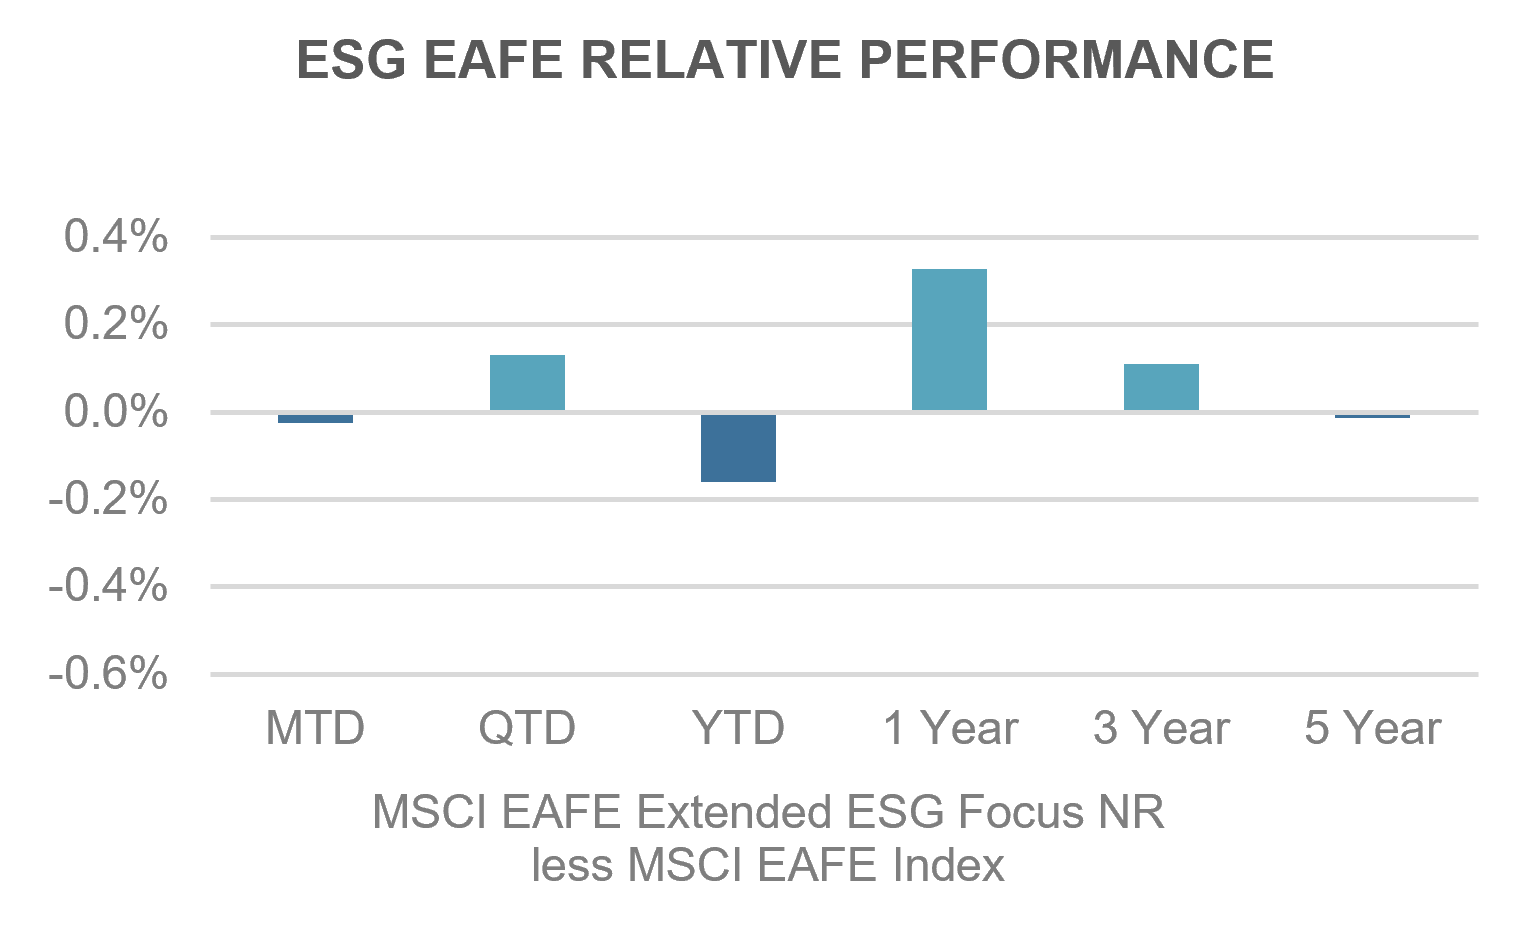
ESG integrated EAFE returns also fell back slightly in the month of September. The longer time periods continue to present a mixed bag of performance results. There is strength developing in the long-term results, with one and three year returns showing positive alpha compared to the non-ESG integrated index, and five year results roughly flat.
Emerging Markets had the toughest time in September, showing noticeable underperformance compared the non-ESG integrated benchmark. The marginally higher allocation to technology, paired with a larger exposure to China relative to the benchmark were the obvious culprits in this case. All longer time horizons continue to strongly support ESG integration into Emerging Markets portfolios.
ESG integrated Investment Grade corporate bonds underperformed by 2 basis points this month, and trail by 1 bp in the third quarter. All longer time periods continue to show outperformance and remain very supportive of ESG integration in the space.
Issuance of Sovereign Sustainability bonds broke a record in September with $27 billion of debt coming to market as interest in the securities has continued to grow.

For more news, information, and strategy, visit the ETF Strategist Channel.
