
In this article, I examine the effect of the Fed’s actions on major markets and provide a near-term (1-2 quarters) market outlook.
Let me first identify my target audience. Some investors and advisors follow the buy-and-hold, passive investing approach. They are convinced that stocks go up in the long run, and that they needn’t worry about downturns. This group follows a “set it and forget it,” or do-nothing approach, and has no desire or ability to actively manage wealth.
Others take an active approach. They realize that bear markets can exceed their capacity to hold and might destroy wealth. They attempt to reduce downside risk, and increase return, via active management. This is the group (to which Model Capital also belongs) to which I direct this article.
Executive Summary
I convey below the following points, illustrated with charts:
- The Fed has slowed inflation from 9% to 7%, and is determined continue, to bring it down to 2%.
- Higher interest rates are already extending pressure on the economy, even with no more hikes.
- The Treasury yield curve inverted, which historically occurs before recessions.
- The inverted yield curve can normalize in two ways, both of which have negative implications for the economy and its forward-looking barometer, the stock market.
Unfortunately, “Santa Fed” has coal in his bag this Holiday season. I outline below, in wide qualitative brushstrokes, why we expect more downside for the stock market in the near term.
1. The Fed Effect On Inflation
Inflation Rate, 25 Years
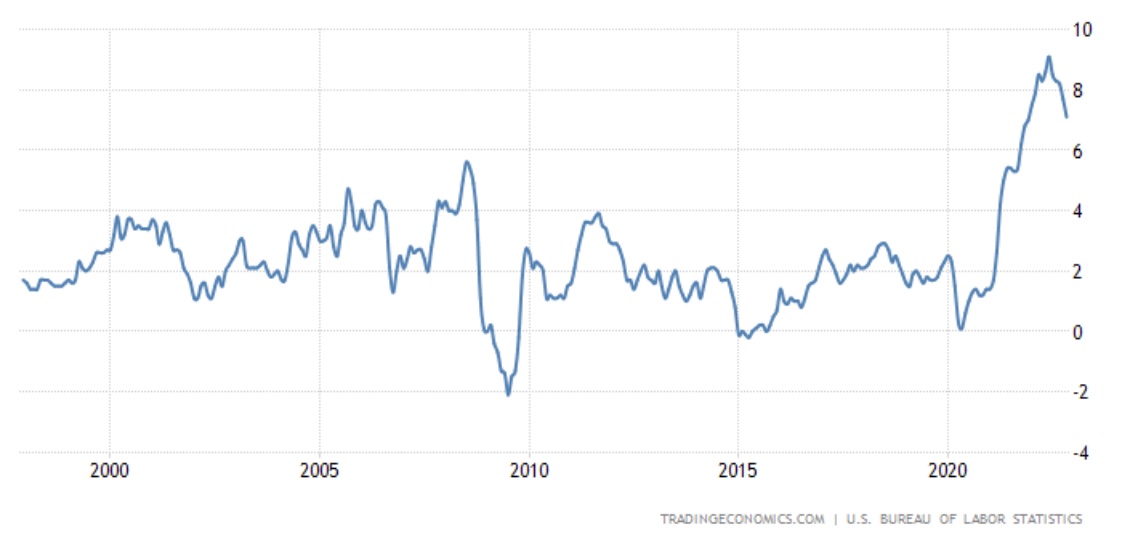
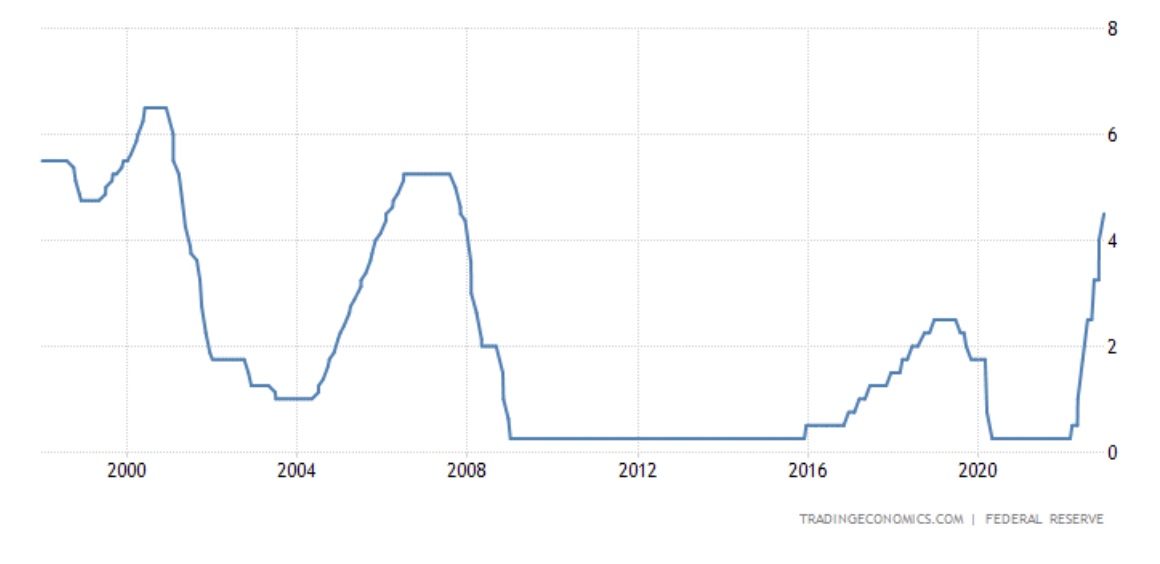
The Fed took decisive action to combat runaway inflation, albeit with a year’s delay – it began a series of rate hikes in March of 2022. The federal funds rate was raised from 0.25% to 4.5% in seven rate hikes, pushing borrowing costs to the highest since 2007. Higher borrowing costs reduce demand, and they have already had the desired effect of reducing inflation. But inflation still remains too high relative to the Fed’s 2% target. Approximately 0.5% in additional hikes is expected by bond traders by March, according to the CME Fed Watch tool.
Fed Funds Rate, 25 Years
2.The Effect on The Economy
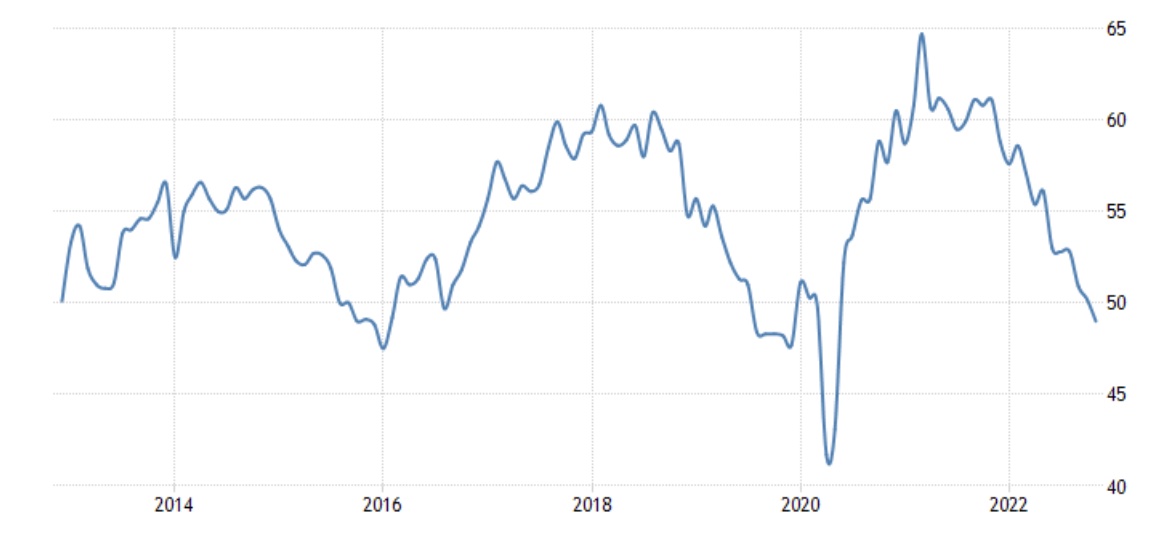
Higher rates reduce demand, and thus put pressure of the economy which continued to weaken in November. The ISM Manufacturing PMI, a widely followed coincident indicator, declined to 49 in November, pointing to the first contraction (values below 50) since the midst of the COVID pandemic in May of 2020 (see chart). While consumer spending remains resilient, interest rate-sensitive sectors weakened the most.
ISM Manufacturing PMI, 10 Years
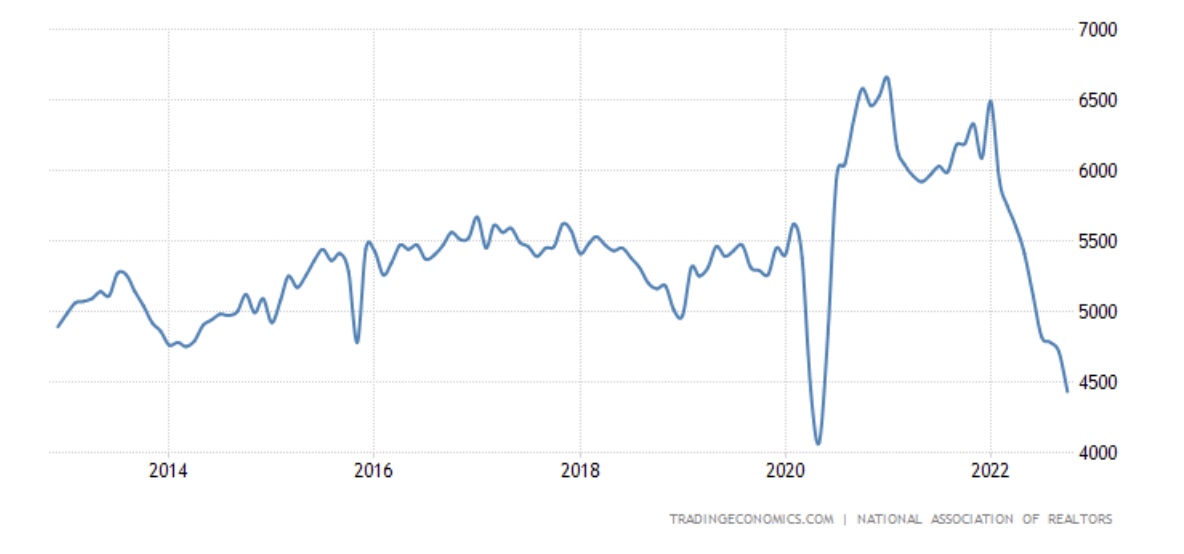
Housing is among the hardest-hit sectors due to higher borrowing costs. Existing home sales tumbled this year to an annual rate of 4.4 million, the lowest since December of 2011 except for a brief fall during the pandemic in 2020 (see chart). Home prices, which lag sales, began to decline as well.
Existing Home Sales, 10 Years
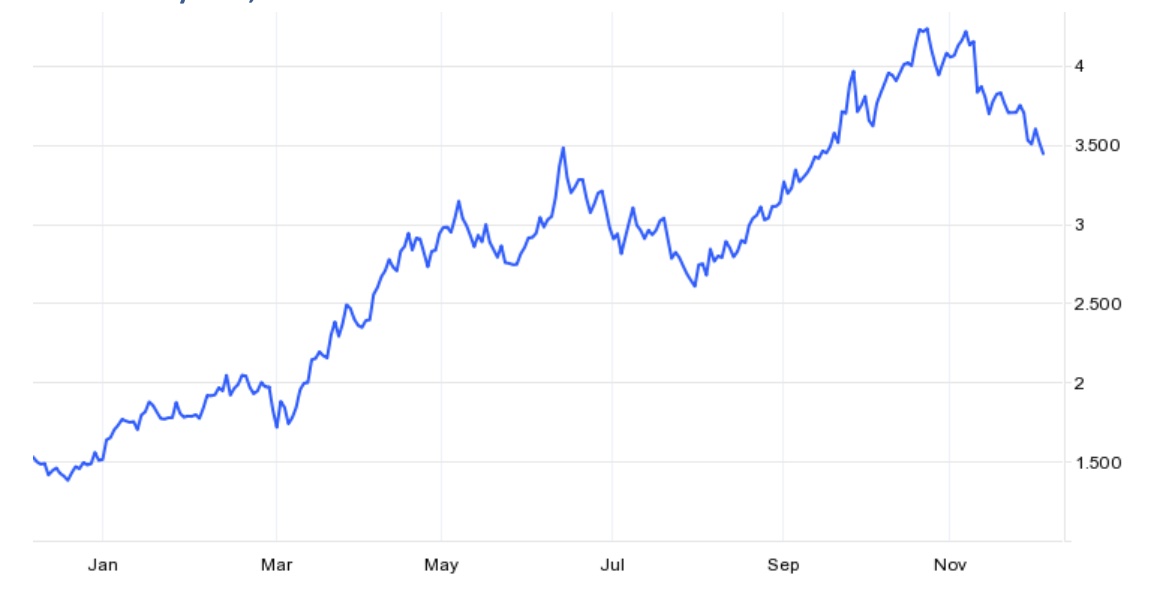
3. The Yield Curve
Treasury yields, which are set by bond trading, are signaling something interesting. After reaching a peak around 4.2%, the 10-year yield has now retreated to 3.5%, well below short-term yields (3-month at 4.3% and 1-year at 4.6%). Long-term yields trading below short-term is called an “inverted yield curve.”
10-Year Treasury Yield, 1 Year
An inverted yield curve is historically unusual and reverts to a normal yield curve relatively quickly. Most of the time, the yield curve inverts before recessions, which then results in collapse in prices (deflation), and in corresponding decline in short-term rates (let’s use 4.5% Fed Funds rate as proxy). Much more can be said about this topic but let me reserve it for another article. Let us for now accept as given that an inverted yield curve will normalize in the coming months, as it has in the past. This can occur in two ways:
- Short-term rates (4.5%) fall sharply, below long-term (currently at 3.5%), and/or
- Long-term yield rises above short-term.
4. The Way Forward
I described above, very briefly, the current state of the economy and markets: still-high inflation, the Fed determined to combat it, an economy under pressure, and an inverted yield curve. Given this state, we quickly realize that each of the two scenarios of normalizing yield curve has important implications.
In the first scenario, short-term yields (currently 4.5%) must fall by at least 1%, below the 10-year yield. Considering the Fed’s focus on combatting inflation described above, this is likely in a scenario when the Fed wins the fight against inflation, by reducing demand so much as to cause a collapse in consumer prices. The Fed is fully aware, and in fact expects, that it would take a recession to win against inflation. Fed chairman Powell openly warned in his Jackson Hole speech last month that “hard times for families and businesses” (i.e., a recession) are likely to result from its tightening policy.
In the second scenario, long-term Treasury yields (the 10-year currently around 3.5%) must rise by at least 1% to match short-term rates. This would spell disaster for rate-sensitive sectors such as housing, auto sales, and most durable goods sales. It would push mortgage rate above its recent 7.1% peak (before the latest retreat to 6.4%) which already wreaked havoc on home sales. Needless to say, this would likely push the economy into an outright recession.
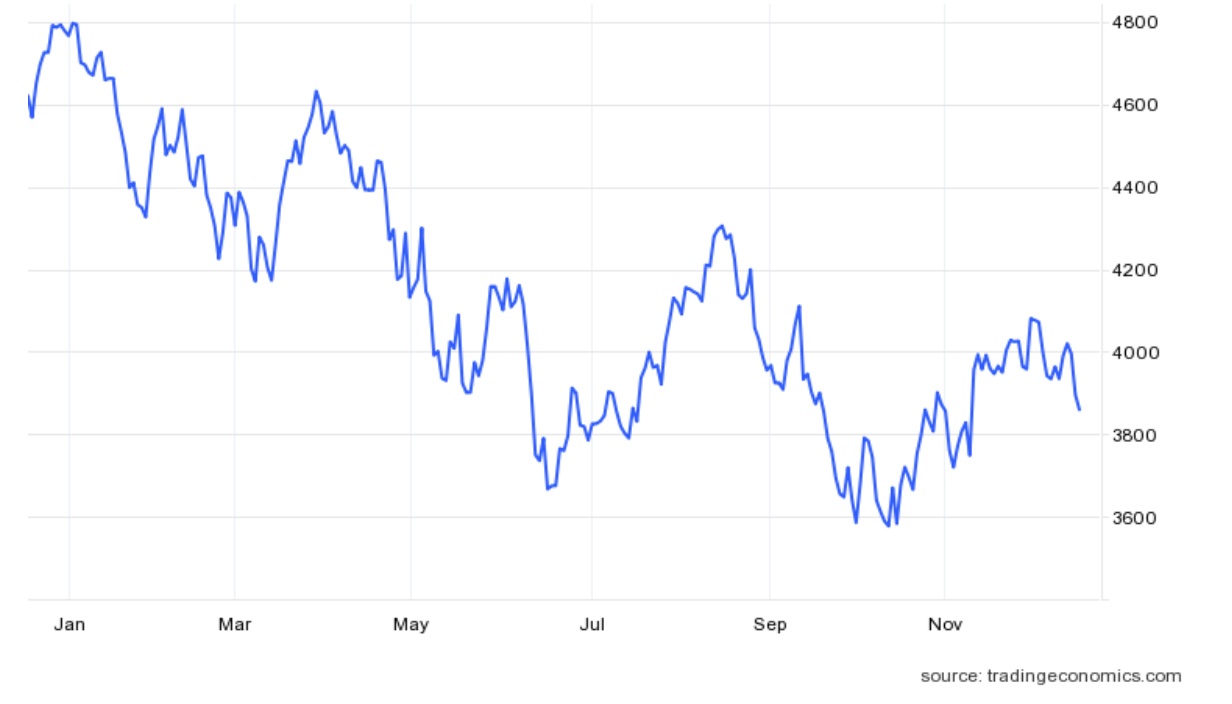
The S&P 500, 1 Year
 To summarize, we find ourselves in a certain market-economic state, with one of its properties (among others) being an inverted yield curve. We know that historically, the yield curve normalizes quickly. Both ways that it can normalize are very negative for the economy (they both include a recession) and for the stock market as its forward-looking barometer.
We’re ready to celebrate the Holidays. But as active investors/advisors, we are also on lookout for what to expect from the market in the new year. I laid out above, in wide qualitative brushstrokes, that we should expect more downside. Unfortunately, “Santa Fed” has coal in his bag this year.
A brief note about the pullback in Treasury yields and the corresponding stock market rebound in late October and November that optimists attributed to the Fed “moderating” the pace of rate hikes. The yield pullback will likely provide a short-term boost to rate-sensitive sectors in November and possibly December. But the recent stock market rebound already factored-in this positive, in my view – but investors are only beginning to factor-in a prospect of a recession.
About Model Capital Management LLC
Model Capital Management LLC (“MCM”) is an independent SEC-registered investment adviser, and is based in Waltham, Massachusetts. Utilizing its fundamental, forward-looking approach to asset allocation, MCM provides asset management services aimed to help other advisors implement its dynamic investment strategies designed to reduce significant downside risk. MCM is available to advisors on SMArtX Advisory, Axos Advisor Services, and Envestnet platforms, but is not affiliated with those firms.
Notices and Disclosures
- This research document and all of the information contained in it (“MCM Research”) is the property of MCM. The Information set out in this communication is subject to copyright and may not be reproduced or disseminated, in whole or in part, without the express written permission of MCM. The trademarks and service marks contained in this document are the property of their respective owners. Third-party data providers make no warranties or representations relating to the accuracy, completeness, or timeliness of the data they provide and shall not have liability for any damages relating to such data.
- MCM does not provide individually tailored investment advice. MCM Research has been prepared without regard to the circumstances and objectives of those who receive it. MCM recommends that investors independently evaluate particular investments and strategies and encourages investors to seek the advice of an investment adviser. The appropriateness of an investment or strategy will depend on an investor’s circumstances and objectives. The securities, instruments, or strategies discussed in MCM Research may not be suitable for all investors, and certain investors may not be eligible to purchase or participate in some or all of them. The value of and income from your investments may vary because of changes in securities/instruments prices, market indexes, or other factors. Past performance is not a guarantee of future performance, and not necessarily a guide to future performance. Estimates of future performance are based on assumptions that may not be realized.
- MCM Research is not an offer to buy or sell or the solicitation of an offer to buy or sell any security/instrument or to participate in any particular trading strategy. MCM does not analyze, follow, research or recommend individual companies or their securities. Employees of MCM may have investments in securities/instruments or derivatives of securities/instruments based on broad market indices included in MCM Research. MCM’s Form ADV, Part 2A (Brochure) contains further details pertaining to employee training.
- MCM is not acting as a municipal advisor and the opinions or views contained in MCM Research are not intended to be, and do not constitute, advice within the meaning of Section 975 of the Dodd-Frank Wall Street Reform and Consumer Protection Act.
- MCM Research is based on public information. MCM makes every effort to use reliable, comprehensive information, but we make no representation that it is accurate or complete. Opinions or information are subject to change with respect to MCM Research.
- MCM DOES NOT MAKE ANY EXPRESS OR IMPLIED WARRANTIES OR REPRESENTATIONS WITH RESPECT TO THIS MCM RESEARCH (OR THE RESULTS TO BE OBTAINED BY THE USE THEREOF), AND TO THE MAXIMUM EXTENT PERMITTED BY LAW, MCM HEREBY EXPRESSLY DISCLAIMS ALL WARRANTIES (INCLUDING, WITHOUT LIMITATION, ANY IMPLIED WARRANTIES OF ORIGINALITY, ACCURACY, TIMELINESS, NON-INFRINGEMENT, COMPLETENESS, MERCHANTABILITY AND/OR FITNESS FOR A PARTICULAR PURPOSE).
- “Model Return Forecast” for 6-month S&P 500 return is MCM’s measure of attractiveness of the U.S. equity market obtained by applying MCM’s proprietary statistical algorithm and historical data, but is not promissory, and, by itself, does not constitute an investment recommendation. Model Return Forecasts were calculated and applied by MCM to its research and investment process in real time beginning from 2012. For periods prior to Jan 2012, the results are “back-tested,” i.e., obtained by retroactively applying MCM’s algorithm and historical data available in Jan 2012 or thereafter. Back-tested performance, if any, is presented gross of any advisory fees and trading expenses. Index returns referenced in MCM Research, if any, are gross of any advisory fees, fund management fees, and trading expenses. Fund or ETF returns referenced, if any, are gross of advisory fees and trading expenses. Returns will be reduced by fees and expenses incurred.
