

By Dan Suzuki, CFA, Deputy Chief Investment Officer
A look back at the best trades of the past 50 years
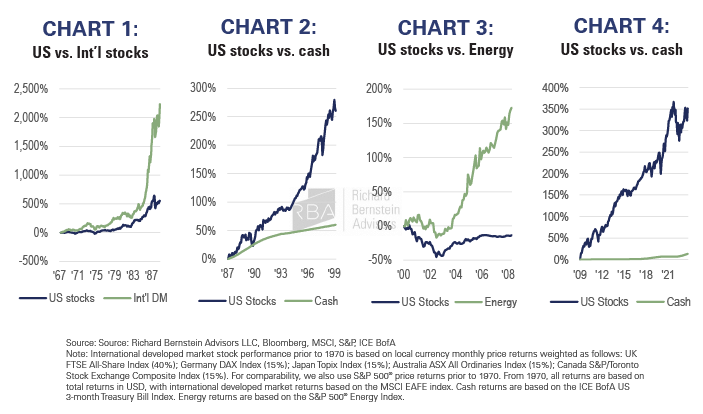
At RBA, we believe that we are at a major inflection point in macro fundamentals and market leadership, offering investors a once-in-a-generation opportunity to reposition portfolios. To put the magnitude of this opportunity into perspective, we have identified what we believe are the best trades of the past 50 years — those asset class, regional and sector allocation decisions that would have netted the greatest long-term outperformance. Each of these trades would have generated excess returns averaging 7-19% per year spanning periods of 8-22 years:
- International stocks over US stocks (1967 – 1988): The dominant US Nifty 50 large caps ceased to live up to lofty market expectations, giving way to international stock leadership, especially driven by the ascent of Japanese manufacturing efficiency (Chart 1).
- US stocks over cash (1987 – 2000): In the wake of the 1987 stock market crash, US stocks climbed a wall of worry until telecommunication and technology stocks took the reins beginning in the mid-1990s, while interest rates on cash continued to fall (Chart 2).
- Energy stocks over the broad market (2000 – 2008): The bookends of the bursting technology bubble and the financial crisis weighed on broad index returns, while strong emerging market growth caused energy demand to outstrip supply (Chart 3).
- US stocks over cash (2009 – 2023): Following the financial crisis, US stocks climbed another wall of worry. The prolonged period of low interest rates not only minimized cash returns but also boosted liquidity and investment demand for high growth technologies (Chart 4).
The rise and fall of American exceptionalism
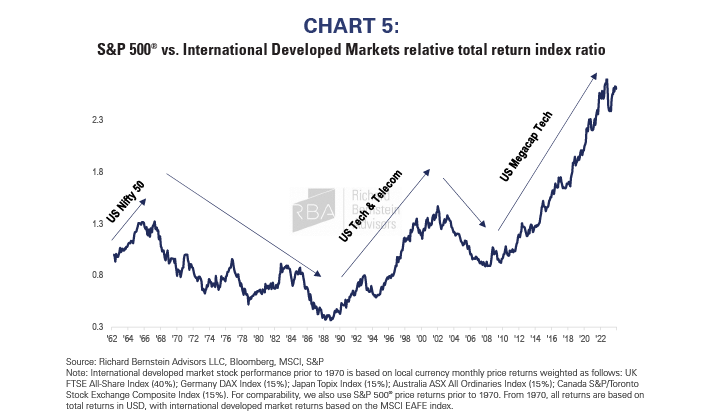
In many ways, each of these unique periods can be characterized by the rise of American exceptionalism. Beginning with the ascension of the US Nifty 50 stocks in the 1950s and 1960s, followed by the Tech and Telecom bubble of the 1990s, to the so-called Magnificent 7 leading today’s markets, a certain group of US companies becomes so dominant that they come to be perceived as the only stocks worth owning. Each time that became the pervasive sentiment, it generally signaled that the next big investment opportunities lay elsewhere (Chart 5).
The US is back to being “the only investment worth owning”
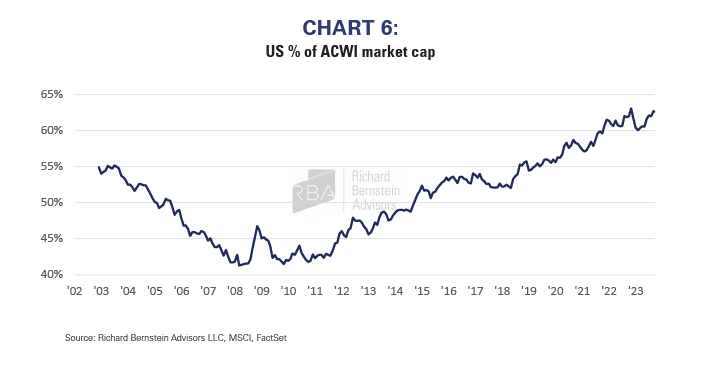
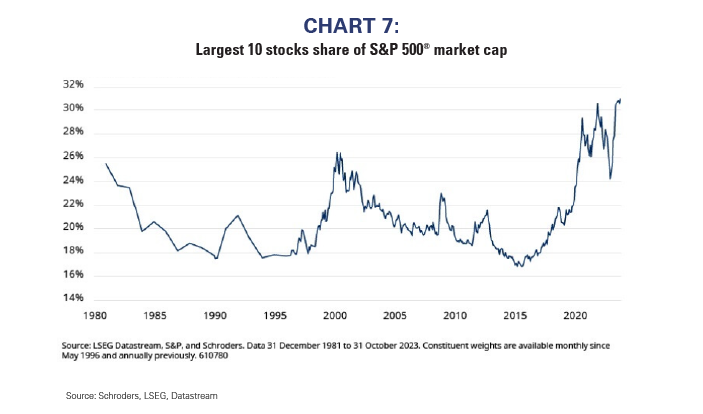
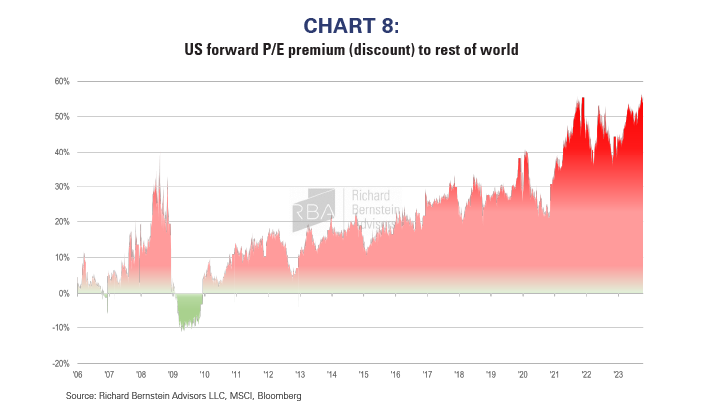
As the US has gone from “uninvestible” at the beginning of this bull market to today’s “obvious trade,” its share of the global stock market has surged from 40% to 64% (Chart 6), pushing market concentration to unprecedented levels (Chart 7). The US is the most expensive it has ever been compared to the rest of the world, with the premium having gone from -11% (a discount) in 2009 to +60% today (Chart 8). But rather than take steps to mitigate this extreme portfolio concentration, it appears that investors are doubling down. According to Bank of America’s latest fund manager survey, institutional investors are overweight US stocks, but even more worrisome may be the concentration in smaller investor portfolios. According to a recent Wall Street Journal article citing Vanda Research, the average individual’s stock portfolio has 40% of its value tied up in just three tech stocks!
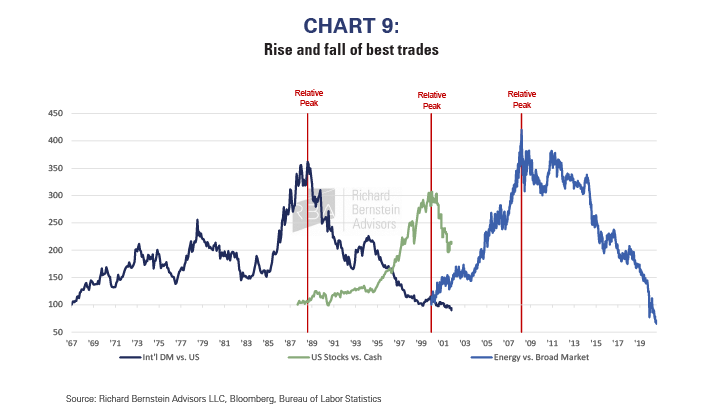
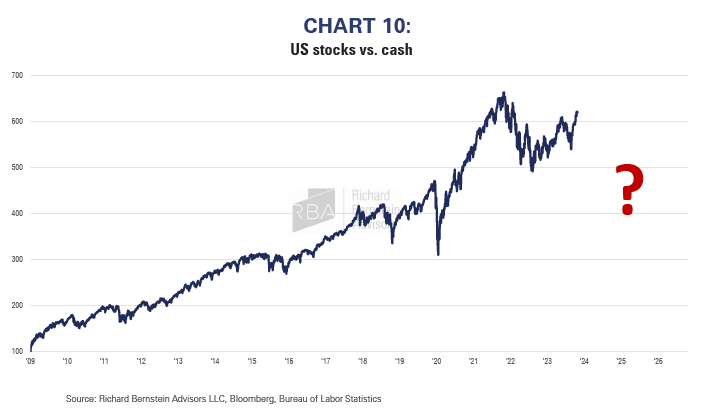
Nothing lasts forever
Eventually, high valuations and unattainable growth expectations lead to disappointments and significant devaluations. The subsequent period of deteriorating fundamentals and weak returns causes the pendulum to swing to opposite extremes. As a result, periods of significant outperformance tend to be followed by periods of significant underperformance, reversing much of the previously earned extraordinary gains, even for the biggest of secular themes (Chart 9). Positioning and valuation suggest that investors expect the US equity dominance of the past 15 years will last indefinitely, but history seems to suggest otherwise (Chart 10).
A once-in-a-generation opportunity hiding in plain sight
Market leadership tends to change in response to structural shifts in the macroeconomic fundamentals. The global economy is currently undergoing major inflections across inflation, interest rates, globalization, corporate profitability, demographics and government balance sheets. When coupled with the prevailing bifurcation of sentiment and record market concentration, the current juncture may offer investors a once-in-a-generation opportunity to rebalance portfolios. Just as in the wake of the Internet bubble, what part of the market you own could mean the difference between another lost decade of returns for crowded and expensive assets or very attractive returns for assets where capital is truly scarce. With all eyes on US large cap growth stocks and disinflation beneficiaries, we see bigger opportunities in international, small caps, value stocks and inflation beneficiaries.
INDEX DESCRIPTIONS:
The following descriptions, while believed to be accurate, are in some cases abbreviated versions of more detailed or comprehensive definitions available from the sponsors or originators of the respective indices. Anyone interested in such further details is free to consult each such sponsor’s or originator’s website.
The past performance of an index is not a guarantee of future results.
Each index reflects an unmanaged universe of securities without any deduction for advisory fees or other expenses that would reduce actual returns, as well as the reinvestment of all income and dividends. An actual investment in the securities included in the index would require an investor to incur transaction costs, which would lower the performance results.
Indices are not actively managed, and investors cannot invest directly in the indices.
US Nifty 50: a term used to describe fifty of the largest US stocks during the 1960s and early 1970s that were widely owned for their consistent growth and dividends.
Magnificent 7: a term coined by Bank of America to describe the seven US stocks that, as a function of their outsized market capitalizations and strong returns, were the biggest driver of US equity market returns in 2023.
Nothing contained herein constitutes tax, legal, insurance or investment advice, or the recommendation of or an offer to sell, or the solicitation of an offer to buy or invest in any investment product, vehicle, service or instrument. Such an offer or solicitation may only be made by delivery to a prospective investor of formal offering materials, including subscription or account documents or forms, which include detailed discussions of the terms of the respective product, vehicle, service or instrument, including the principal risk factors that might impact such a purchase or investment, and which should be reviewed carefully by any such investor before making the decision to invest. RBA information may include statements concerning financial market trends and/or individual stocks, and are based on current market conditions, which will fluctuate and may be superseded by subsequent market events or for other reasons. Historic market trends are not reliable indicators of actual future market behavior or future performance of any particular investment which may differ materially and should not be relied upon as such. The investment strategy and broad themes discussed herein may be unsuitable for investors depending on their specific investment objectives and financial situation. Information contained in the material has been obtained from sources believed to be reliable, but not guaranteed. You should note that the materials are provided “as is” without any express or implied warranties. Past performance is not a guarantee of future results. All investments involve a degree of risk, including the risk of loss. No part of RBA’s materials may be reproduced in any form, or referred to in any other publication, without express written permission from RBA. Links to appearances and articles by Richard Bernstein, whether in the press, on television or otherwise, are provided for informational purposes only and in no way should be considered a recommendation of any particular investment product, vehicle, service or instrument or the rendering of investment advice, which must always be evaluated by a prospective investor in consultation with his or her own financial adviser and in light of his or her own circumstances, including the investor’s investment horizon, appetite for risk, and ability to withstand a potential loss of some or all of an investment’s value. Investing is subject to market risks. Investors acknowledge and accept the potential loss of some or all of an investment’s value. Views represented are subject to change at the sole discretion of Richard Bernstein Advisors LLC. Richard Bernstein Advisors LLC does not undertake to advise you of any changes in the views expressed herein.
For more news, information, and analysis, visit the ETF Strategist Channel.