
By Adam Grossman, CFA
SUMMARY
- Earnings for Q3 were slightly better than expected.
- The roller coaster in bond yields affected stocks during October and November, in our view.
- We think bond yields have peaked and so we remain optimistic.
Earnings and Interest Rate Outlooks are Positive, In Our View.
“If a tree falls in the forest and no one is around to hear it, does it make a noise?”
Looking at Q3 2023 earnings, we believe that companies largely painted a picture of guarded optimism based on their earnings and guidance. However, what investors initially heard were concerns about an interest rate-led recession taking a toll on longer term earnings, evident by the market weakness we saw in October. Markets then rebounded strongly in November driven largely by the decline in bond yields. Stable earnings and falling yields have been a good combination for stocks, in our view.
Companies Reported Better Than Expected Earnings Growth in Q3
At RiverFront, we use 3 ‘earnings principles’ (detailed here in our 9/12/23 strategic view) to create a framework for “Bottom-Up” analysis. Applying this framework to Q3:
- Estimates Matter: There are 2 positive messages from Analysts this quarter, in our view. The first is that 2023’s earnings have improved as companies reported. The other is that estimates for next year have held steady. This is actually atypical; Analysts are often too optimistic, leading to a decline in future earnings over time. This pattern was seen in both the 2023 and 2024 numbers, shown in the adjacent chart, which fell during the first half. Also worth noting is the gap between the two lines since analysts are expecting significant earnings growth in 2024. We think this is a positive signal, especially given the recession and rate concerns that are prevalent in the market.
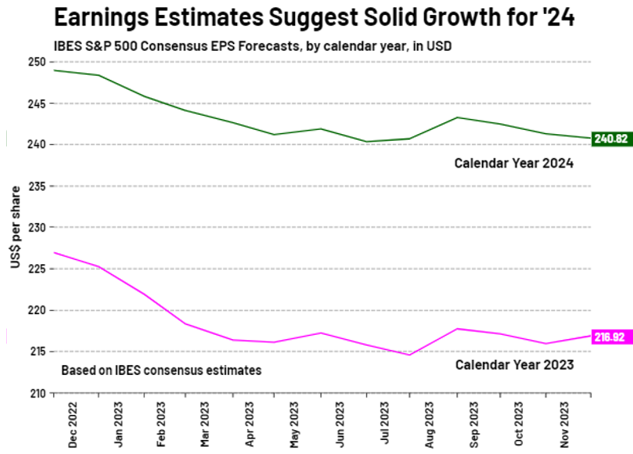
Source: LSEG Datastream, RiverFront. Data weekly as of December 1, 2023. Chart shown for illustrative purposes.
- Surprises Matter: Across all the sectors in the S&P 500 except Energy, earnings surprises for the quarter were positive on average. Consumer discretionary, technology and communication services experienced especially strong surprises, but financials, materials and industrials were also strong. Guidance was somewhat mixed but still generally positive, as analysts are maintaining their growth expectations in the coming year.
Source: LSEG Datastream, RiverFront. Data weekly as of November 29, 2023. Chart shown for illustrative purposes.
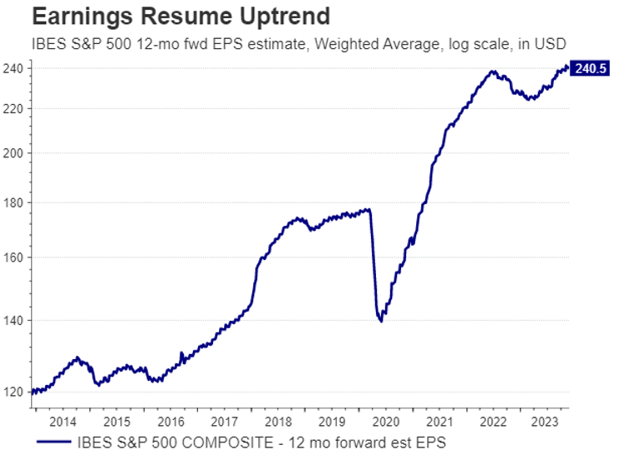
- Trends Matter: Earnings trends are also positive. S&P 500 earnings have resumed their uptrend following the dip in 2022 (see chart, right). We think the resumption of the uptrend is especially encouraging given the recent macro backdrop of higher rates and inflation that would ordinarily be weighing earnings down. Corporate America has done a good job of navigating a difficult environment, in our view. Taking these principles together, and looking ahead to the fourth quarter, we believe earnings are painting a relatively constructive picture for US stocks.
The Magnitude of the Move in Interest Rates Overshadowed the Impact of Earnings
What we think was extraordinary about the earnings season was the outsized importance that interest rates played on the market reactions. Looking at the chart below, we can see how 10-year bond yields (note the inverted scale) moved in lockstep with stocks. The reversal in 10-year Treasury yields in November (orange line in the chart) was the major catalyst for the rebound in the S&P 500. In our view, the influence of bond yields was unusually strong because the move in yields was so dramatic. In general, the relationship between stocks and bond yields makes sense to us for two reasons. First, uncertainty around the economic impact of higher rates often leads to some contraction in PE multiples (as happened in October) and thus the relieving of that concern to the recovery in November. Second, the level of yields can determine where investors put their money. Over the past decade, low rates forced investors into equities, a tailwind that is no longer present since current yield levels, though lower in November, are still high by the standard of the last 10 years.
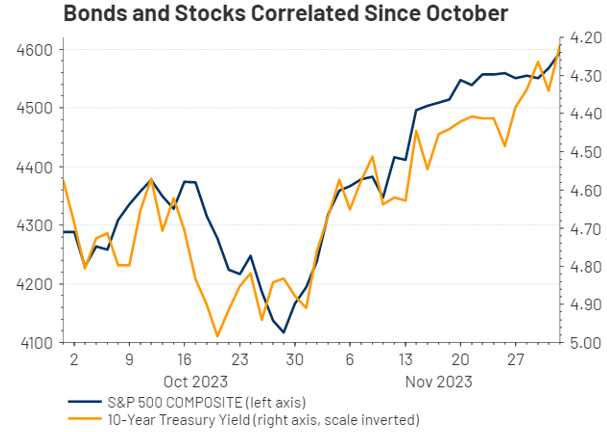
Source: LSEG Datastream, RiverFront. Data daily as of December 1, 2023. Chart shown for illustrative purposes.
Portfolio Conclusions: We Remain Overweight US Stocks
From a portfolio perspective, we continue to favor stocks over bonds, reflecting a growing optimism about earnings and a cautious optimism about the recent decline in interest rates. While we believe the decline in rates might have been too sharp and too fast, we also believe that declining inflation is making higher rates (6% or higher) less likely. These two beliefs form our base case that bond yields have likely peaked.
What we believe is critical for our investment selections is to continue to focus on sectors and stocks where growth is evident, such as mega-cap technology, and sectors with valuations that are less stretched, such as energy. As always, we stand ready to risk-manage should earnings or the economy take a turn for the worse.
Risk Discussion: All investments in securities, including the strategies discussed above, include a risk of loss of principal (invested amount) and any profits that have not been realized. Markets fluctuate substantially over time and have experienced increased volatility in recent years due to global and domestic economic events. Performance of any investment is not guaranteed. In a rising interest rate environment, the value of fixed-income securities generally declines. Diversification does not guarantee a profit or protect against a loss. Investments in international and emerging markets securities include exposure to risks such as currency fluctuations, foreign taxes and regulations, and the potential for illiquid markets and political instability. Please see the end of this publication for more disclosures.
Important Disclosure Information:
The comments above refer generally to financial markets and not RiverFront portfolios or any related performance. Opinions expressed are current as of the date shown and are subject to change. Past performance is not indicative of future results and diversification does not ensure a profit or protect against loss. All investments carry some level of risk, including loss of principal. An investment cannot be made directly in an index.
Information or data shown or used in this material was received from sources believed to be reliable, but accuracy is not guaranteed.
This report does not provide recipients with information or advice that is sufficient on which to base an investment decision. This report does not take into account the specific investment objectives, financial situation or need of any particular client and may not be suitable for all types of investors. Recipients should consider the contents of this report as a single factor in making an investment decision. Additional fundamental and other analyses would be required to make an investment decision about any individual security identified in this report.
Chartered Financial Analyst is a professional designation given by the CFA Institute (formerly AIMR) that measures the competence and integrity of financial analysts. Candidates are required to pass three levels of exams covering areas such as accounting, economics, ethics, money management and security analysis. Four years of investment/financial career experience are required before one can become a CFA charterholder. Enrollees in the program must hold a bachelor’s degree.
All charts shown for illustrative purposes only. Technical analysis is based on the study of historical price movements and past trend patterns. There are no assurances that movements or trends can or will be duplicated in the future.
Stocks represent partial ownership of a corporation. If the corporation does well, its value increases, and investors share in the appreciation. However, if it goes bankrupt, or performs poorly, investors can lose their entire initial investment (i.e., the stock price can go to zero). Bonds represent a loan made by an investor to a corporation or government. As such, the investor gets a guaranteed interest rate for a specific period of time and expects to get their original investment back at the end of that time period, along with the interest earned. Investment risk is repayment of the principal (amount invested). In the event of a bankruptcy or other corporate disruption, bonds are senior to stocks. Investors should be aware of these differences prior to investing.
In general, the bond market is volatile, and fixed income securities carry interest rate risk. (As interest rates rise, bond prices usually fall, and vice versa). This effect is usually more pronounced for longer-term securities). Fixed income securities also carry inflation risk, liquidity risk, call risk and credit and default risks for both issuers and counterparties. Lower-quality fixed income securities involve greater risk of default or price changes due to potential changes in the credit quality of the issuer. Foreign investments involve greater risks than U.S. investments, and can decline significantly in response to adverse issuer, political, regulatory, market, and economic risks. Any fixed-income security sold or redeemed prior to maturity may be subject to loss.
Technology and internet-related stocks, especially of smaller, less-seasoned companies, tend to be more volatile than the overall market.
Index Definitions:
Standard & Poor’s (S&P) 500 Index measures the performance of 500 large cap stocks, which together represent about 80% of the total US equities market.
Definitions:
Earnings per share (EPS) is calculated as a company’s profit divided by the outstanding shares of its common stock. The resulting number serves as an indicator of a company’s profitability. It is common for a company to report EPS that is adjusted for extraordinary items and potential share dilution.
Treasury bond yields (or rates) are tracked by investors for many reasons. The yields are paid by the U.S. government as interest for borrowing money via selling the bond. The 10-year Treasury yield is closely watched as an indicator of broader investor confidence. Because Treasury bonds (along with bills and notes) carry the full backing of the U.S. government, they are viewed as one of the safest investments.
Mega cap is a designation for the largest companies in the investment universe as measured by market capitalization. While the exact thresholds change with market conditions, mega cap generally refers to companies with a market capitalization above $200 billion.
RiverFront Investment Group, LLC (“RiverFront”), is a registered investment adviser with the Securities and Exchange Commission. Registration as an investment adviser does not imply any level of skill or expertise. Any discussion of specific securities is provided for informational purposes only and should not be deemed as investment advice or a recommendation to buy or sell any individual security mentioned. RiverFront is affiliated with Robert W. Baird & Co. Incorporated (“Baird”), member FINRA/SIPC, from its minority ownership interest in RiverFront. RiverFront is owned primarily by its employees through RiverFront Investment Holding Group, LLC, the holding company for RiverFront. Baird Financial Corporation (BFC) is a minority owner of RiverFront Investment Holding Group, LLC and therefore an indirect owner of RiverFront. BFC is the parent company of Robert W. Baird & Co. Incorporated, a registered broker/dealer and investment adviser.
To review other risks and more information about RiverFront, please visit the website at riverfrontig.com and the Form ADV, Part 2A. Copyright ©2023 RiverFront Investment Group. All Rights Reserved. ID 3263799
For more news, information, and analysis, visit the ETF Strategist Channel.
