

SUMMARY
- RiverFront believes treasury yields will be higher for longer, so…
- … we prefer technology stocks with strong cash flow…
- … and energy stocks with strong balance sheets.
Last summer, we produced a Strategic View that discussed how our equity team uses our discounted cash flow (DCF) tool. As a quick refresher, a DCF tool looks at future estimated cash flows produced by a company and discounts them to current value to determine that stock’s ‘intrinsic value’, or its fair price given our views on the economy and company. The purpose of this publication was not only to give a peek behind the curtain, but also to provide a foundation for further discussions of our equity selection. In this Strategic View, we will take that foundation and apply it to the current market environment, touching on why we are currently favoring certain technology and energy-related themes in RiverFront’s portfolio positioning.
The Fed is Important… But so is Perspective on a Company’s Fundamentals
Market commentary tends to be laser-focused on Fed Policy, and with good reason. As we discussed in our DCF piece last July, interest rates are a key input to our intrinsic value analyses. Importantly, we do not simply plug in current interest rates, but instead use our team’s forward-looking rate forecasts. Our outlook on rates and credit spreads should directly affect how we think about companies that rely on financing, as well as setting the opportunity costs for being in bonds versus stocks.
Today, RiverFront believes there will be fewer rate cuts in 2024 than market consensus. As such, we are using higher interest rates in our forecasts. We believe this allows us to identify stocks that are better insulated from the volatility in bond yields we have seen over the past several months, and provides an element of conservatism to our forecasts of companies’ future value.
US Stock Selection in 2024: Tech and Energy Are Standouts
With a better understanding of the relationship between the Fed and our equity valuations, we can look at our current selection views. Specifically, there are two key themes we want to focus on today: cash flow-generating US technology and energy companies.
Technology: Pairing Strong Cash Flow Generation and Growth can Help Mitigate Interest Rate Sensitivity, In Our View
We find the technology sector to be an area where strong revenue growth prospects are abundant. When paired with strong cash flow generation and growth, certain tech companies are attractive investments, in our view.
Digging into this idea, let’s look at returns and cash flows over the last five years. Chart 1 (top of next page) breaks the S&P 500 Technology sector into two groups; blue bars represent the 20 highest-performing stocks in this universe over the past 5 years, while the gray bars represent the lowest 20. The orange bar represents the average for the entire tech sector. From this chart, we can ascertain why cash flow matters so much to technology. The highest-performing stocks produced over 2x the free cash flow-per-share of the lowest-performing stocks, while also having a much higher five-year free cash flow growth rate[1].
[1] Free cash flow represents cash flow after accounting for operating and financial cash outflows.
When we look at this dynamic through our DCF framework, it makes sense to us. Since we are “discounting” cash flows to the present to get an intrinsic value, the value of a dollar earned today is worth more than a dollar earned further in the future.
This fact is especially important in technology investing; generally, intrinsic value for tech is based primarily on future earnings (and cash flow) growth, which is less valuable in higher interest rate environments. However, if a company has promising growth opportunities AND is also generating strong cash flows today, the negative effects of higher interest rates on valuation tend to be mitigated by the value of the current cash flows. Further, these cash flows allow companies to self-fund operations without having to depend on tapping the capital markets, the cost of which tends to be higher as interest rates rise.
Looking at the five-year growth rates, we can see that the top twenty companies have also been able to grow their free cash flows over the past five years, while the bottom twenty’s cash flows shrunk. When extrapolating the cash flows out into the future, the past ability of a company to grow their cash flows provides a basis for future growth, in our view. Additionally, a track record of sustained growth justifies the use of a higher future rate of growth in our DCF tool, resulting in a higher intrinsic value. Simply put, we believe the profitability and growth of these companies will last longer than the market is pricing in. While Chart 1 is backward-looking, we believe the trends it illustrates will continue in 2024.
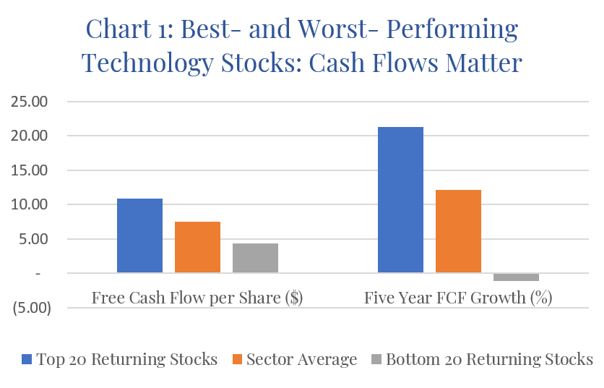
Source: S&P 500, RiverFront; trailing twelve months, as of February 15, 2024. Chart shown for illustrative purposes only. Past performance is no indication of future results.
Energy: Low Relative Production Costs and Strong Balance Sheets Boost Profits
The past year has been a rough period for US energy stocks, as oil prices fell from the multi-year highs of 2022. However, we still believe that the sector is well positioned moving forward. We estimate US shale wells can produce oil for about $60 a barrel. Since we expect oil prices to average around $80 per barrel, these wells should be very profitable. Applying this belief to an intrinsic value analysis, the basis for our equity valuation is the cash flows generated from elevated oil prices.
However, in our view, the big differentiator between individual energy stocks’ potential for growth comes down to the health of their balance sheets, and specifically their debt rating and amount of debt. This is because less-indebted companies – and those with lower costs of servicing that debt – will be more able to make strategic capital allocation decisions to take advantage of any distress caused by elevated interest rates. From a DCF perspective, these companies tend to have a lower interest expense burden, which can equate to less of a drag on free cash flow. Unlike technology companies, we typically assign a low future revenue growth rate to energy companies, so near-term cash flows make up a large amount of intrinsic value.
Conclusion: We Like US Technology and Energy… But Selection Matters
One of the benefits of using DCF analysis is it gives us the ability to directly compare our intrinsic value estimates of companies across different sectors, even if the drivers of that value differs greatly across sectors. When doing this comparison, US Technology (with a focus on positive cash flow) and US energy (with a focus on strong balance sheets) appear as attractive themes to us for 2024. Within our shorter horizon portfolios these themes are played more broadly, using mainly ETFs and some individual stocks. For our longer horizon portfolios, we gain more focused exposure to these themes using a higher percentage of individual stocks.
For more news, information, and analysis, visit the ETF Strategist Channel.
Risk Discussion: All investments in securities, including the strategies discussed above, include a risk of loss of principal (invested amount) and any profits that have not been realized. Markets fluctuate substantially over time and have experienced increased volatility in recent years due to global and domestic economic events. Performance of any investment is not guaranteed. In a rising interest rate environment, the value of fixed-income securities generally declines. Diversification does not guarantee a profit or protect against a loss. Investments in international and emerging markets securities include exposure to risks such as currency fluctuations, foreign taxes and regulations, and the potential for illiquid markets and political instability. Please see the end of this publication for more disclosures.
Important Disclosure Information:
The comments above refer generally to financial markets and not RiverFront portfolios or any related performance. Opinions expressed are current as of the date shown and are subject to change. Past performance is not indicative of future results and diversification does not ensure a profit or protect against loss. All investments carry some level of risk, including loss of principal. An investment cannot be made directly in an index.
Information or data shown or used in this material was received from sources believed to be reliable, but accuracy is not guaranteed.
This report does not provide recipients with information or advice that is sufficient on which to base an investment decision. This report does not take into account the specific investment objectives, financial situation or need of any particular client and may not be suitable for all types of investors. Recipients should consider the contents of this report as a single factor in making an investment decision. Additional fundamental and other analyses would be required to make an investment decision about any individual security identified in this report.
The comments above are subject to change and are not intended as investment recommendations. There is no representation that an investor will or is likely to achieve positive returns, avoid losses or experience returns as discussed for various market classes.
Chartered Financial Analyst is a professional designation given by the CFA Institute (formerly AIMR) that measures the competence and integrity of financial analysts. Candidates are required to pass three levels of exams covering areas such as accounting, economics, ethics, money management and security analysis. Four years of investment/financial career experience are required before one can become a CFA charterholder. Enrollees in the program must hold a bachelor’s degree.
All charts shown for illustrative purposes only. Technical analysis is based on the study of historical price movements and past trend patterns. There are no assurances that movements or trends can or will be duplicated in the future.
Dividends are not guaranteed and are subject to change or elimination.
Stocks represent partial ownership of a corporation. If the corporation does well, its value increases, and investors share in the appreciation. However, if it goes bankrupt, or performs poorly, investors can lose their entire initial investment (i.e., the stock price can go to zero). Bonds represent a loan made by an investor to a corporation or government. As such, the investor gets a guaranteed interest rate for a specific period of time and expects to get their original investment back at the end of that time period, along with the interest earned. Investment risk is repayment of the principal (amount invested). In the event of a bankruptcy or other corporate disruption, bonds are senior to stocks. Investors should be aware of these differences prior to investing.
In general, the bond market is volatile, and fixed income securities carry interest rate risk. (As interest rates rise, bond prices usually fall, and vice versa). This effect is usually more pronounced for longer-term securities). Fixed income securities also carry inflation risk, liquidity risk, call risk and credit and default risks for both issuers and counterparties. Lower-quality fixed income securities involve greater risk of default or price changes due to potential changes in the credit quality of the issuer. Foreign investments involve greater risks than U.S. investments, and can decline significantly in response to adverse issuer, political, regulatory, market, and economic risks. Any fixed-income security sold or redeemed prior to maturity may be subject to loss.
Technology and internet-related stocks, especially of smaller, less-seasoned companies, tend to be more volatile than the overall market.
Index Definitions:
Standard & Poor’s (S&P) 500 Index measures the performance of 500 large cap stocks, which together represent about 80% of the total US equities market.
Definitions:
Discounted cash flow (DCF) refers to a valuation method that estimates the value of an investment using its expected future cash flows. DCF analysis attempts to determine the value of an investment today, based on projections of how much money that investment will generate in the future.
The Federal Reserve System (FRS) is the central bank of the United States. Often simply called the Fed, it is arguably the most powerful financial institution in the world. It was founded to provide the country with a safe, flexible, and stable monetary and financial system. The Fed has a board that is comprised of seven members. There are also 12 Federal Reserve banks with their own presidents that represent a separate district.
The term cash flow refers to the net amount of cash and cash equivalents being transferred in and out of a company. Cash received represents inflows, while money spent represents outflows.
The discount rate is the interest rate the Federal Reserve charges commercial banks and other financial institutions for short-term loans. The discount rate is applied at the Fed’s lending facility, which is called the discount window. A discount rate can also refer to the interest rate used in discounted cash flow (DCF) analysis to determine the present value of future cash flows. In this case, investors and businesses can use the discount rate for potential investments.
Free cash flow to equity is a measure of how much cash is available to the equity shareholders of a company after all expenses, reinvestment, and debt are paid. FCFE is a measure of equity capital usage.
An exchange-traded fund (ETF) is a type of pooled investment security that operates much like a mutual fund. Typically, ETFs will track a particular index, sector, commodity, or other assets, but unlike mutual funds, ETFs can be purchased or sold on a stock exchange the same way that a regular stock can.
Interest rate sensitivity is a measure of how much the price of a fixed-income asset will fluctuate as a result of changes in the interest rate environment. Securities that are more sensitive have greater price fluctuations than those with less sensitivity. This type of sensitivity must be taken into account when selecting a bond or other fixed-income instrument the investor may sell in the secondary market. Interest rate sensitivity affects buying as well as selling.
RiverFront Investment Group, LLC (“RiverFront”), is a registered investment adviser with the Securities and Exchange Commission. Registration as an investment adviser does not imply any level of skill or expertise. Any discussion of specific securities is provided for informational purposes only and should not be deemed as investment advice or a recommendation to buy or sell any individual security mentioned. RiverFront is affiliated with Robert W. Baird & Co. Incorporated (“Baird”), member FINRA/SIPC, from its minority ownership interest in RiverFront. RiverFront is owned primarily by its employees through RiverFront Investment Holding Group, LLC, the holding company for RiverFront. Baird Financial Corporation (BFC) is a minority owner of RiverFront Investment Holding Group, LLC and therefore an indirect owner of RiverFront. BFC is the parent company of Robert W. Baird & Co. Incorporated, a registered broker/dealer and investment adviser.
To review other risks and more information about RiverFront, please visit the website at riverfrontig.com and the Form ADV, Part 2A. Copyright ©2024 RiverFront Investment Group. All Rights Reserved. ID 3397823