

By Doug Sandler, CFA
SUMMARY
Over the next five to seven years, we believe…
- Bonds will have an increased role in balanced portfolios.
- Today’s high cash rates will not last.
- Muted stock returns will require more active management.
- Headwinds for international outperformance will remain.
Putting our Outlook 2024 and Refreshed CMAs to Use in Portfolios
RiverFront recently published its refreshed capital market assumptions (CMAs) for 2024 (see summary here, from January 9th). We view long-term (5-7 year forward) capital forecasts as a useful part of the allocation process, helping to identify and monitor the important long-range valuation drivers for markets.
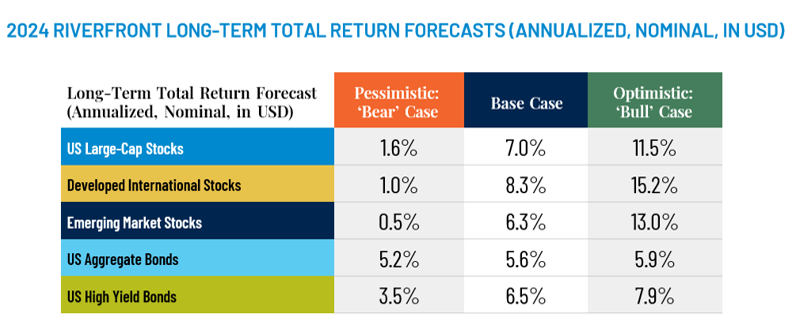
Shown for illustrative purposes. The table above depicts RiverFront’s predictions for 2024 using three scenarios (Pessimistic (Bear), Base, and Optimistic (Bull)). The assessment is based on RiverFront’s Investment Team’s views and opinions as of December 18, 2023. Each case is hypothetical and is not based on actual investor experience. The returns above are not an indication of RiverFront portfolio or product performance.
From these updated CMAs we believe that long-term asset allocators should consider the following:
1. Increasing bond allocations and adjusting the tenor of that exposure: The TINA market, which stood for There Is No Alternative, existed when bond yields were nearly non-existent, and investors had little choice beyond equities to garner positive returns. However, with the recent rise in yields, investors now have more attractive longer-term investment options in the fixed income arena. In our ‘base case’ scenario we expect bonds, as represented by the Bloomberg Aggregate Index, to return 5.6% annually over the next 5-to-7 years, which is competitive with our 7% return expectations for US large-cap stocks. We have generally increased our duration (sensitivity to interest rates) in the fixed income side of our balanced portfolios as yields have risen.
These more attractive opportunities for long-term investors must be balanced, in our view, with our more cautious near-term opinion on the path of interest rates, which may need to move higher as the market recalibrates its’ view of Fed action in the face of a resilient economy. We will opportunistically look to add to specific maturities along the curve, preferring shorter-maturity bonds given the inverted yield curve. We prefer taking credit risk (corporate bonds) over interest rate risk (Treasury bonds) right now, as we think the economy will continue to grow and keep default rates low.
2. Becoming ‘pickier’ in equities, especially international: Our long-term equity CMAs of 7% for large-cap US (US), 8.3% for developed international (DI) and 6.3% for emerging markets (EM) may seem low. However, we believe that there are opportunities to amplify these returns through effective security selection. Below are a few of our favorite selection themes within US and International equities:
A. US – P.A.T.T.Y.: In our view, the current valuation and interest rate environment is less conducive to all stocks, but ripe with opportunities for security selection. We expect those companies that can generate consistent and growing dividends and cashflow yields will garner premium valuations over their peers. This investment strategy is best epitomized by the acronym P.A.T.T.Y. – ‘Pay Attention To The Yield’. We see attractive P.A.T.T.Y. opportunities in industries like technology, energy, mining, financials, and healthcare.
Chart 1: US Earnings Have Nearly Doubled European Earnings Since 2008
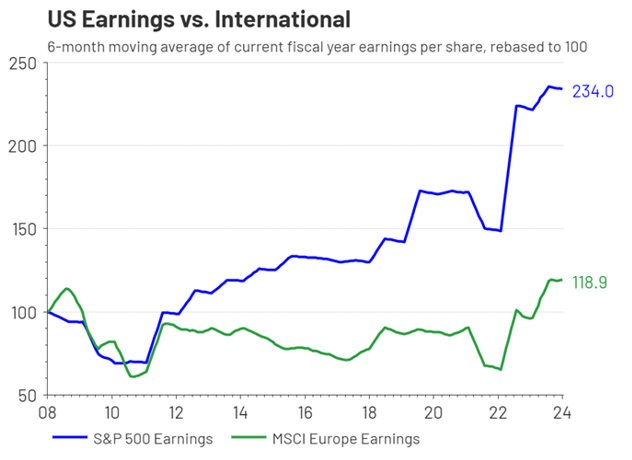
Source: LSEG Datastream, RiverFront; data monthly, as of 1.1.2024. Chart left shown for illustrative purposes only. Past performance is no indication of future results.
B. Developed International – Headwinds for outperformance remain. DI remains attractively valued relative to the US using traditional metrics but may remain so for several reasons. We struggle with International and especially European companies’ inability to consistently drive earnings growth. As can be seen in Chart 1 above, MSCI Europe earnings have grown significantly less than the S&P 500 since the financial crisis in 2008. This makes a huge difference when we think about intrinsic value. While Europe appears “cheap” by traditional valuation metrics, the ‘intrinsic value’ (adjusting valuation for future earnings growth) is not as attractive as it seems. Eventually, Europe may be able to translate the positive macro-economic backdrop into consistent earnings growth like its US peers, but we are not fully convinced that that will happen anytime soon. Additionally, we believe structural growth remains lower and inflation issues stickier in most international economies relative to the US. Therefore, we continue to be selective abroad and favor higher quality companies in the region. We like value-oriented industries, like financials and energy, and companies that have durable competitive advantages that allow them to pass inflation on to their customers.
C. Steering away from China in Emerging Markets: EM may struggle given that mainland China and its’ Hong-Kong-listed companies continue to dominate the emerging market index, representing more than 26% of its make-up as of December 31, 2023. In our view, the relative attractiveness of investing in China has declined significantly in recent years due to rising government intervention, declining transparency, poor demographics, and the unpredictability of foreign shareholder rights. These structural issues are being compounded by conflicts over trade, a slowing Chinese economy and growing political tensions with the US. For these reasons, we believe a more active approach to emerging market investing is appropriate. We anticipate much of China’s economic losses will represent opportunities for other emerging market economies. For example, sophisticated technology producers with closer allegiances to the US, such as Korea and Taiwan, will likely benefit from the intellectual property ‘Cold War’ between the US and China. In addition, smaller manufacturing hubs such as Malaysia and Vietnam will likely see increased demand from the US and Western allies relocating supply chains away from China.
3. Putting Excess Cash to Work: In our view, the Federal Reserve put holders of cash and cash equivalents on alert in December 2023 when not a single Fed official projected short-term rates rising above their current levels of 5.25-5.5%. In fact, the Fed forecasted a year-end Fed Funds target of 4.5-4.75% in the ‘dot plot’ that was released at their December 13th meeting. This would represent three 25 basis point cuts in 2024. Investors believe that the Fed will be even more aggressive than that in 2024 and are expecting between five and six cuts, with the first cut occurring at their May 1st meeting, according to the Fed Fund futures market. While the timing and degree of rate cuts is still uncertain, we do believe that 5+% short-term rates now have an expiration date, and that date is sometime in 2024.
With rate cuts on the horizon, putting excess cash to work in either stocks or bonds becomes increasingly important. A recent NDR Research report suggests to us that investors may want to make portfolio adjustments prior to any action by the Fed since ten-year bonds historically appreciate 75 to 100 basis points three months prior to the initial cut in interest rates.
Risk Discussion: All investments in securities, including the strategies discussed above, include a risk of loss of principal (invested amount) and any profits that have not been realized. Markets fluctuate substantially over time, and have experienced increased volatility in recent years due to global and domestic economic events. Performance of any investment is not guaranteed. In a rising interest rate environment, the value of fixed-income securities generally declines. Diversification does not guarantee a profit or protect against a loss. Investments in international and emerging markets securities include exposure to risks such as currency fluctuations, foreign taxes and regulations, and the potential for illiquid markets and political instability. Please see the end of this publication for more disclosures.
Important Disclosure Information:
The comments above refer generally to financial markets and not RiverFront portfolios or any related performance. Opinions expressed are current as of the date shown and are subject to change. Past performance is not indicative of future results and diversification does not ensure a profit or protect against loss. All investments carry some level of risk, including loss of principal. An investment cannot be made directly in an index.
Information or data shown or used in this material was received from sources believed to be reliable, but accuracy is not guaranteed.
This report does not provide recipients with information or advice that is sufficient on which to base an investment decision. This report does not take into account the specific investment objectives, financial situation or need of any particular client and may not be suitable for all types of investors. Recipients should consider the contents of this report as a single factor in making an investment decision. Additional fundamental and other analyses would be required to make an investment decision about any individual security identified in this report.
The comments above are subject to change and are not intended as investment recommendations. There is no representation that an investor will or is likely to achieve positive returns, avoid losses or experience returns as discussed for various market classes.
Chartered Financial Analyst is a professional designation given by the CFA Institute (formerly AIMR) that measures the competence and integrity of financial analysts. Candidates are required to pass three levels of exams covering areas such as accounting, economics, ethics, money management and security analysis. Four years of investment/financial career experience are required before one can become a CFA charterholder. Enrollees in the program must hold a bachelor’s degree.
All charts shown for illustrative purposes only. Technical analysis is based on the study of historical price movements and past trend patterns. There are no assurances that movements or trends can or will be duplicated in the future.
Stocks represent partial ownership of a corporation. If the corporation does well, its value increases, and investors share in the appreciation. However, if it goes bankrupt, or performs poorly, investors can lose their entire initial investment (i.e., the stock price can go to zero). Bonds represent a loan made by an investor to a corporation or government. As such, the investor gets a guaranteed interest rate for a specific period of time and expects to get their original investment back at the end of that time period, along with the interest earned. Investment risk is repayment of the principal (amount invested). In the event of a bankruptcy or other corporate disruption, bonds are senior to stocks. Investors should be aware of these differences prior to investing.
In general, the bond market is volatile, and fixed income securities carry interest rate risk. (As interest rates rise, bond prices usually fall, and vice versa). This effect is usually more pronounced for longer-term securities). Fixed income securities also carry inflation risk, liquidity risk, call risk and credit and default risks for both issuers and counterparties. Lower-quality fixed income securities involve greater risk of default or price changes due to potential changes in the credit quality of the issuer. Foreign investments involve greater risks than U.S. investments, and can decline significantly in response to adverse issuer, political, regulatory, market, and economic risks. Any fixed-income security sold or redeemed prior to maturity may be subject to loss.
Investing in foreign companies poses additional risks since political and economic events unique to a country or region may affect those markets and their issuers. In addition to such general international risks, the portfolio may also be exposed to currency fluctuation risks and emerging markets risks as described further below.
Changes in the value of foreign currencies compared to the U.S. dollar may affect (positively or negatively) the value of the portfolio’s investments. Such currency movements may occur separately from, and/or in response to, events that do not otherwise affect the value of the security in the issuer’s home country. Also, the value of the portfolio may be influenced by currency exchange control regulations. The currencies of emerging market countries may experience significant declines against the U.S. dollar, and devaluation may occur subsequent to investments in these currencies by the portfolio.
Foreign investments, especially investments in emerging markets, can be riskier and more volatile than investments in the U.S. and are considered speculative and subject to heightened risks in addition to the general risks of investing in non-U.S. securities. Also, inflation and rapid fluctuations in inflation rates have had, and may continue to have, negative effects on the economies and securities markets of certain emerging market countries.
Technology and internet-related stocks, especially of smaller, less-seasoned companies, tend to be more volatile than the overall market.
Index Definitions:
Standard & Poor’s (S&P) 500 Index measures the performance of 500 large cap stocks, which together represent about 80% of the total US equities market.
Bloomberg US Aggregate Bond Index measures the performance of the US investment grade bond market. The index invests in a wide spectrum of public, investment-grade, taxable, fixed income securities in the United States – including government, corporate, and international dollar-denominated bonds, as well as mortgage-backed and asset-backed securities, all with maturities of more than one year.
MSCI Emerging Markets Index captures large and mid cap representation across approximately 26 Emerging Markets (EM) countries.
MSCI Europe Index captures large and mid cap representation across 15 developed markets (DM) countries in Europe. DM countries in Europe include Austria, Belgium, Denmark, Finland, France, Germany, Ireland, Italy, the Netherlands, Norway, Portugal, Spain, Sweden, Switzerland, and the UK.
Definitions:
Fed funds futures are financial futures contracts based on the federal funds rate and traded on the Chicago Mercantile Exchange (CME) operated by CME Group Inc. (CME). The federal funds rate is the rate banks charge each other for overnight loans of reserves on deposit with the Federal Reserve. The Fed uses the federal funds rate to control U.S. money supply and influence the cost of credit throughout the economy. The prices of Fed funds futures reflect market expectations about future changes in the Fed funds rate based on the target ranges the Fed sets as a key tool of its monetary policy.
Treasury bond yields (or rates) are tracked by investors for many reasons. The yields are paid by the U.S. government as interest for borrowing money via selling the bond. The 10-year Treasury yield is closely watched as an indicator of broader investor confidence. Because Treasury bonds (along with bills and notes) carry the full backing of the U.S. government, they are viewed as one of the safest investments.
RiverFront Investment Group, LLC (“RiverFront”), is a registered investment adviser with the Securities and Exchange Commission. Registration as an investment adviser does not imply any level of skill or expertise. Any discussion of specific securities is provided for informational purposes only and should not be deemed as investment advice or a recommendation to buy or sell any individual security mentioned. RiverFront is affiliated with Robert W. Baird & Co. Incorporated (“Baird”), member FINRA/SIPC, from its minority ownership interest in RiverFront. RiverFront is owned primarily by its employees through RiverFront Investment Holding Group, LLC, the holding company for RiverFront. Baird Financial Corporation (BFC) is a minority owner of RiverFront Investment Holding Group, LLC and therefore an indirect owner of RiverFront. BFC is the parent company of Robert W. Baird & Co. Incorporated, a registered broker/dealer and investment adviser.
To review other risks and more information about RiverFront, please visit the website at riverfrontig.com and the Form ADV, Part 2A. Copyright ©2024 RiverFront Investment Group. All Rights Reserved. ID 3341255
For more news, information, and analysis, visit the ETF Strategist Channel.