
We have said it many times this year: the markets are volatile. Investors, from experience, know how volatility can feel. There are many emotional ebbs and flows in markets. Investors feel great during a volatile, steep increase over a short period of time, and feel the opposite emotion during a subsequent, rapid decline.
If 2022 has proven anything, it’s that volatility comes in waves. To put it into perspective, 2022 has already surpassed 2021 in the number of “outlier” days experienced. Our readers know that Canterbury defines an “outlier” day as a trading day of more than +/-1.50%. For the calendar year 2021, the S&P 500 had 18 outlier days, with 8 occurring in the first six months of the year and 10 happening in the latter six months. So far in 2022, the S&P 500 has experienced 21 outlier days. On average, that is almost one outlier day every three trading days.
The result of the outlier days this year has been several substantial moves in the markets, both up and down. The chart below shows how quickly and to what extent different moves have been made in the S&P 500 so far this year.
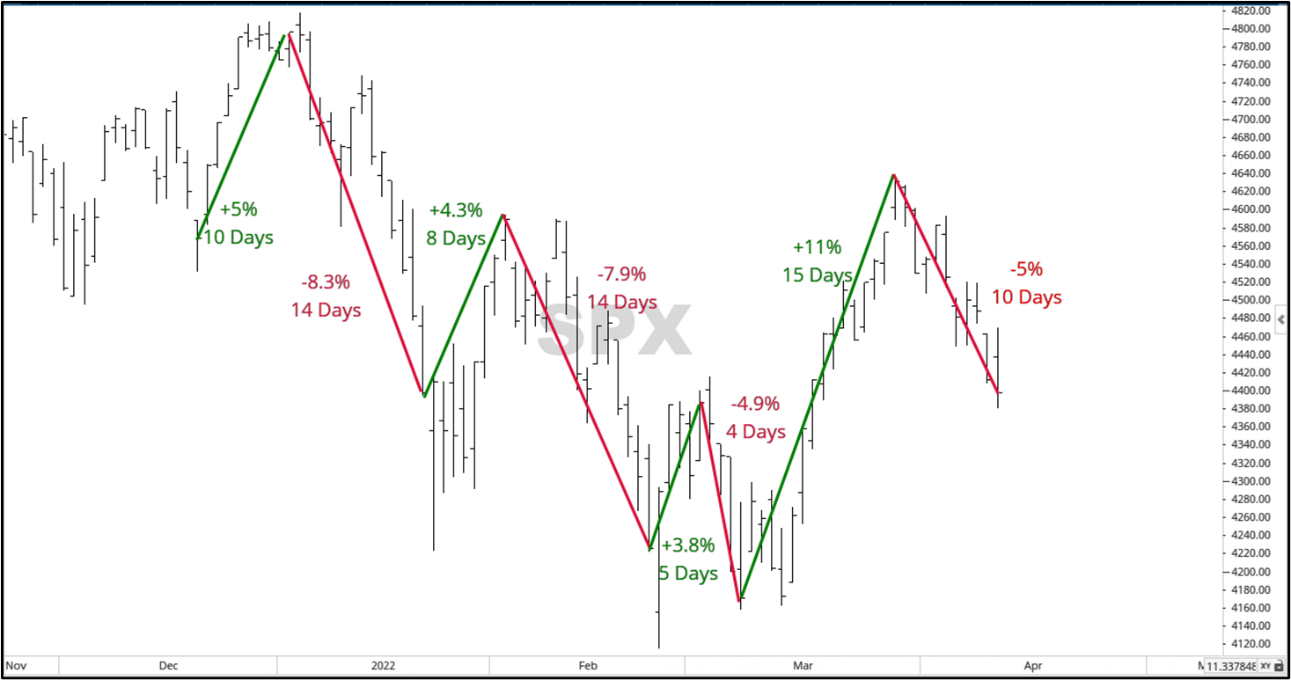
Source Canterbury Investment Management using Optuma Technical Analysis Software
Investors felt the pain of two -8% drops that each occurred in under three weeks and separated by eight days, followed by the relief of an 11% rise. Make no mistake about it, an 11% rise over 15 days is just as bearish as an 8% drop. In volatile markets, volatility works in both directions.
Intraday Trading Ranges
The volatility in markets has applied not only to the daily movements and larger movements over a few weeks but also to intraday fluctuations. As an example, there was a day in late January when the S&P 500 was down as much as -4% during the day before finishing the day UP 0.28%. The median intraday move in 2022 has been a swing of 1.77% (the difference between the greater of the daily high or yesterday’s close and the daily low). That would be the equivalent of a day starting up about +0.9% and finishing down -0.9%. In 2021, the median intraday fluctuation was half of that, at an intraday fluctuation of 0.86%. For perspective, there has only been ONE trading day in 2022 less than 0.86% intraday fluctuation, and that day was the first trading day of the year.
Shift from Growth to Value
Our friend and expert economist, Bob Barone, reminded us of a quote this morning: “there’s always a bull market somewhere.” While the general markets have fluctuated greatly, the vast fluctuation has mostly come from “growth” oriented stocks and sectors. The S&P 500 Value Index (using ETF: SPYV) is down about -1.00% year-to-date. S&P 500 Growth (ETF: SPYG), on the other hand, is down close to -15% year-to-date. That is some disparity. The table below shows Canterbury’s risk-adjusted sector rankings. Value and “defensive” oriented sectors tend to be leading, while growth and “offensive” sectors are lagging. Each sector’s S&P 500 cap weighting is also shown.
| Sector | Risk-Adjusted Ranking | S&P 500 Weighting (%) |
| Utilities | 1 | 2.9 |
| Energy | 2 | 4.2 |
| Staples | 3 | 6.5 |
| Health Care | 4 | 14.2 |
| Basic Materials | 5 | 2.7 |
| Real Estate | 6 | 2.9 |
| S&P 500 | ||
| Discretionary | 7 | 11.9 |
| Info Tech | 8 | 26.6 |
| Industrials | 9 | 7.9 |
| Financials | 10 | 11 |
| Communications | 11 | 9.2 |
Source: Risk-adjusted ranking from Canterbury Investment Management Volatility-Weighted-Relative-Strength ranking. Weightings pulled from SPY SPDR ETF website.
The lagging five market sectors (discretionary, info tech, industrials, financials, and communications) make up 67% (two-thirds) of the S&P 500’s weightings. The leading 6 sectors account for the other one-third. Heavier, growth-oriented sectors such as the sectors of info tech, communications, and consumer discretionary have led the market’s volatility. The three market sectors currently up year-to-date (energy, utilities, staples) only make up 14% of the index.
Bottom Line
The markets have been volatile, and the volatility has been created mostly by growth stocks. Not mentioned in this update, but bonds have also been volatile. Any portfolio combination of market indexes and bond holdings has not looked diversified. Long-term treasury bonds are off by nearly -17% on the year and 10-year treasuries aren’t much better and off by -10%. Those are both worse than the S&P 500.
The year’s shift from growth to value has created opportunity, particularly for adaptive portfolio strategy. Most fixed, traditional portfolios have holdings that lean towards growth-oriented stocks, just by nature of holding market index funds. They also carry bond holdings. Adaptive portfolios can rotate away from bonds and growth, and into the less volatile value sectors and alternatives.
For more market trends, visit ETF Trends.
