
Charts, charts, charts. Let’s briefly examine what is happening in the markets through the use of a few charts.
Chart #1: The Nasdaq 100
The Nasdaq 100 index represents mostly technology stocks, such as Apple, Microsoft, Amazon, Tesla, Google, etc. You can see in the chart below, that the Nasdaq, or technology stocks, have had a strong showing of relative performance verses the S&P 500. Studies do show that the markets perform better when the Nasdaq is leading. This has to do with the fact that the S&P 500’s weighting is heavily favored towards technology-related stocks.
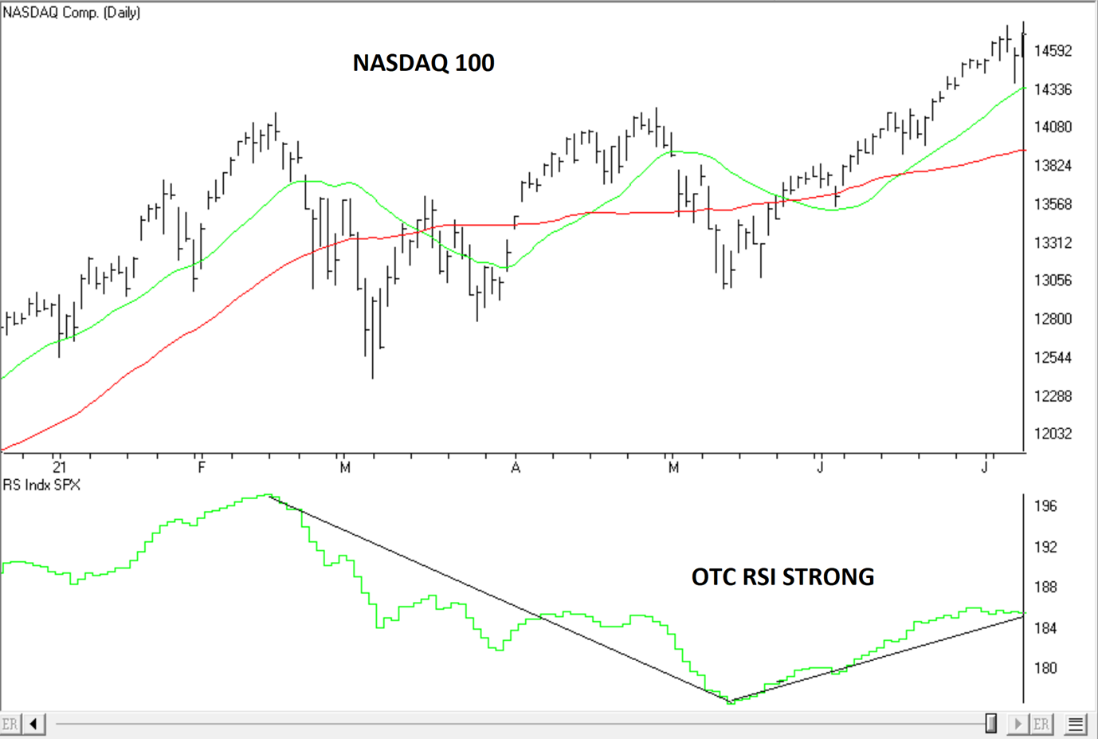
Chart #1- Nasdaq has strong relative performance versus S&P 500, source AIQ
Chart #2: Advance/Decline Line
If we look at a chart of the S&P 500, along with its stocks-only Advance Decline Line, we will see that the market index is rising while the A/D Line is flat. The A/D Line shows market breadth, how many stocks are going up versus how many stocks are declining. A strong, rising market will be coupled with a rising A/D Line. This means that a rising tide is lifting all ships. A weak, rising market would show a declining A/D Line. Right now, the S&P 500 is rising, while the A/D Line is flattening out. This chart was provided by David Vomund, an expert market technician.
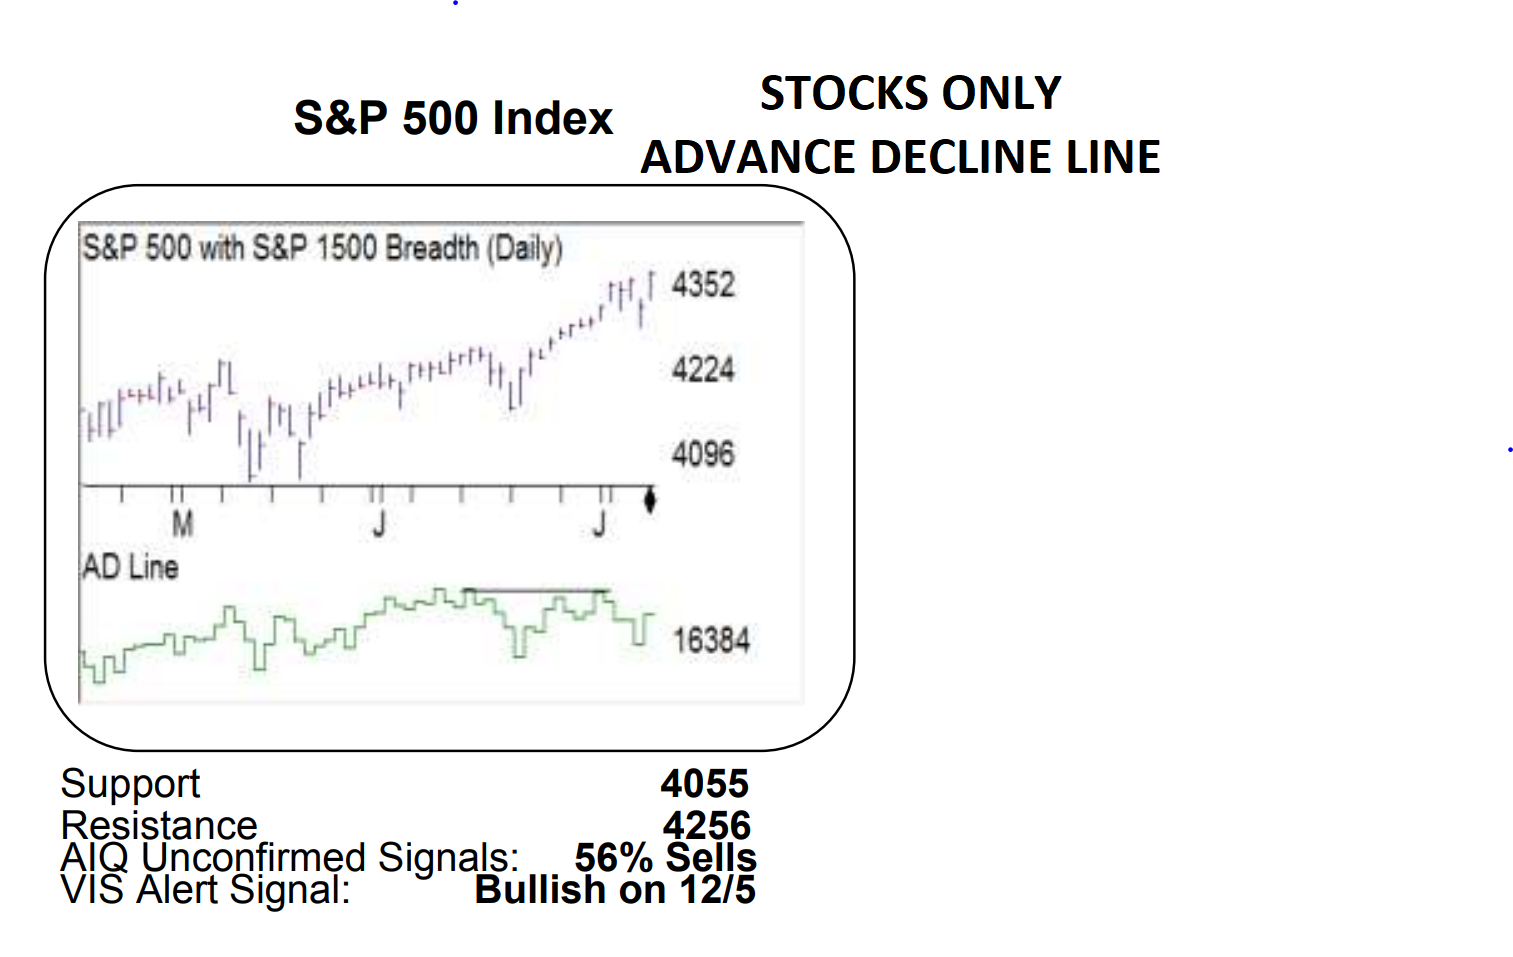
Chart #2- Advance Decline is flattening in a rising market, source: David Vomund
Chart #3: S&P 500 Equal Weight
We just stated that the S&P 500 is rising and putting in new highs while the A/D Line is flat, meaning that not all stocks are rising. In fact, the S&P 500 is made up of about 40% technology-related stocks, which we showed in chart #1 were very strong recently. Many of the largest stocks in the S&P 500 are technology stocks. So, a few large tech stocks are carrying the market in the short-term. This is shown by using an equal weight S&P 500 where all 500 company stocks are given the same allocation. The Equal weight index, like the A/D Line, is flat over the past month.
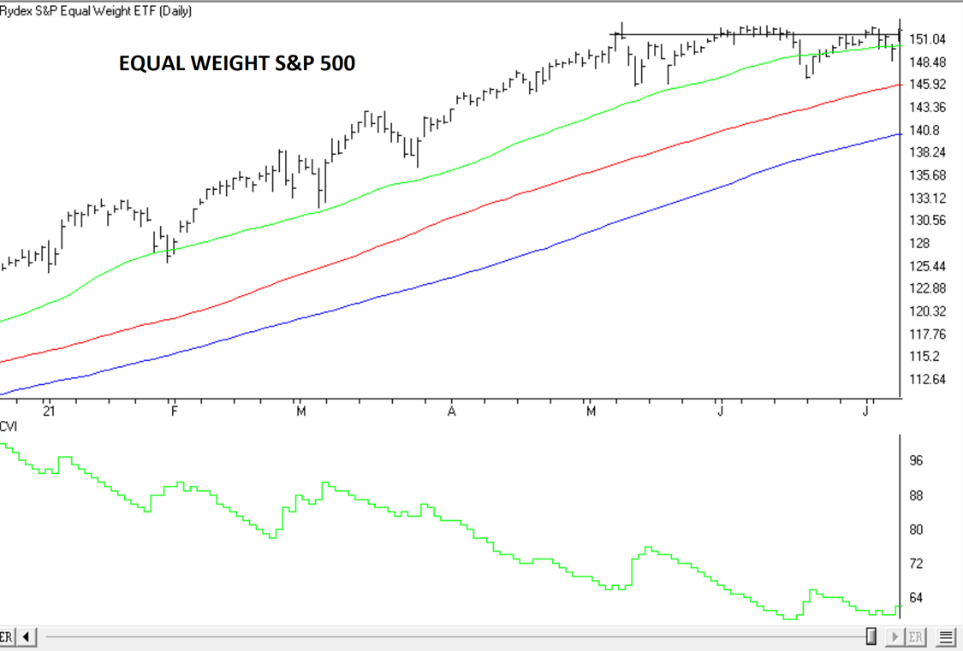
Chart #3- S&P 500 Equal Weight Index is flat while the market is rising, source: AIQ
Bottom Line
From the few charts displayed above, the bottom line is this: technology is leading, and in fact, carrying the markets higher. Technology-related stocks make up the largest portion of the S&P 500 index and have outperformed over the past month. We can see from the charts, and more specifically, the Advance-Decline Line that not as many stocks are participating in the recent rise of equities. An equal weight index, as opposed to the tech-heavy capitalization weighted index, has been moved flat since early May, much like the A/D Line.
Now, just because a rising tide isn’t currently lifting all ships does not mean doom-and-gloom for the markets. The A/D line is flat- not declining. This is also just a short-term movement. We will be concerned if the A/D Line begins falling while the market rises over a longer period of time. Technology is also leading the markets, which is typically a positive sign.
