
Confluence Investment Management offers various asset allocation products which are managed using “top down,” or macro, analysis. We publish asset allocation thoughts on a bi-weekly basis, updating the report every other Monday, along with an accompanying podcast.
As shown in the chart below, U.S. field production has fluctuated quite a bit over the last century. From 1920 to 1970, output grew approximately 4.2% per year, reaching 9.6 million barrels per day (bpd). However, output then fell and plateaued, despite the incentives to produce during the period’s high prices. Beginning in about 1985, production began what appeared to be an inexorable decline in the face of public policy and the limits of the available technology. To many people’s surprise, output suddenly reversed and started growing rapidly again during the Great Financial Crisis of 2008-2009, driven by new technologies such as hydraulic fracturingand horizontal drilling that opened up previously untappable shale formations. U.S. production jumped at an annual rate of 8.7% from 2009 to 2019, reaching almost 13.0 million bpd.
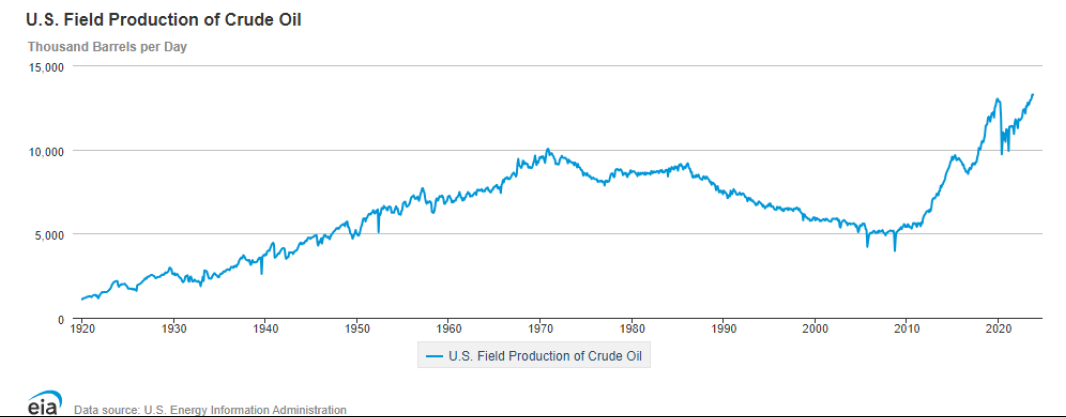
Obviously, the pandemic was a shock to the global economy. With the collapse in demand, oil prices actually turned negative for a short time in early 2020. More importantly, U.S. output fell sharply and appeared to stagnate. Much of the stagnation reflected reduced investment in new exploration and development as investors demanded better capital discipline and a stronger focus on profitability after the many bankruptcies of shale drillers during the period of 2009-2019. Stronger environmental regulations, which aimed to shift the economy away from fossil fuels, also discouraged drilling. Many investors began to question whether the industry could ever grow again.
In mid-2023, U.S. oil output began to accelerate in earnest, likely reflecting the incentive of high energy prices at the time and an unexpected second wind from technology improvements. Press reports say fracking and other shale technologies as well as operating approaches have simply improved more than expected. In any case, U.S. oil output has now reached 13.3 million bpd.
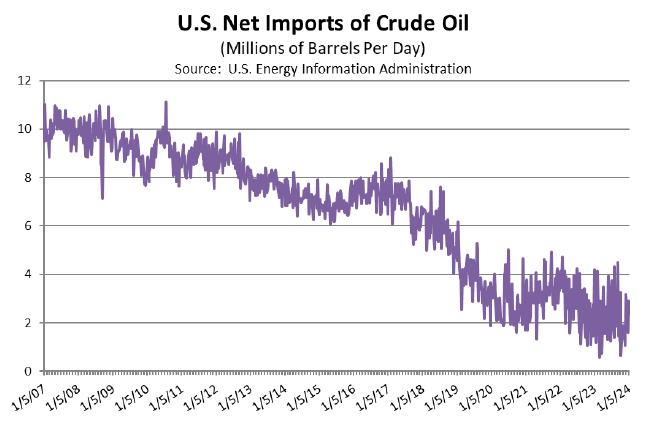
For the global economy, booming U.S. oil output doesn’t just mean that the country has become the world’s largest producer (which it has). As shown in the chart below, it also means that the U.S. has been able to significantly scale back its imports of foreign oil.
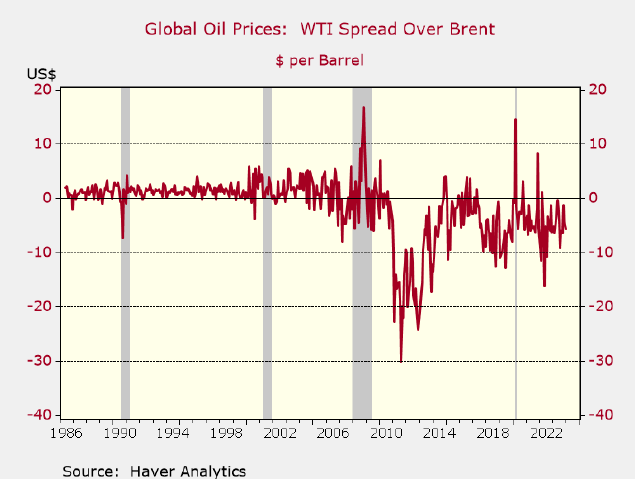
Surging U.S. oil production has altered global pricing dynamics. For example, before the shale boom, U.S. domestic oil prices (represented by the West Texas Intermediate) were typically slightly higher than foreign prices (represented by Brent Crude). For the last decade, however, the rich supply of domestic oil has held down U.S. prices. Reduced U.S. import demand and new laws allowing U.S. oil exports have also improved supplies for other countries. As shown in the following chart, Brent Crude now tends to trade several dollars higher than WTI. Nevertheless, the U.S. changes haven’t been enough to totally offset the fact that Saudi Arabia and its partners in OPEC and OPEC+ are withholding supplies in order to boost prices.
Going forward, the unexpected rebound of U.S. oil output and exports signifies that American production could help keep a lid on global prices for an extended period, even as the OPEC+ countries continue to withhold barrels. What could change the outlook? One key risk that we’re focused on is the possibility of a geopolitical crisis that disrupts supplies from a major foreign producer or exporter. If such a crisis occurs outside the Middle East, the availability of excess output capacity in Saudi Arabia and the rest of OPEC+ could potentially fill in the gap. If the crisis disrupts Middle Eastern supplies, however, the result would likely be a spike in global prices despite the renewed U.S. output boom and excess production capacity in the region.
For more news, information, and analysis, visit the ETF Strategist Channel.
Past performance is no guarantee of future results. Information provided in this report is for educational and illustrative purposes only and should not be construed as individualized investment advice or a recommendation. The investment or strategy discussed may not be suitable for all investors. Investors must make their own decisions based on their specific investment objectives and financial circumstances. Opinions expressed are current as of the date shown and are subject to change.
This report was prepared by Confluence Investment Management LLC and reflects the current opinion of the authors. It is based upon sources and data believed to be accurate and reliable. Opinions and forward-looking statements expressed are subject to change. This is not a solicitation or an offer to buy or sell any security.
