
The U.S. manufacturing complex out produces every other country in the world except China. In terms of manufacturing value added, which is basically the value of the output minus the costs of the input, the U.S. produces almost twice as much as Japan, more than three times as much as Germany, and five times as much as India. To really understand the power and influence of U.S. manufacturing, it is important to be familiar with the basic steps an economy takes from relatively simple manufacturing, such as textiles and apparel, all the way to advanced pharmaceuticals and electronics. After all, if a country wants to maintain a high and growing standard of living, the economy must continue to move up the value chain of services and manufacturing as well as continually improve productivity.
When agrarian economies first industrialize, they tend to focus on the lowest value-added items. Once those economies reach a certain size and manufacturing skillset, they can then advance to middle level value added, just has China has done in recent decades and Japan did before that.
The next phase is to move to the high value-added areas, where the U.S. is today. For example, the U.S. leads global manufacturing value added in 7 of 16 categories, many of which are in the highest value-added industries, such as the chemicals and pharmaceuticals industry, the computer, electronic, and optical products industry, and the motor vehicles, trailers, and semi-trailers industry.
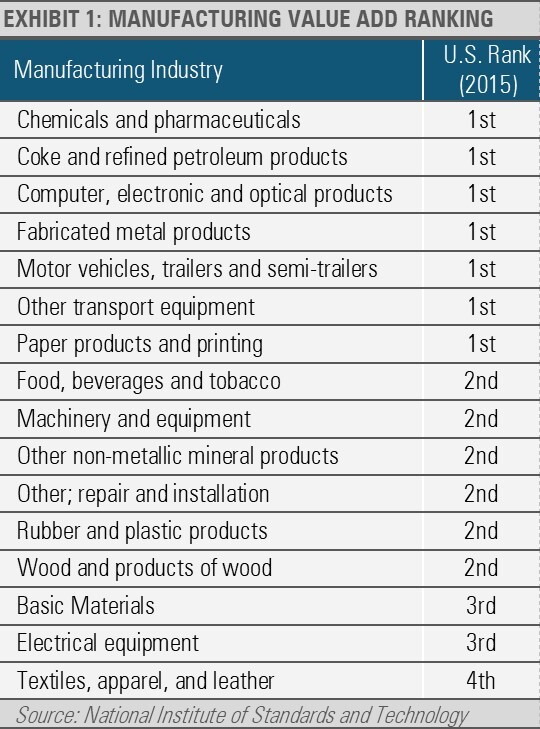
While the U.S. is not the world’s largest producer of low value add textiles, that makes sense given that high value-added industries offer higher wages and ultimately better living standards. Though the U.S. has largely outsourced T-shirt manufacturing, the U.S. still ranks fourth globally in the textile, apparel, and leather manufacturing industry, which is evidence of the depth and breadth of the massive U.S. manufacturing complex.
Clearly the U.S. manufacturing complex has a solid foundation. In order to see what could be next, we will focus on a few important attributes that drive growth, such as an open economy where supply, demand, and innovation are driven by the private sector, a growing labor force, and deep capital markets to fund new investments.
The following table lists the top five manufacturing economies ranked by manufacturing value added. Also shown is the size of the labor force, the growth rate of the labor force from 2015-2021, and the Index of Economic Freedom Ranking, an annual guide published by The Heritage Foundation that is correlated with economic wellbeing.
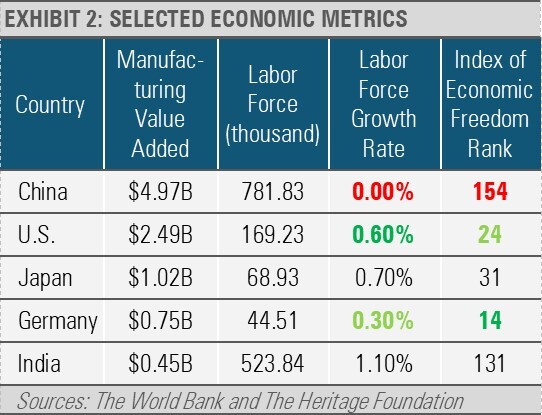
Only the U.S. enjoys a large manufacturing complex, a large and growing labor force, and high economic freedom. Combined, these fundamental factors create a solid foundation on which the U.S. can continue to develop and further our manufacturing complex and capabilities.
Of the countries that rank above the U.S. in the Index of Economic Freedom, which attempts to measure the level of control a person has to their own labor and property, none can really compare to the U.S.’s size and abilities. For example, in fourteenth place, Germany is slightly ahead of the U.S. in economic freedom, but their manufacturing complex is a fraction of the U.S.’s size. While Chinese manufacturing gets a lot of attention, it ranks poorly on economic freedom and its aging labor force is shrinking, not growing like the more vibrant U.S. labor force. Furthermore, the U.S. benefits from the deepest capital markets in the world with plenty of liquidity to fund future investments.
As one might expect with the largest economy on the planet, the U.S. has the largest stock market and bond market in the world and is the top destination for foreign direct investment. With nearly $5 trillion flowing into the U.S. in 2021 alone, according to the International Monetary Fund, the willingness of global investors to send their capital to the U.S. is likely at least partly driven by the positive fundamental attributes described above.
Looking ahead, we also see further U.S. manufacturing sector growth resulting from the continued fracturing in global trade. With a stable global order built on the Bretton Woods agreement that led to the U.S. dollar being the global reserve currency, and global shipping protected by the U.S. security blanket, businesses were free to develop an efficient global trade network.
This global trade network became optimized by Just in Time (JIT) inventory systems pioneered by global manufacturers like the Toyota Motor Corporation. JIT is a system that focuses on reduced costs and efficiency by lessening the reliance on parts in inventory, and counting on only the right parts and other inputs arriving at the manufacturing plant just as they are to be utilized. This process reduces the need to store excess parts and materials, thereby increasing manufacturing capacity and reducing storage costs.
While these JIT systems proved to be highly efficient and profitable, they also proved to be extremely fragile. This fragility was exposed by the COVID-19 pandemic, subsequent lockdowns, and supply chain disruptions. With the global trade order becoming more fractured and multi-polar, these weaknesses are now exacerbated.
In turn, manufacturers are becoming more focused on supply chain flexibility and resiliency rather than optimizing efficiency. Manufacturers want to be closer to the end consumer for resilience and to adapt more quickly to changing trends.
In addition, with labor costs having risen in China and other Asian nations, these countries may no longer be the low-cost producer of intermediate and final manufactured goods. Between low labor costs in Mexico, enhanced automation domestically, and more resilient supply chains that cross borders and not oceans or continents, on-shoring and near-shoring of industrial production should continue to increase.
Pulling these natural processes ahead further are the CHIPS and Science Act and the Inflation Reduction Act (IRA), both passed last August. The Chips Act includes incentives for investing in semiconductor production, while the IRA includes incentives for the production of electric vehicles and using domestically produced content.
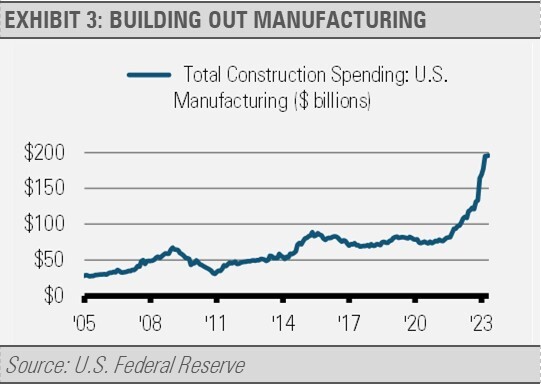
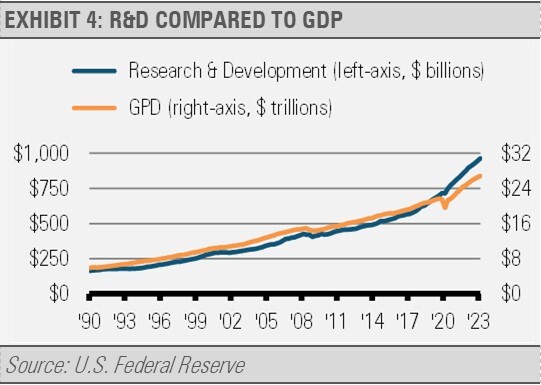
Largely because of these trends as well as government incentives, construction spending on manufacturing facilities has absolutely skyrocketed since late 2021 (exhibit 3). At the same time, investments in research and development (R&D) are booming. Productivity growth is one of the keys to long-term economic growth, and R&D investments are key to increasing that productivity growth over time. Since the late 1980s, R&D spending had been lagging economic growth. However, that gap began to close after 2015 and the growth rate in R&D spending now exceeds that of the economy itself (exhibit 4).
Combined, business investment is at an all-time high as U.S businesses are clearly prioritizing investment in the future. Not only is the U.S. labor force growing in an environment of economic freedom, but investments in new plant and equipment as well as R&D stand to make that labor force increasingly productive. While near-term economic challenges persist and may intensify over the coming months, long-term trends in labor force growth, economic freedom, and business investment remain exceedingly positive. Putting all this together leads us to believe that the U.S. is about to embark on a new era of economic growth driven by a growing and increasingly productive private sector.
DISCLOSURES
Any forecasts, figures, opinions or investment techniques and strategies explained are Stringer Asset Management, LLC’s as of the date of publication. They are considered to be accurate at the time of writing, but no warranty of accuracy is given and no liability in respect to error or omission is accepted. They are subject to change without reference or notification. The views contained herein are not to be taken as advice or a recommendation to buy or sell any investment and the material should not be relied upon as containing sufficient information to support an investment decision. It should be noted that the value of investments and the income from them may fluctuate in accordance with market conditions and taxation agreements and investors may not get back the full amount invested.
Past performance and yield may not be a reliable guide to future performance. Current performance may be higher or lower than the performance quoted.
The securities identified and described may not represent all of the securities purchased, sold or recommended for client accounts. The reader should not assume that an investment in the securities identified was or will be profitable.
Data is provided by various sources and prepared by Stringer Asset Management, LLC and has not been verified or audited by an independent accountant.
For more news, information, and analysis, visit the ETF Strategist Channel.
