

By Kevin Nicholson, CFA
SUMMARY
- The Fed is walking the monetary policy ‘tightrope’, in our view.
- The Trend is positive both domestically and internationally.
- Crowd Sentiment in extreme optimism zone but could reset with a pullback.
Mixed View Between US and International Markets
![]()
Since our last ‘Three Tactical Rules’ update on November 20, 2023, equity markets have rallied further as central banks have signaled the end of their rate hiking campaigns. In the case of the S&P 500, it continues to make all-time highs as investors have cheered the end of rate hikes. Combine that market optimism with an economy that grew at 3.3% year-over-year in Q4 2023, an unemployment rate under 4%, and core inflation under 3%, and you have ‘Goldilocks’ for financial markets. As it pertains to our tactical rules of “Don’t Fight the Fed”, “Don’t Fight the Trend”, and “Beware of the Crowd at Extremes” they are collectively now rated as a flashing yellow light.
Under the hood, a lot that changed within the three rules to generate this rating. Over the last two months, the Fed has moved from a “red light” to a “flashing green light”, the trend has moved from a “flashing green light” to a “green light”, and the crowd from a “flashing yellow light” to a “red light”. From a purely quantitative perspective, our indicators have deteriorated in the last two months, moving from a “green light” to a “flashing yellow light”. The combination of improved qualitative indicators but more extreme optimism leads us to a generally “neutral” overall rating this time around.
Don’t Fight the Fed: Fed is Walking the Tightrope
The Fed has left the effective fed funds steady at 5.33% for four consecutive meetings, despite the preferred inflation gauge of core PCE coming down more rapidly than economists predicted. In our last ‘Three Rules’ update, core PCE was 3.7%; today it stands at 2.9%, which is now entering the zip code of the fed’s 2% target. Additionally, core PCE has fallen by 1.3 percentage points since the Fed raised the effective fed funds rate last July, resulting in ‘real’ (inflation-adjusted) yields rising by a similar degree and tightening financial conditions further.
At first glance, one would expect the Fed to cut rates sooner rather than later, given the progress made on inflation in a short period of time. However, as we pointed out earlier, equity markets are at all-time highs, the economy has been growing faster than its 2.5% post-Financial Crisis average and the Atlanta Fed is anticipating this growth to continue, currently forecasting Q1 2024 GDP at 4.2%. Additionally, the consumer continues to spend, due to the strong labor market. Thus, if the Fed cuts rates when the economy has proven that it can thrive without cuts, it runs the risk of supercharging an already strong economy and possibly reigniting inflation in the process. Therefore, in lieu of rate cuts, the Fed did the next best thing in our view, by signaling additional rate hikes were no longer on the table. The Fed will remain data dependent regarding both the timing and magnitude of future rate cuts.
While we believe the Fed is once again ‘our friend’, we only expect the Fed to cut 1 or 2 times later in 2024 – versus the consensus of 5 times. Regardless of the magnitude or timing, the bottom line is the Fed is not raising rates and is looking for the moment to cut; thus our tactical rule of “Don’t Fight the Fed” has now improved to a flashing green light.
Like the Fed, international central banks such as the Bank of England (BOE) and the European Central Bank (ECB) have also halted further rate hikes. However, unlike the Fed, they are not contending with an economy growing at or faster than pre-COVID-19 levels. While both central banks are hesitant to cut rates too soon, we believe that the ECB will be the first to cut, as it has the weakest economy of the three major central banks. Thus, the BOE and the ECB are currently also rated at a flashing green light.
Don’t Fight the Trend: Trend Continues to be Strong (Domestically)

The trend on the S&P 500, which we define as the 200-day moving average, has accelerated since our last update, due to the index making an all-time high above 4900. The trend is rising at an annualized rate of 24% and will remain positive for most of 2024, if the S&P 500 averages above 4900, which we believe is likely. Historically, a positive trend is good for future stock returns, and we believe that this time is no different. Thus, domestically our rule of “Don’t Fight the Trend” is signaling a green light, which calls for stock exposure above long-term targets.
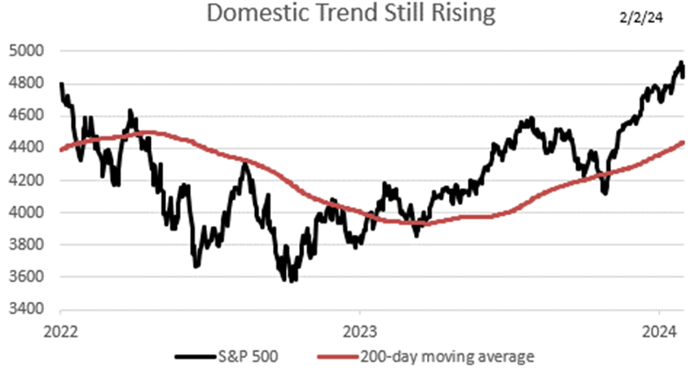
Source: Bloomberg, RiverFront. Data daily as of February 2, 2024. Chart right shown for illustrative purposes. Not indicative of RiverFront portfolio performance. Index definitions are available in the disclosures.
International Trend

Internationally, the trend of the MSCI All Country World ex-US index turned positive in mid-December. The international primary trend is currently rising at an annualized rate of 5.4%. Like its domestic counterpart, we believe the international trend will remain positive for most of 2024 if current levels were to hold, which we expect. Therefore, the international trend is signaling a flashing green light.
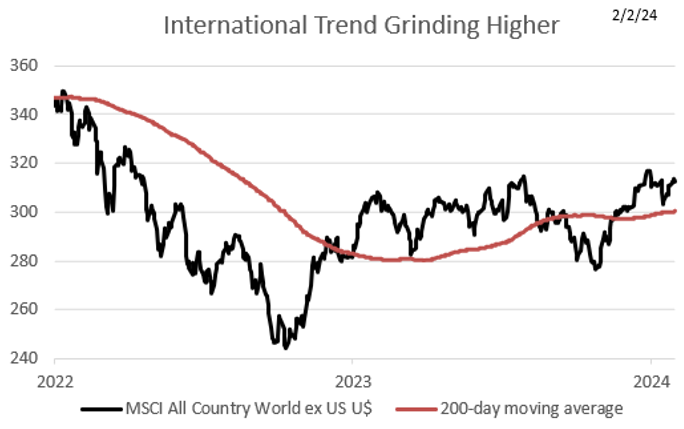
Source: Bloomberg, RiverFront. Data daily as of February 2, 2024. Chart right shown for illustrative purposes. Not indicative of RiverFront portfolio performance. Index definitions are available in the disclosures.
Beware of the Crowd at Extremes: Optimism Has Hit an Extreme

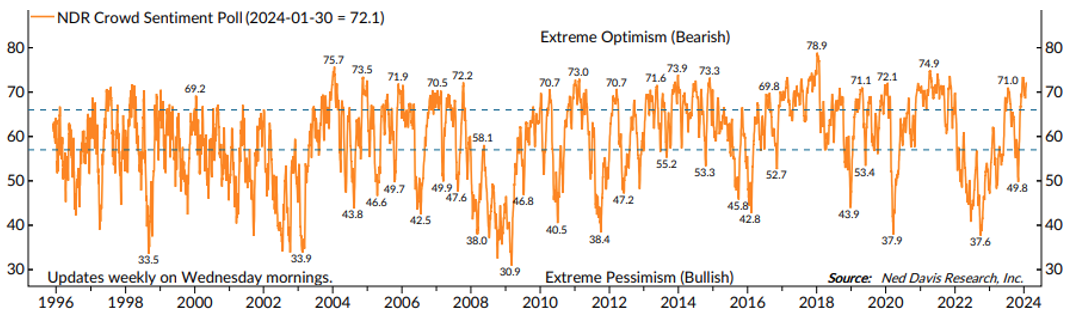
We regard Crowd Sentiment as the ‘contrarian’ indicator of the Three Tactical Rules. The chart on the next page shows a measure of investor sentiment as calculated by Ned Davis Research (NDR). When the line is high, it suggests extreme optimism, and when it is low, extreme pessimism. This is our preferred data source to measure investor psychology, which we run through our proprietary analytical framework to help draw conclusions on sentiment.
Since last December when the Fed signaled it was done with rate hikes, the crowd has been in the extreme optimism zone. Extreme optimism when viewed in isolation typically is not good for stocks, thus our qualitative rating of a “red light”. That said, a bull market typically oscillates between neutral and optimism, where a return to neutral often coincides with a brief and shallow pullback, rather than a tradable correction. Our quantitative process, which combines sentiment and trend, is giving a more neutral signal. Thus, viewing the ‘Crowd at Extremes’ through this lens only would indicate a flashing yellow light in our rating continuum. Furthermore, we believe that some of this optimism could erode this month, as February tends to be one of the worst months of the year for stocks historically.
Copyright 2024 Ned Davis Research, Inc. Further distribution prohibited without prior permission. All Rights Reserved. See NDR Disclaimer at ndr.com/copyright.html. For data vendor disclaimers refer to ndr.com/vendorinfo/. Past performance is no guarantee of future results. Shown for illustrative purposes.
Conclusion: Both our Qualitative and Quantitative Processes are Signaling a Flashing Yellow Light

The combined signals looking through both our qualitative and quantitative lenses as discussed through this piece are signaling a flashing yellow light overall, which we believe warrants a neutral to slight overweight positioning in the portfolio’s US stock composition. We believe that any market pullback we experience in the first quarter will be short-lived and relatively contained, given that stocks recently hit an all-time high, a condition that typically signals more strength to come in the market (See our Weekly from 1/29/24). Any routine pullback could help to improve the odds of positive returns going forward, as investor sentiment eases. For this reason, we are taking a ‘wait and see’ approach, while continuing to slightly favor stocks over bonds in our balanced portfolios.
Internationally, our qualitative lens is signaling a yellow light, while the quantitative lens is signaling a flashing green light. The quantitative lens is helped by a trend that is positive but not too strong. However, the international trend relative to the US remains weak, thus tempering our enthusiasm for investing in international.
For more news, information, and analysis, visit the ETF Strategist Channel.
Risk Discussion: All investments in securities, including the strategies discussed above, include a risk of loss of principal (invested amount) and any profits that have not been realized. Markets fluctuate substantially over time, and have experienced increased volatility in recent years due to global and domestic economic events. Performance of any investment is not guaranteed. In a rising interest rate environment, the value of fixed-income securities generally declines. Diversification does not guarantee a profit or protect against a loss. Investments in international and emerging markets securities include exposure to risks such as currency fluctuations, foreign taxes and regulations, and the potential for illiquid markets and political instability. Please see the end of this publication for more disclosures.
Important Disclosure Information:
The comments above refer generally to financial markets and not RiverFront portfolios or any related performance. Opinions expressed are current as of the date shown and are subject to change. Past performance is not indicative of future results and diversification does not ensure a profit or protect against loss. All investments carry some level of risk, including loss of principal. An investment cannot be made directly in an index.
Information or data shown or used in this material was received from sources believed to be reliable, but accuracy is not guaranteed.
This report does not provide recipients with information or advice that is sufficient on which to base an investment decision. This report does not take into account the specific investment objectives, financial situation or need of any particular client and may not be suitable for all types of investors. Recipients should consider the contents of this report as a single factor in making an investment decision. Additional fundamental and other analyses would be required to make an investment decision about any individual security identified in this report.
Chartered Financial Analyst is a professional designation given by the CFA Institute (formerly AIMR) that measures the competence and integrity of financial analysts. Candidates are required to pass three levels of exams covering areas such as accounting, economics, ethics, money management and security analysis.
Four years of investment/financial career experience are required before one can become a CFA charterholder. Enrollees in the program must hold a bachelor’s degree.
All charts shown for illustrative purposes only. Technical analysis is based on the study of historical price movements and past trend patterns. There are no assurances that movements or trends can or will be duplicated in the future.
Ned Davis Research (NDR) is a global provider of independent investment research, solutions and tools. Founded in 1980, NDR helps clients around the world make objective investment decisions.
Stocks represent partial ownership of a corporation. If the corporation does well, its value increases, and investors share in the appreciation. However, if it goes bankrupt, or performs poorly, investors can lose their entire initial investment (i.e., the stock price can go to zero). Bonds represent a loan made by an investor to a corporation or government. As such, the investor gets a guaranteed interest rate for a specific period of time and expects to get their original investment back at the end of that time period, along with the interest earned. Investment risk is repayment of the principal (amount invested). In the event of a bankruptcy or other corporate disruption, bonds are senior to stocks. Investors should be aware of these differences prior to investing.
In general, the bond market is volatile, and fixed income securities carry interest rate risk. (As interest rates rise, bond prices usually fall, and vice versa). This effect is usually more pronounced for longer-term securities). Fixed income securities also carry inflation risk, liquidity risk, call risk and credit and default risks for both issuers and counterparties. Lower-quality fixed income securities involve greater risk of default or price changes due to potential changes in the credit quality of the issuer. Foreign investments involve greater risks than U.S. investments, and can decline significantly in response to adverse issuer, political, regulatory, market, and economic risks. Any fixed-income security sold or redeemed prior to maturity may be subject to loss.
Investing in foreign companies poses additional risks since political and economic events unique to a country or region may affect those markets and their issuers. In addition to such general international risks, the portfolio may also be exposed to currency fluctuation risks and emerging markets risks as described further below.
Changes in the value of foreign currencies compared to the U.S. dollar may affect (positively or negatively) the value of the portfolio’s investments. Such currency movements may occur separately from, and/or in response to, events that do not otherwise affect the value of the security in the issuer’s home country. Also, the value of the portfolio may be influenced by currency exchange control regulations. The currencies of emerging market countries may experience significant declines against the U.S. dollar, and devaluation may occur subsequent to investments in these currencies by the portfolio.
Foreign investments, especially investments in emerging markets, can be riskier and more volatile than investments in the U.S. and are considered speculative and subject to heightened risks in addition to the general risks of investing in non-U.S. securities. Also, inflation and rapid fluctuations in inflation rates have had, and may continue to have, negative effects on the economies and securities markets of certain emerging market countries.
Index Definitions:
Standard & Poor’s (S&P) 500 Index measures the performance of 500 large cap stocks, which together represent about 80% of the total US equities market.
MSCI ACWI ex USA Index captures large and mid cap representation across approximately 22 of 23 developed markets (DM) countries (excluding the US) and approximately 25 emerging markets (EM) countries.
Definitions:
Personal consumption expenditures (PCE), also known as consumer spending, is a measure of the spending on goods and services by people of the United States.
The 200-day moving average is a popular technical indicator which investors use to analyze price trends. It is simply a security’s average closing price over the last 200 days.
The European Central Bank (ECB) is the central bank responsible for monetary policy of the European Union (EU) member countries that have adopted the euro currency. This currency union is known as the eurozone and currently includes 19 countries. The ECB’s primary objective is price stability in the euro area.
The Bank of England (BoE) is the central bank of the United Kingdom. The BoE oversees monetary policy and issues currency. It also regulates banks, financial firms, and payment systems. Like other central banks, the BoE may act as a lender of last resort in a financial crisis.
Interest rate sensitivity is a measure of how much the price of a fixed-income asset will fluctuate as a result of changes in the interest rate environment. Securities that are more sensitive have greater price fluctuations than those with less sensitivity. This type of sensitivity must be taken into account when selecting a bond or other fixed-income instrument the investor may sell in the secondary market. Interest rate sensitivity affects buying as well as selling.
Don’t Fight the Fed – ‘Supportive’ means the Fed’s monetary policy regarding inflation and employment is in what we believe based on our analysis to be the investors’ best interest; ‘Against’ means the Fed’s monetary policy, in our view, is going against the investors’ best interest; ‘Neutral’ means the Fed’s monetary policy is neither supportive or against the investors’ best interest in our view. Don’t Fight the Trend – Terms correlate to the 200-day moving average as it relates to the equity indexes: ‘Positive’ means that the trend is rising, ‘Flat’ means the trend is flat, ‘Negative’ means the trend is falling. Beware the Crowd at Extremes – Terms correlate to the NDR Crowd Sentiment Poll and its measurement of Extreme Optimism (Bearish), Neutral, or Extreme Pessimism (Bullish).
RiverFront Investment Group, LLC (“RiverFront”), is a registered investment adviser with the Securities and Exchange Commission. Registration as an investment adviser does not imply any level of skill or expertise. Any discussion of specific securities is provided for informational purposes only and should not be deemed as investment advice or a recommendation to buy or sell any individual security mentioned. RiverFront is affiliated with Robert W. Baird & Co. Incorporated (“Baird”), member FINRA/SIPC, from its minority ownership interest in RiverFront. RiverFront is owned primarily by its employees through RiverFront Investment Holding Group, LLC, the holding company for RiverFront. Baird Financial Corporation (BFC) is a minority owner of RiverFront Investment Holding Group, LLC and therefore an indirect owner of RiverFront. BFC is the parent company of Robert W. Baird & Co. Incorporated, a registered broker/dealer and investment adviser.
To review other risks and more information about RiverFront, please visit the website at riverfrontig.com and the Form ADV, Part 2A. Copyright ©2024 RiverFront Investment Group. All Rights Reserved. ID 3369879