
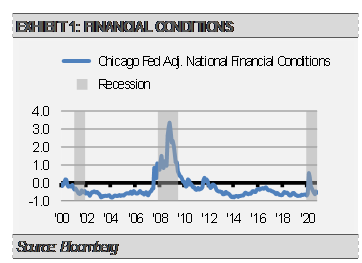
Our work suggests that there are many reasons to be optimistic about the broad economy going into 2021. In this article, we will focus on three. First, monetary and broad financial conditions, which are our primary forecasting tools, look very healthy. For example, after spiking to reflect the difficult conditions during the lockdowns this past spring, the Chicago Fed Adjusted National Financial Conditions Index has settled down to more normal levels. We think this quick recovery in financial conditions has been a major contributor to the broader economic recovery we have seen thus far. Furthermore, we expect that the recession of 2020 will be judged as the shortest recession since records began in 1854.
Secondly, leading economic indicators in aggregate suggest strong economic growth over the balance of 2021 despite some near-term softening related to the COVID-19 resurgence. COVID numbers are spiking in several regions around the world and governments have begun implementing various forms of lockdowns while individuals have curtailed entertainment and travel plans. These factors led us to reduce our expectations for economic activity in the fourth quarter of 2020 and into the first quarter of 2021. However, our leading indicators suggest a strong economic recovery will follow the current soft patch.
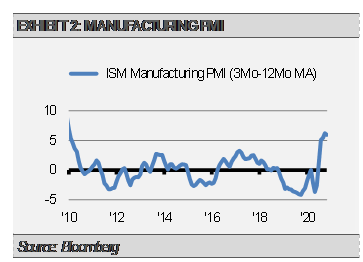
For example, the ISM Manufacturing Purchasing Manager Index (PMI) survey suggests that the manufacturing recovery continues despite COVID related restrictions. The new wave of restrictions being imposed in response to the pandemic will weigh on consumption growth over the coming months. However, with most factories relatively unaffected by those measures and inventory levels unusually lean as the customer inventories index fell to a 10-year low in November, manufacturing output can continue to grow in the months ahead. In general, when the 3-month moving average PMI is higher than the 12-month moving average PMI, economic growth is thought to be accelerating and we want to be positioned opportunistically. Conversely, when the 3-month moving average PMI is less than the 12-month moving average PMI, economic growth is thought to be slowing and we want to be positioned more cautiously. As the following graph illustrates, we are markedly in the opportunistic camp today even though the pace of improvement has slowed slightly.
Finally, broad vaccine distribution on the horizon should lead to a release of pent-up demand across multiple sectors. This pent-up demand is evident in the growth of total savings deposits. There are a number of contributing factors to this massive savings increase, such as fiscal stimulus, the forced savings resulting from shutdowns, and the speedy recovery of the labor market. Current savings is $11.5 trillion, which is nearly $1.5 trillion higher than the long-term trendline, or approximately 7% of GDP. That is nearly $1.5 trillion in excess savings that could be spent or invested as the economy reopens. Note that while lower wage earners may continue to struggle, we do expect another round of fiscal support early in the new year. Meanwhile, the broad distribution of vaccines by midyear may mean an acceleration in consumer spending as pent-up demand is released throughout the economy.

As a result, we have been positioning our Strategies to benefit from stronger than expected economic growth during 2021. More specifically, we recently increased our focus on re-opening sectors that tend to be more economically sensitive than the narrow band of industries and companies that have led the way so far in 2020. While we think the overall equity market is fairly valued, we expect equities in cyclical sectors that are trading at attractive valuations to outperform 2020’s winners by a wide margin in the months to come.
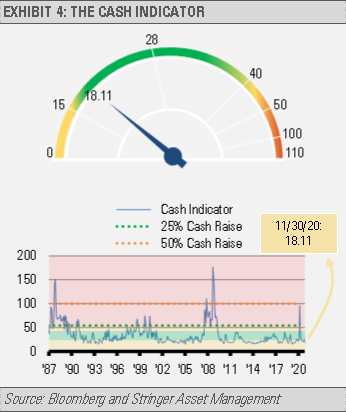
THE CASH INDICATOR
The Cash Indicator (CI) has been useful for helping us judge potential volatility. Currently, the CI is near the low end of its normal range. We should expect an increase in volatility in the coming weeks. Because the CI is far below levels that cause concern, we view near-term volatility as a buying opportunity.
DISCLOSURES
Any forecasts, figures, opinions or investment techniques and strategies explained are Stringer Asset Management, LLC’s as of the date of publication. They are considered to be accurate at the time of writing, but no warranty of accuracy is given and no liability in respect to error or omission is accepted. They are subject to change without reference or notification. The views contained herein are not to be taken as advice or a recommendation to buy or sell any investment and the material should not be relied upon as containing sufficient information to support an investment decision. It should be noted that the value of investments and the income from them may fluctuate in accordance with market conditions and taxation agreements and investors may not get back the full amount invested.
Past performance and yield may not be a reliable guide to future performance. Current performance may be higher or lower than the performance quoted.
The securities identified and described may not represent all of the securities purchased, sold or recommended for client accounts. The reader should not assume that an investment in the securities identified was or will be profitable.
Data is provided by various sources and prepared by Stringer Asset Management, LLC and has not been verified or audited by an independent accountant.
