

By DeFred Folts III, Managing Partner, Chief Investment Strategist and Eric Biegeleisen, CFA, Partner, Chief Investment Officer
Despite the recent rebound in the U.S. equity markets (the S&P 500 rose by over 9% in July), based upon our most recent model research, the U.S. economy still faces the threat of stagflation. Therefore, we continue to focus on investments that could outperform in a stagflationary environment. This includes U.S. Treasury Inflation-Protected Securities (TIPS), lower duration U.S. Treasuries, and real assets such as gold and commodities that could benefit from inflation proving to be more persistent than expected.
In July, the Federal Reserve raised short-term interest rates by 75 basis points (0.75%) for the second time in two months to combat elevated inflationary pressure. The Fed has now increased short-term interest rates four times thus far in 2022. The bond market also rallied in July (yields declined and prices increased). The yield on the 10-year U.S. Treasury fell to 2.57% in July after reaching almost 3.5% earlier in the year. On the economic front, the U.S. Gross Domestic Product (GDP) declined for the second quarter in a row prompting a debate over whether the U.S. economy may be in a recession. In addition, the Commerce Department’s Personal Consumption Expenditures (PCE) price index, which is the basis for the Fed’s inflation target, rose by 1% in June, the fastest monthly increase since 2005. The PCE rose by 6.9% from June of 2021.
Equities:
▶ U.S. Equities: U.S. equity markets rallied in July with the S&P 500 rising over 9% – its best month since November 2020. Tesla, Apple, Amazon, and Nvidia rose by over 15% during the month. However, based on our most recent model research, the U.S. economy still faces the threat of stagflation. In addition, U.S. equities remain significantly overvalued by our measures. Other factors weighing negatively on the attractiveness of U.S. equities include continued flattening of the U.S. Treasury yield curve, widening of credit spreads in the corporate bond market and elevated risk of more persistent inflationary pressure in the U.S. economy.
▶ European Equities: European equities rallied along with the U.S. equity market in July. However, Europe continues to face a plethora of challenges for the remainder of 2022, including serious inflationary pressure, widening credit spreads and negative investor psychology. In July, the European Central Bank (the ECB) raised its key interest rate by 50 basis points, the first increase in 11 years and the biggest since 2000, as it confronts surging inflation, even as the risk of recession in Europe mounts. Moreover, inflationary pressure in Europe continues to be exacerbated by Russia’s invasion of Ukraine.
▶ Japanese Equities: Our model research continues to find Japanese equities unattractive due to an inverted and flattening yield curve measure, widening credit spreads and negative investor psychology.
▶ Chinese Equities: Chinese equities are undervalued by our measure. China’s draconian zero-COVID restrictions continue to harm its economic growth prospects, the outlook for the Yuan and investor psychology. Credit spreads continue to widen in the Chinese financial markets.
▶ Indian Equities: Investors may be bracing for further tightening by the Reserve Bank of India after a surprise rate hike in May, followed by another in June to combat elevated inflation. Indian equities are also in a behavioral correction stage that continues to offset their relatively favorable economic growth prospects. A shift to more positive investor psychology alongside relief from inflationary pressures would likely help shift the outlook more positively.
Fixed Income:
▶ The bond market rallied during July (yields declined and prices increased). The yield on the 10-year U.S. Treasury fell to 2.57% in July after reaching almost 3.5% earlier in the year. The strength of the U.S. dollar against a basket of the world’s major currencies is playing an important role in making U.S. Treasuries relatively attractive. Our research continues to favor U.S. Treasury Inflation-Protected Securities (TIPS) and U.S. Treasury Floating Rate Securities, which may perform well in an inflationary or stagflationary environment.
▶ The outlook for credit remains negative as the risk of a global economic slowdown from rising inflation and monetary tightening continues. Our research indicates an increased threat of continued widening of credit spreads in the corporate bond market.
Real Assets:
▶ Gold: A positively sloped yield curve in the U.S. and the potential for real yields to stabilize (nominal yields less infla-tion expectations) positively affect the outlook for gold. (Note that our measure of yield curve incorporates a “shadow rate” reflecting the expansion of the Fed balance sheet). However, continued monetary tightening by the Fed tends to strengthen the U.S. Dollar, which is negative for gold in the shorter term. The outlook for gold, therefore, remains mixed. If the Federal Reserve moderates or abandons its tightening of monetary policy, gold could benefit.
▶ Commodities: Our model research has a mixed outlook for commodities. Some positive factors include narrowing high yield credit spreads, favorable valuations, and positive investor psychology. While still undervalued relative to equities, shorter-term concerns regarding widening credit spreads globally along with China’s slowdown have reduced the out-look for commodities. At the same time, due to Russia’s ongoing invasion of Ukraine, the potential for food and energy.
For more information about 3EDGE Asset Management or our offerings, please visit our website at 3edgeam.com.
About 3EDGE
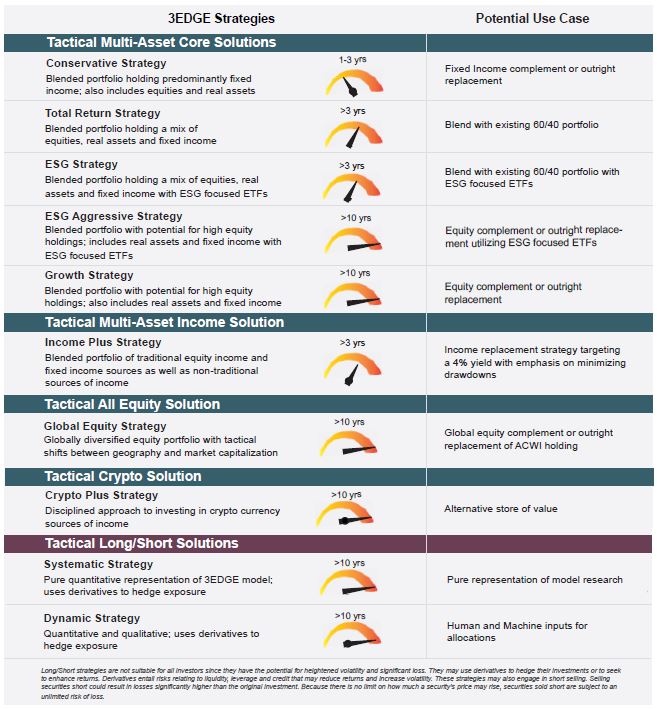
3EDGE Asset Management, LP, is a multi-asset investment management firm serving institutional investors and private clients. 3EDGE strategies act as tactical diversifiers, seeking to generate consis-tent, long-term investment returns, regardless of market conditions, while managing downside risks.
The primary investment vehicles utilized in portfo-lio construction are index Exchange Traded Funds (ETFs). The investment research process is driv-en by the firm’s proprietary global capital markets model. The model is stress-tested over 150 years of market history and translates decades of research and investment experience into a system of causal rules and algorithms to describe global capital mar-ket behavior. 3EDGE offers a full suite of solutions, each with a target rate of return and risk parame-ters, to meet investors’ different objectives.
Sources for market data/statistics: Bloomberg, Bureau of Economic Analysis
DISCLOSURES: This commentary and analysis is intended for information purposes only and is as of August 5, 2022. This commentary does not constitute an offer to sell or solicitation of an offer to buy any secu-rities. The opinions expressed in View From the EDGE® are those of Mr. Folts and Mr. Biegeleisen and are subject to change without notice in reaction to shifting market conditions. This commentary is not intended to provide personal investment advice and does not take into account the unique investment objectives and financial situation of the reader. Investors should only seek investment advice from their individual finan-cial adviser. These observations include information from sources 3EDGE believes to be reliable, but the accuracy of such information cannot be guaranteed. Investments including common stocks, fixed income, commodities, ETNs and ETFs involve the risk of loss that investors should be prepared to bear. Investment in the 3EDGE investment strategies entails substantial risks and there can be no assurance that the strategies’ investment objectives will be achieved. The regions included in our Equities category are measured based on the S&P 500 and MSCI indices. U.S. equity markets are represented by the S&P 500 index, unless we state otherwise. Japanese equities are represented by the Nikkei 225 equity index. European equities are represented by the MSCI Europe Index. India equities are represented by the S&P BSE SEN-SEX equity index, and Chinese equities are represented by the MSCI China index. Real Assets (Gold & Commodities) includes precious metals such as gold as well as investments that operate and derive much of their revenue in real assets, e.g., MLPs, metals and mining corporations, etc. Intermediate-Term Fixed Income includes fixed income funds with an average duration of greater than 2 years and less than 10 years. Short-Term Fixed Income and Cash includes cash, cash equivalents, money market funds, and fixed income funds with an average duration of 2 years or less. Past performance is not indicative of future results. View From the EDGE® is a registered trademark of 3EDGE Asset Management, LP.