
The investing world seems highly uncertain these days. Investors are understandably having trouble balancing earnings, the Fed, fiscal policy, inflation, economic growth, disease control, and geo- and US politics.
However, there appear to be two relatively certain events central to our current portfolio positioning: 1) the Fed will continue to tighten monetary policy and 2) earnings will continue to decelerate.
If one had to construct a 2×2 matrix of potential market environments in which choices had to be made between the Fed tightening or easing and choices between earnings accelerating or decelerating, it is highly unlikely investors would choose the combination of Fed tightening and profits decelerating. That has historically been a less common but unfavorable combination for the equity markets, but it does seem to be the one which could confront investors during the second half of 2022.
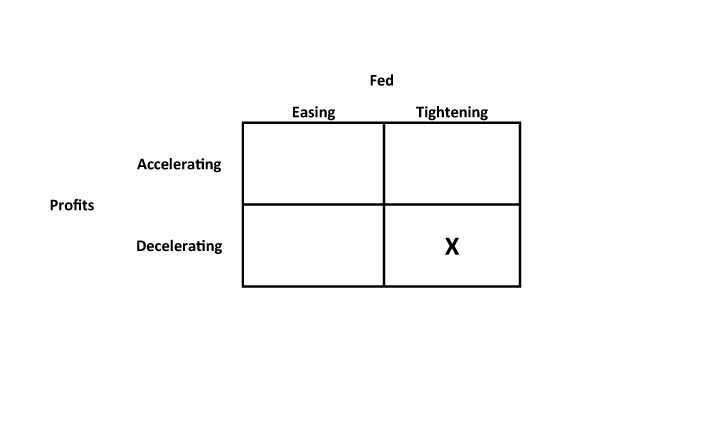
An uncommon and not particularly good combination
Chart 1 shows changes in the Fed Funds rate and the US profits cycle. With the exception of the period directly after the Global Financial Crisis, there was a reasonably high correlation between the Fed Funds rate and the profits cycle, i.e., interest rates rose as profits accelerated and fell as profits decelerated. That historical relationship implied monetary policy was a good ballast to economic and profits growth.
Chart 1: Year-on-Year Difference in the Fed Funds Rate and The US Profits Cycle (Jan 1972 – Mar. 2022)

There have been periods when the Fed raised rates despite a decelerating profits cycle (i.e., 1989 or 2005) However, if our forecast for profits growth is on the correct path and the Fed continues to hike interest rates, investors might be faced with this relatively rare combination.
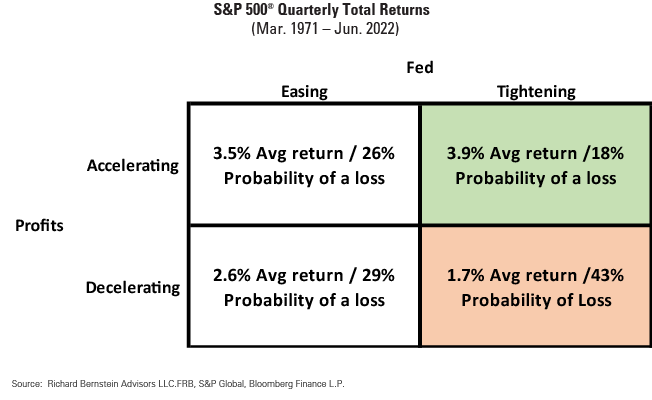
The matrix below shows the average S&P 500® quarterly return during the various combinations of Fed policy and profits growth:
The Fed is once again behind as it often has been in late-cycles
There are three categories of economic indicators. Leading indicators that tend to turn before the overall economy turns, coincident indicators that tend to turn in tandem with the economy, and lagging indicators that tend to turn after the economy turns.
For reasons we will never understand, investors are typically fascinated by lagging indicators. For example, the unemployment rate gets much attention despite being a lagging indicator, whereas weekly initial jobless claims get little notice despite being a leading indicator. Inflation is also a lagging indicator because bottlenecks and misbalanced supply/demand do not tend to occur early in the economic cycle.
The Fed’s mandate is price stability and full employment, i.e., inflation and unemployment, which are two lagging indicators. The Fed, therefore, by definition, is a lagging indicator itself. Their actions during the current cycle epitomize their lagging nature.
By some measures the Fed is historically lagging during the current cycle. The Fed has admitted being surprised by this cycle’s inflation and they have been slow to react to the highest inflation rates in 40 years.
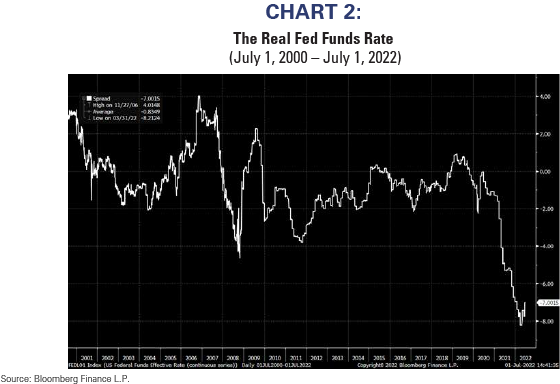
The real Fed Funds rate (i.e., the Fed Funds rate minus inflation) has historically been considered a reliable gauge of how stimulative or restrictive monetary policy was through time. A positive real Fed Funds rate was generally considered to reflect restrictive policy, whereas a negative real Fed Funds rate was considered stimulative. Every recession in the past 50 years was preceded by a positive real Fed Funds rate.
The average historical real Fed Funds rate is roughly 1%. It peaked at about 10% during the inflation fighting Volcker Fed in the early-1980s. Today, the real Fed Funds rate is close to historic lows. The real Fed Funds rate is more stimulative than it was after the Global Financial Crisis. (See Chart 2)
A historically negative real Fed Funds rate suggests the Fed could have more difficulty fighting inflation than economists currently expect, and further suggests the Fed might be forced to play catch-up and raise rates despite a slowing profits cycle in order to maintain the price stability they desire.
Chart 2: The Real Fed Funds Rate (July 1, 2000 – July 1, 2022)
Defensive sectors lead when profits decelerate
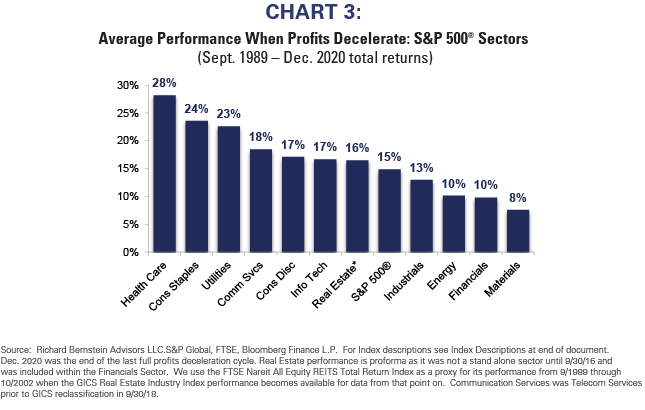
Chart 3 shows sector performance during periods when the profits cycle has historically decelerated. As one might expect, defensive sectors tend to outperform. That’s especially interesting because the current discussion seems to center on whether one should accentuate cyclicals or growth, with little mention of traditional defensive sectors.
Chart 3: Average Performance When Profits Decelerate: S&P 500® Sectors: (Sep. 1989 – Dec. 2020 total returns)
Only 2 certainties
There are too many issues about which investors could worry about. However, they seem to be ignoring the two relative certainties: 1) the Fed will continue to tighten monetary policy and 2) profits will continue to decelerate.
Because inflation is a lagging indicator we remain overweighted traditional late-cycle sectors like energy. However, one cannot ignore that profits are decelerating and that favors traditional defensive sectors like Consumer Staples, Health Care and Utilities.
Our portfolios shift through time to reflect the global economy. We have been significant fans of Energy and continue to believe it’s the best long-term secular growth story. However, cycles tend to disrupt secular stories and we are now more overweight Consumer Staples than Energy.
INDEX DESCRIPTIONS:
The following descriptions, while believed to be accurate, are in some cases abbreviated versions of more detailed or comprehensive definitions available from the sponsors or originators of the respective indices. Anyone interested in such further details is free to consult each such sponsor’s or originator’s website.
The past performance of an index is not a guarantee of future results.
Each index reflects an unmanaged universe of securities without any deduction for advisory fees or other expenses that would reduce actual returns, as well as the reinvestment of all income and dividends. An actual investment in the securities included in the index would require an investor to incur transaction costs, which would lower the performance results. Indices are not actively managed and investors cannot invest directly in the indices.
S&P 500®: S&P 500® Index: The S&P 500® Index is an unmanaged, capitalization-weighted index designed to measure the performance of the broad US economy through changes in the aggregate market value of 500 stocks representing all major industries.
Sector/Industries: Sector/industry references in this report are in accordance with the Global Industry Classification Standard (GICS®) developed by MSCI Barra and Standard & Poor’s.
Real Estate Sector Performance Proxy through 10/2002: FTSE NAREIT All Equity REITS Total Return Index is a free float adjusted market capitalization weighted index that includes all tax qualified REITs listed in the NYSE, AMEX, and NASDAQ National Market.
