
It has been 20 years since the beginning of what was known as the “lost decade” in equities. For those too young to have experienced it and as a reminder to those who did, the “lost decade” occurred from 2000 to 2009. After a massive run up in large cap U.S. equity prices fueled by the technology bubble of the late 1990s, irrational exuberance subsided, and stock markets crashed. After the smoke cleared, large cap stocks staged a multi-year recovery before hitting the proverbial wall again in the 2007-2008 recession. Despite a strong recovery in 2009, the result was a 10-year return for the S&P 500 Index of -0.95% that is now referred to as the “lost decade.” As students of the market, it is important to recognize that at the start of the lost decade, the S&P 500 Index was trading at such a high valuation that it took 10 years to work it off. The Index came back to life over the next decade to return 13.56% and bring the full 20-year period total return to 6.60%.
As the saying goes, “if you don’t know your history you are doomed to repeat it.” Looking back at historical stock and bond market valuations, we can certainly learn some things to inform our expectations about the future. While we use several different inputs in developing our forward-looking expectations for stocks and bonds, we think that valuations, both on an absolute basis and a relative basis, can be an accurate and intuitive way to forecast future performance for both equities and bonds. Simply put, the less we pay for an asset, the more we expect to get out of it relative to history.
Today, we are facing a very different set of circumstances that drive both bond and stock markets. However, the tools used to forecast can still help us frame a solid outlook. In this case, the earnings yield and yield to worst are two of the more impactful valuation data points that we use in developing our expectations for stocks and bonds, respectively.
For example, we can compare the valuation of an index, such as the S&P 500 Index or Bloomberg Barclays Aggregate Bond Index, to other yields and history to get a sense of how we stack up today through relative valuations.
Many investors are familiar with the price-to-earnings ratio (PE ratio), which is the price of a share divided by the earnings per share and is used to value stocks. The result is a number that can be compared to other similar companies. The PE ratio can also be a very informative datapoint for determining relative value throughout history.
Using those same inputs, the earnings yield is another great valuation metric. Earnings yield (EY) is simply the inverse of the PE ratio, or the earnings divided by the price. Expressed as a percentage, this ratio allows a direct forecast for future returns (for example, a total return forecast could be the current EY plus the expected dividend yield) as well as a comparison of equities to prevailing bond rates. The earnings yield can be a valuable frame of reference when creating market expectations.
Similarly, the yield to worst (YTW) can be used for valuation comparisons with bonds. This is especially true in today’s interest rate environment because bond prices are unlikely to benefit from further interest rate declines in our view. The YTW is similar to a bond’s yield to maturity in that both calculations consider the coupon on the bond and the current price. Bonds that do not have call features or optionality will have a yield to maturity that equals its YTW. The yield to maturity accounts for both the coupon payments the investor receives and any gain or loss the investor receives for purchasing the bond at a discount or premium to its par or terminal value at maturity. The YTW measures the same but it adjusts for early calls on the bond’s principal and any difference in the call price versus the bond’s par value. The weighted average yield to worst on a basket of bonds is a good indication of its total return over its holding period.
By plotting the valuations and the subsequent performance of an index, we can see a relationship between the variables (exhibit 1). Conceptually, we are gauging how the earnings yield and yield to worst relate to their market returns over time. As you would imagine, the higher the earnings yield and YTW, the greater the probability the stock and bond markets will achieve higher returns over the next several years.
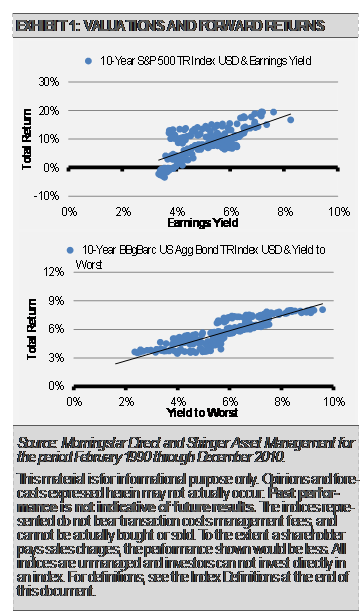
For example, the S&P 500 Index earnings yield in April 1980 was 14.37% and the index returned 16.89% annualized for the next decade. With the earnings yield at 3.30% as of December 31st, 2020, the average forward 10-year annualized return of the S&P 500 Index has been around 6% with some variability.
We can also use the yield to worst as an input for setting future bond market return expectations. As of December 31st, 2020, the yield to worst on the Barclays Bloomberg Barclays Aggregate Bond Index was 1.12%. This is very low compared to historical levels and a good starting point for creating future return expectations.
Our work suggests that solid economic growth and somewhat higher inflation will push long-term bond yields higher. This should create a headwind for bonds in the near-term. However, just as equities again offered attractive future returns once the earnings yield increased, higher bond yields down the road should result in higher future return expectations after the near-term lull.
Still, we must deal with the near-term bond market as it presents itself today. Just as passively investing in the S&P 500 Index beginning in 2000 resulted in the “lost decade,” having a large allocation to the Bloomberg Barclays Aggregate Bond Index may lead to disappointing results going forward. Diversifying away from an expensive broad market could help add value.
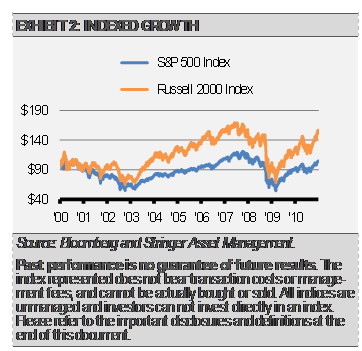
For example, if an equity investor in the early 2000s had diversified into areas like small cap stocks and sectors outside of those that had become so expensive and offered little earnings yield, the investor would have had a much better return (exhibit 2).
Similarly, we are finding many interesting opportunities to potentially enhance returns in the bond market going forward. Investors can be creative with ETFs in the income space in a way they really cannot be in the traditional retail bond space. In our next piece, we will discuss how investors can potentially add value outside of the core bond space to enhance yield while still protecting principal.
DISCLOSURES
Any forecasts, figures, opinions or investment techniques and strategies explained are Stringer Asset Management, LLC’s as of the date of publication. They are considered to be accurate at the time of writing, but no warranty of accuracy is given and no liability in respect to error or omission is accepted. They are subject to change without reference or notification. The views contained herein are not to be taken as advice or a recommendation to buy or sell any investment and the material should not be relied upon as containing sufficient information to support an investment decision. It should be noted that the value of investments and the income from them may fluctuate in accordance with market conditions and taxation agreements and investors may not get back the full amount invested.
Past performance and yield may not be a reliable guide to future performance. Current performance may be higher or lower than the performance quoted.
The securities identified and described may not represent all of the securities purchased, sold or recommended for client accounts. The reader should not assume that an investment in the securities identified was or will be profitable.
Data is provided by various sources and prepared by Stringer Asset Management, LLC and has not been verified or audited by an independent accountant.
Index Definitions:
Bloomberg Barclays U.S. Aggregate Bond Index – This Index provides a measure of the U.S. investment grade bond market, which includes investment grade U.S. Government bonds, investment grade corporate bonds, mortgage pass-through securities and asset-backed securities that are publicly offered for sale in the United States. The securities in the Index must have at least 1 year remaining to maturity. In addition, the securities must be denominated in US dollars and must be fixed rate, nonconvertible and taxable.
Russell 2000 Index – This Index is comprised of the smallest 2000 companies in the Russell 3000 Index, representing approximately 8% of the Russell 3000 total market capitalization. The real-time value is calculated with a base value of 135.00 as of December 31, 1986. The end-of-day value is calculated with a base value of 100.00 as of December 29, 1978.
S&P 500 Index – This Index is a capitalization-weighted index of 500 stocks. The Index is designed to measure performance of a broad domestic economy through changes in the aggregate market value of 500 stocks representing all major industries.
