
by by ADAM GROSSMAN, CFA
Quarterly Recap: Same Facts, But Two Very Different Conclusions Lead to a Standoff.
In the first quarter of 2023, the question of ‘how much longer will central banks need to fight inflation’ defined financial markets. However, certain market participants have gleaned starkly different answers from the same data. From the Federal Reserve’s perspective, inflation continues to be higher than their target levels and they have continued to communicate that rate cuts are not currently a viable option. However, it seems the bond market is focusing on the slowing year-over-year inflation; indicating to us that investors believe inflation will continue to drop, and central banks will soon be able to lower rates.
This disconnect between the bond market and the Fed’s policy widened during the unexpected collapse of Silicon Valley Bank. The market viewed this event as a sign of economic weakness and began expecting the Fed to cut rates in an effort to ease financial strain. However, the Federal Reserve quickly stepped in to shore up deposit issues but have reiterated that doing so is sufficient protection against a financial crisis. Jay Powell and company continue to see price instability as a bigger risk than market volatility and have maintained their message of ‘higher rates for longer’ accordingly.
While the Federal Reserve and the bond market were having their “old west” stare down, equity investors were trapped somewhere in the middle, although the preference for growth implies to us they have sided with bond investors. Earnings reported in Q1 were positive in most sectors year-over-year, but definitively slowed throughout 2022. Despite this slowing, equity markets ended with the best quarterly returns in 2 years, albeit through a steep decline in early March showing the elevated volatility embedded in the markets. In our view, equity markets are looking beyond slowing earnings growth and placing some faith in the bond markets’ forecast of lower long-term interest rates. This view is supported by growth-oriented themes outperforming value-oriented themes in the US, a first in over a year. We think this outperformance will be challenged in Q2 if the Federal Reserve does not provide the accommodation the bond market is now expecting.
Returns Recap: Positive Q1 Hides Despite the Diverging Outlooks.
The first two months of Q1 2023 continued the rally that we saw in Q4 2022. The drivers were the same as Q4 2022: inflation remained elevated but cooled, allowing growth-oriented stocks to outperform. However, in March, the collapse of Silicon Valley Bank upset the positive. Somewhat isolated from the issues, developed international markets remained in the lead. However, with a heavy weighting to the regional banking industry, US small cap equities dropped to the worst-performing equity segment. As discussed above, March ended up being a positive month for growth-oriented themes, allowing US large cap to produce a solid quarterly return.
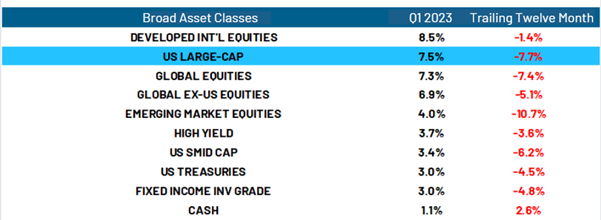
Source: Morningstar. Data as of March 31, .2023. Chart shown for illustrative purposes only. Past performance is no guarantee of future results. Not indicative of RiverFront portfolio performance. See disclosures at the end of this publication for description of asset classes and the indices for which the returns above are based. Returns above do not reflect any fees or costs associated with investing in the applicable asset classes. It is not possible to invest directly in an index.
On the fixed income side, returns were more muted than developed markets, but still positive. High yield saw some spread volatility during the aftermath of the regional banking crisis, but was able to rally at the end of March.
US Sectors: Growth Oriented Sectors Lead the Way
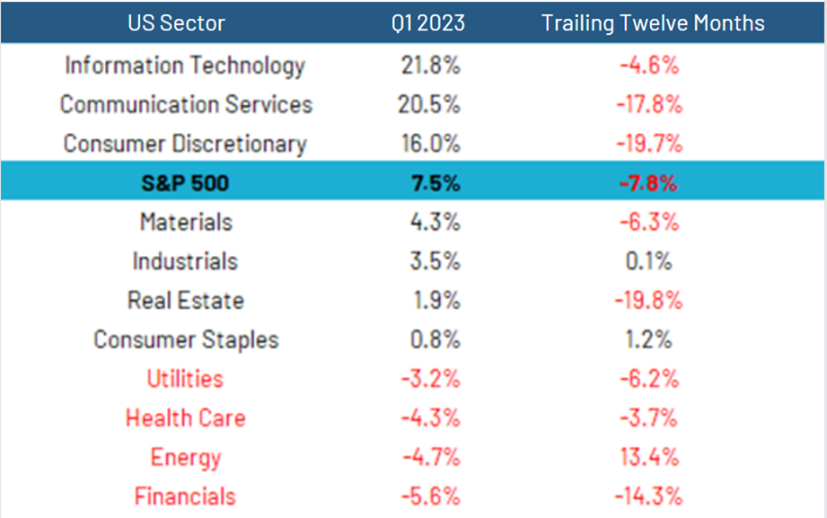
Source: Bloomberg. Data as of March 31, 2023. Chart shown for illustrative purposes only. Past performance is no guarantee of future results. Not indicative of RiverFront portfolio performance. Returns above do not reflect any fees or costs associated with investing in the listed sectors. the applicable asset classes. It is not possible to invest directly in an index.
For the US sectors, expectations for lower rates seem clear. The top three performing sectors are all growth-oriented, while value-oriented sectors all performed below the broad S&P 500. Two value-oriented sectors in particular, Energy and Financials, had rough quarters for more idiosyncratic reasons. As previously discussed, financials struggled in the face of continued rate hikes and the resulting regional bank failures. For the energy sector, future demand expectations took a hit in the first quarter, with weak global economic data creating concern about their future demand for oil. Defensive sectors found themselves somewhere between the outperformers and underperformers. Overall, we still believe that intra-sector selection will be just as important as inter-sector allocation moving forward.
International: Commodity Producers and China Lag Developed Europe, Japan, and US
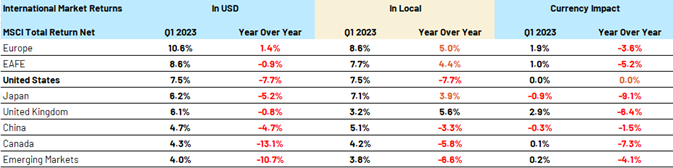
Source: Bloomberg. Data as of March 31, 2023. Chart shown for illustrative purposes only. Past performance is no guarantee of future results. Not indicative of RiverFront portfolio performance. See disclosures at the end of this publication for description of the indices for which the returns above are based. Returns above do not reflect any fees or costs associated with investing in the applicable international markets. It is not possible to invest directly in an index.
Similar to the themes we saw in US Sectors, commodity-producing countries, such as Canada and several of the constituents of Emerging Markets (see chart above), lagged the relatively more growth-oriented developed markets, which are net beneficiaries of declining energy prices due to their status as energy importers.
Looking at Developed Markets from a selection lens, we see that growth and quality themes were the driver of outperformance for developed indexes (see chart left). If our ‘most likely’ scenario (see below for description) of rising rates and moderating, but persistent inflation happens, our expectation is that this trend will reverse in the quarters ahead.
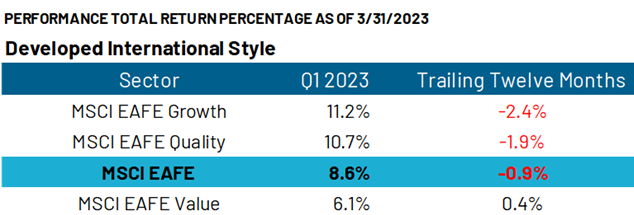
Source: Bloomberg. Data as of March 31, 2023. Chart shown for illustrative purposes only. Past performance is no guarantee of future results. Not indicative of RiverFront portfolio performance. See disclosures at the end of this publication for description of the indices for which the returns above are based. Returns above do not reflect any fees or costs associated with investing in the applicable international markets. It is not possible to invest directly in an index.
For emerging markets, China was a relative outperformer within emerging markets, due to its large technology sector. Interestingly, we believe it was also Chinese economic data and geopolitical relations that caused commodity markets to struggle this quarter, causing more broad emerging market struggles.
Moving forward, we believe the shift in narrative of either higher rates for longer than the Bond Market expects or a shift from rising rates to falling rates will become clearer in the second quarter. Thus, we think opportunities will emerge where the market over or under values segments based on shifting outlooks.
Outlook: Waiting to see who blinks first in the interest rate due
Overall, the first quarter performance of 2023 was positive, especially given the mid-quarter banking crisis and the continued geopolitical conflicts in Europe and China. We are concerned about the wide discrepancy we see between the Fed’s plans and the bond market’s pricing of future interest rates.
As discussed in our 2023 Outlook, we see three likely outcomes of this standoff:
- Economic Growth: Slowing, but Positive / Inflation: Moderating, but Persistent (BASE CASE / MOST LIKELY OUTCOME)
-
- In this scenario, the Fed will be proven correct and interest rates must go higher to combat inflation. If this plays out, we believe equity investors should expect volatility but directionless markets, an environment where we believe the P.A.T.T.Y theme (a focus on investments with strong yields and free cash flows to support them) would be the most effective strategy.
- Economic Growth: Resilient / Inflation: Under Control (BULL CASE)
- Specifically, a recession or significant slowdown quickly emerges, causing inflation pressures to dissipate quickly. In this scenario, the bond market wins the standoff, and the Fed would begin to forecast rate cuts and/or monetary stimulus. In this scenario, quality and growth-oriented US equities would be the strongest performers, in our view. Additionally, international stocks would benefit from strong currencies.
- Economic Growth: Recessionary / Inflation: Strong (BEAR CASE)
- The most challenging scenario is if we see high inflation and evidence of a recession, which would force the Fed to continue to raise rates even in the face of a recession. In that scenario, bonds and stocks would perform poorly as long interest rates rise and economic and earnings growth fall.
Due to the lack of a clear outcome, we remain neutral in our equity positioning. Also, we continue to believe that a prudent path forward is to opportunistically add fixed income at higher yields, and to make allocations into inflation-sensitive equity sectors in markets as earnings come through. While this strategy may not perfectly time the bottom of market, we believe it is prudent to wait for signs of earnings confirmation before increasing our allocation to stocks.
For more news, information, and analysis, visit the ETF Strategist Channel.
Risk Discussion: All investments in securities, including the strategies discussed above, include a risk of loss of principal (invested amount) and any profits that have not been realized. Markets fluctuate substantially over time, and have experienced increased volatility in recent years due to global and domestic economic events. Performance of any investment is not guaranteed. In a rising interest rate environment, the value of fixed-income securities generally declines. Diversification does not guarantee a profit or protect against a loss. Investments in international and emerging markets securities include exposure to risks such as currency fluctuations, foreign taxes and regulations, and the potential for illiquid markets and political instability. Please see the end of this publication for more disclosures.
Important Disclosure Information:
The comments above refer generally to financial markets and not RiverFront portfolios or any related performance. Opinions expressed are current as of the date shown and are subject to change. Past performance is not indicative of future results and diversification does not ensure a profit or protect against loss. All investments carry some level of risk, including loss of principal. An investment cannot be made directly in an index.
Information or data shown or used in this material was received from sources believed to be reliable, but accuracy is not guaranteed.
This report does not provide recipients with information or advice that is sufficient on which to base an investment decision. This report does not take into account the specific investment objectives, financial situation or need of any particular client and may not be suitable for all types of investors. Recipients should consider the contents of this report as a single factor in making an investment decision. Additional fundamental and other analyses would be required to make an investment decision about any individual security identified in this report.
Chartered Financial Analyst is a professional designation given by the CFA Institute (formerly AIMR) that measures the competence and integrity of financial analysts. Candidates are required to pass three levels of exams covering areas such as accounting, economics, ethics, money management and security analysis. Four years of investment/financial career experience are required before one can become a CFA charterholder. Enrollees in the program must hold a bachelor’s degree.
All charts shown for illustrative purposes only. Technical analysis is based on the study of historical price movements and past trend patterns. There are no assurances that movements or trends can or will be duplicated in the future.
Index Definitions
Standard & Poor’s (S&P) 500 Index TR USD (US Large Cap) measures the performance of 500 large cap stocks, which together represent about 80% of the total US equities market.
Standard & Poor’s (S&P) 1000 Index (US SMID Cap) – the S&P MidCap 400 Index and the S&P SmallCap 600 Index are combined to form the S&P 1000.
MSCI EAFE Index NR USD (Developed International Equities) is designed to represent the performance of large and mid -cap securities across approximately 21 developed markets, including countries in Europe, Australasia and the Far East, excluding the US and Canada. Net total return indices reinvest dividends after the deduction of withholding taxes, using (for international indices) a tax rate applicable to nonresident institutional investors who do not benefit from double-taxation treaties.
MSCI Emerging Markets Index NR USD (Emerging Market Equities) is an equity index that captures large and mid-cap representation across approximately 25 emerging markets (EM) countries.
MSCI Europe Index represents the performance of large and mid-cap equities across approximately 15 developed countries in Europe.
MSCI Japan Index designed to measure the performance of the large and mid cap segments of the Japanese market.
MSCI China Index captures large and mid cap representation across China A shares, H shares, B shares, Red chips, P chips and foreign listings (e.g. ADRs).
MSCI United Kingdom Index (USD) is designed to measure the performance of the large and mid cap segments of the UK market.
MSCI Canada Index is designed to measure the performance of the large and mid cap segments of the Canada market.
The MSCI USA Index is designed to measure the performance of the large and mid cap segments of the US market.
MSCI ACWI Index (Global Equities) is designed to represent performance of the full opportunity set of large- and mid-cap stocks across approximately 23 developed and approximately 25 emerging markets.
MSCI ACWI ex USA Index (Global ex US Equities) captures large and mid cap representation across approximately 22 of 23 developed markets (DM) countries (excluding the US) and approximately 25 emerging markets (EM) countries.
ICE BofA High Yield Index TR USD (High Yield) tracks the performance of US dollar denominated below investment grade rated corporate debt publicly issued in the US domestic market. Index constituents are capitalization-weighted based on their current amount outstanding times the market price plus accrued interest.
Bloomberg Capital US Treasury Index TR USD (Treasury Bonds) measures the performance of the US Treasury bond market.
Bloomberg US Aggregate Bond Index TR USD (Fixed Income Investment Grade) is an unmanaged index that covers the investment grade fixed rate bond market with index components for government and corporate securities, mortgage pass-through securities and asset-backed securities. The issues must be rated investment grade, be publicly traded and meet certain maturity and issue size requirements.
Bloomberg Capital 1–3 Month US Treasury Bill Index TR USD (Cash) includes all publicly issued zero-coupon US Treasury Bills with a remaining maturity between one and three months, are rated investment-grade and have an outstanding face value of $250 million or more.
MSCI EAFE Growth Index captures large and mid-cap securities exhibiting overall growth style characteristics across approximately 21 Developed Markets countries around the world, excluding the US and Canada. The growth investment style characteristics for index construction are defined using five variables: long-term forward EPS growth rate, short-term forward EPS growth rate, current internal growth rate and long-term historical EPS growth trend and long-term historical sales per share growth trend.
MSCI EAFE Quality Index is based on MSCI EAFE Index, its parent index, which includes large and mid-cap stocks across approximately 21 Developed Market (DM) countries excluding the US and Canada. The index aims to capture the performance of quality growth stocks by identifying stocks with high quality scores based on three main fundamental variables: high return on equity (ROE), stable year-over-year earnings growth and low financial leverage. The MSCI Quality Indexes complement existing MSCI Factor Indexes and can provide an effective diversification role in a portfolio of factor strategies.
MSCI EAFE Value Index captures large and mid-cap securities exhibiting overall value style characteristics across approximately 21 Developed Markets countries around the world, excluding the US and Canada. The value investment style characteristics for index construction are defined using three variables: book value to price, 12-month forward earnings to price and dividend yield.
In a rising interest rate environment, the value of fixed-income securities generally declines.
Stocks represent partial ownership of a corporation. If the corporation does well, its value increases, and investors share in the appreciation. However, if it goes bankrupt, or performs poorly, investors can lose their entire initial investment (i.e., the stock price can go to zero).
Bonds represent a loan made by an investor to a corporation or government. As such, the investor gets a guaranteed interest rate for a specific period of time and expects to get their original investment back at the end of that time period, along with the interest earned. Investment risk is repayment of the principal (amount invested). In the event of a bankruptcy or other corporate disruption, bonds are senior to stocks. Investors should be aware of these differences prior to investing.
High-yield securities (including junk bonds) are subject to greater risk of loss of principal and interest, including default risk, than higher-rated securities.
Investing in foreign companies poses additional risks since political and economic events unique to a country or region may affect those markets and their issuers. In addition to such general international risks, the portfolio may also be exposed to currency fluctuation risks and emerging markets risks as described further below.
Changes in the value of foreign currencies compared to the U.S. dollar may affect (positively or negatively) the value of the portfolio’s investments. Such currency movements may occur separately from, and/or in response to, events that do not otherwise affect the value of the security in the issuer’s home country. Also, the value of the portfolio may be influenced by currency exchange control regulations. The currencies of emerging market countries may experience significant declines against the U.S. dollar, and devaluation may occur subsequent to investments in these currencies by the portfolio.
Foreign investments, especially investments in emerging markets, can be riskier and more volatile than investments in the U.S. and are considered speculative and subject to heightened risks in addition to the general risks of investing in non-U.S. securities. Also, inflation and rapid fluctuations in inflation rates have had, and may continue to have, negative effects on the economies and securities markets of certain emerging market countries.
Technology and internet-related stocks, especially of smaller, less-seasoned companies, tend to be more volatile than the overall market.
Small-, mid- and micro-cap companies may be hindered as a result of limited resources or less diverse products or services and have therefore historically been more volatile than the stocks of larger, more established companies.
RiverFront Investment Group, LLC (“RiverFront”), is a registered investment adviser with the Securities and Exchange Commission. Registration as an investment adviser does not imply any level of skill or expertise. Any discussion of specific securities is provided for informational purposes only and should not be deemed as investment advice or a recommendation to buy or sell any individual security mentioned. RiverFront is affiliated with Robert W. Baird & Co. Incorporated (“Baird”), member FINRA/SIPC, from its minority ownership interest in RiverFront. RiverFront is owned primarily by its employees through RiverFront Investment Holding Group, LLC, the holding company for RiverFront. Baird Financial Corporation (BFC) is a minority owner of RiverFront Investment Holding Group, LLC and therefore an indirect owner of RiverFront. BFC is the parent company of Robert W. Baird & Co. Incorporated, a registered broker/dealer and investment adviser.
To review other risks and more information about RiverFront, please visit the website at riverfrontig.com and the Form ADV, Part 2A. Copyright ©2023 RiverFront Investment Group. All Rights Reserved. ID 2835865
