
By the end of February 2021, the majority of fourth quarter 2020 earnings had been reported, and many investors are looking for key takeaways they can use to make allocation decisions for the remainder of 2021. Instead of focusing on company-specific results, we believe one of the most notable takeaways came from the contrast between the aggregate U.S. market and its European counterpart. While both markets exhibited positive earnings and sales surprises relative to expectations, the U.S. dominated European earnings growth by 15%+ and European sales growth by 6%+, as seen in Figure 1 below.
Figure 1. Q4Y2020 Corporate Growth Results
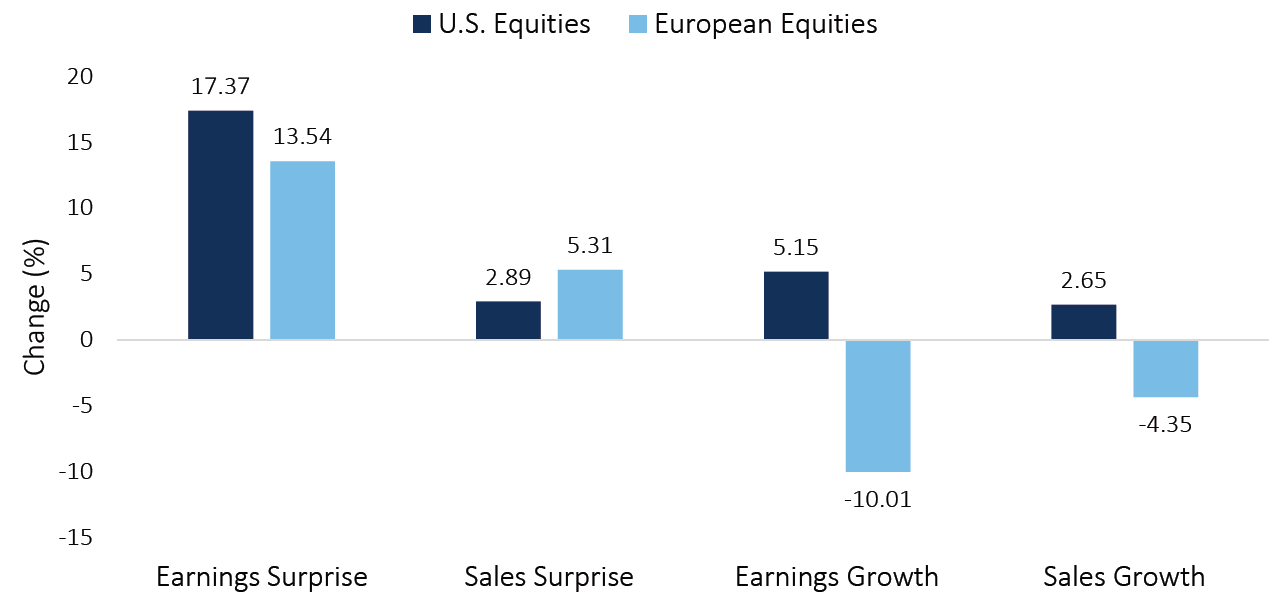
Source: Innealta Capital. As of 03/04/2021. “U.S. Equities” refers to the S&P 500 index. “European Equities” refers to the EURO STOXX 50 index. A surprise measurement represents the percentage difference between the actual results relative to the estimates. A growth measurement represents the percentage change between the Q4Y2020 value and the Q4Y2019 value.
Many are aware that U.S. equity markets have vastly outperformed European equities in recent history (see figure 2). Still, some might be surprised to learn the magnitude of the two equity markets’ performance differential. Over the past five years, U.S. equity markets have outperformed by 10% annualized! The million-dollar question is whether or not this trend can persist. To begin to answer that question, we believe profitability and valuations are two crucial data points that can provide more insight into what the future might hold.
Figure 2. Performance History of U.S. and European Equities
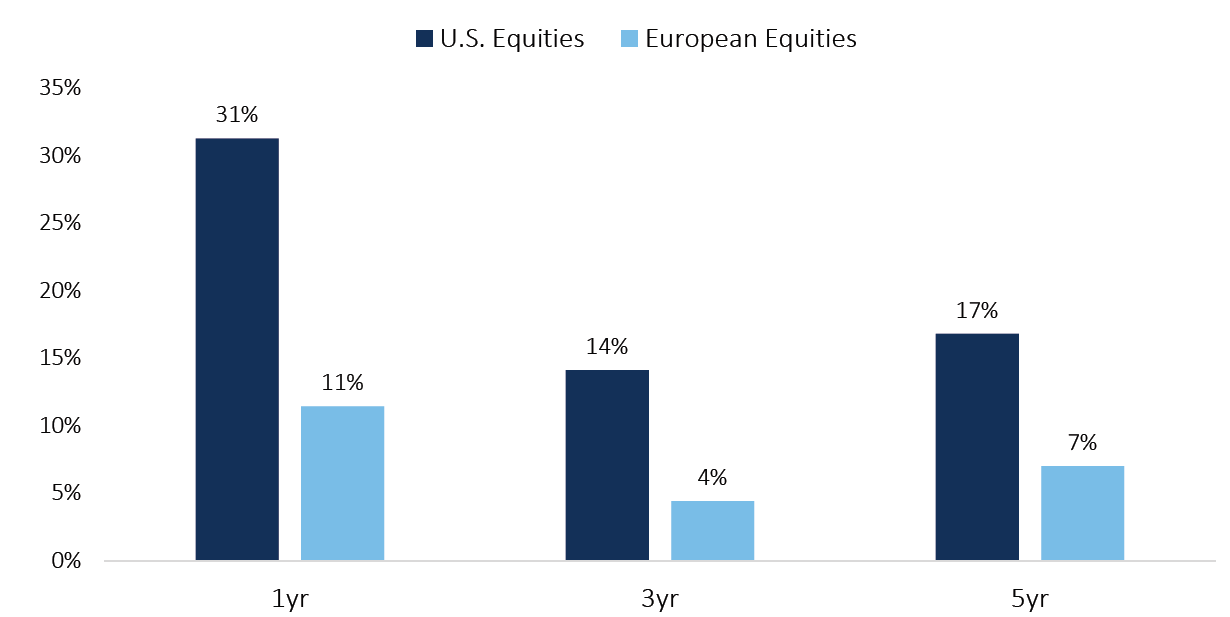
Source: Innealta Capital. As of 02/28/2021. “U.S. Equities” refers to the S&P 500 Total Return Index. “European Equities” refers to the EURO STOXX 50 Total Return Index.
Figure 3 provides a snapshot of valuations (P/E & P/B) and profitability (ROA & ROE) of U.S. and European equities. While U.S. companies appear relatively expensive, their profitability is considerably higher than European ones. To be more precise, U.S. equities appear 2-3.6x more expensive, while its profitability metrics are 2.9-4.2x higher. Unfortunately, this cross-sectional analysis alone does not provide a clear answer, and thus we must use history as a guide.
Figure 3. Valuations relative to Profits
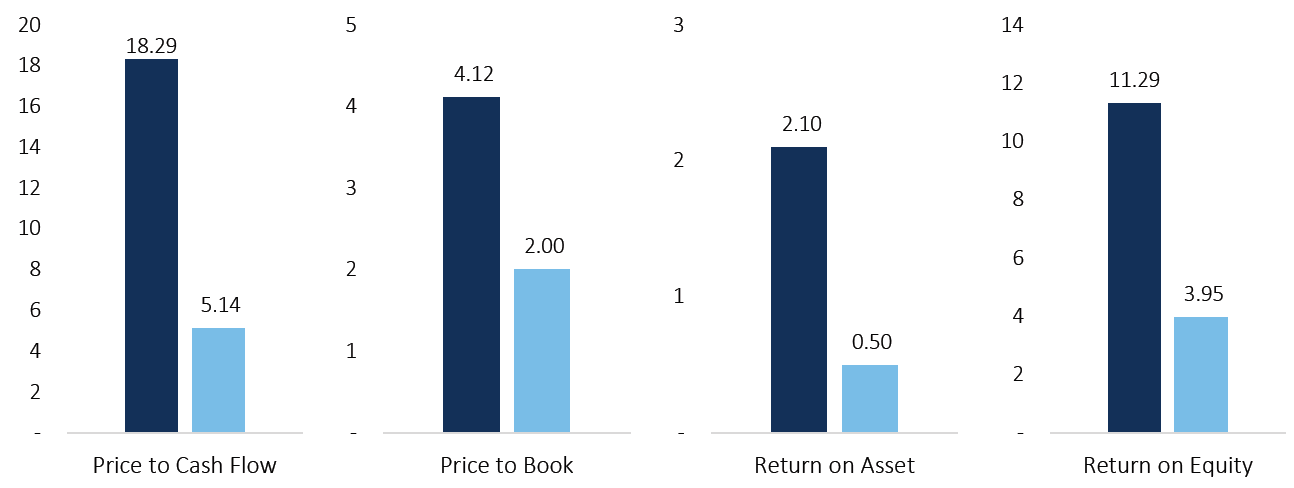
Source: Innealta Capital. As of 03/04/2021. “U.S. Equities” refers to the S&P 500 index. “European Equities” refers to the EURO STOXX 50 index.
As Mark Twain said, “History doesn’t repeat itself, but it often rhymes,” which we find very applicable in the world of investing. For this reason, we believe it’s important to look at the historical relationships between the valuations and profitability of these two equity markets. Figure 4 provides the historical relationship between valuations and profitability over the past fifteen years. The figure makes a relative comparison – U.S. versus Europe – but also an individual comparison. The graph shows three key takeaways:
- S. equity valuations (price-to-book ratio) appear overvalued by 38% relative to U.S. equity profitability metric (return on equity).
- European equity valuations (price-to-book ratio) appear overvalued by 22% relative to European equity profitability metrics (return on equity).
- Compared to European equities, U.S. equities appear overvalued by 8.7%.
By incorporating a time-series analysis, we can develop a more holistic view than using cross-sectional analysis in isolation. If we just compared today’s valuation metrics relative to today’s profitability metrics, it is not obvious whether U.S. equity markets are undervalued or overvalued. However, when we compare the relationship through time, the U.S. equity market appears overvalued on both an absolute and relative basis.
Figure 4. Inferring Valuation from Profitability
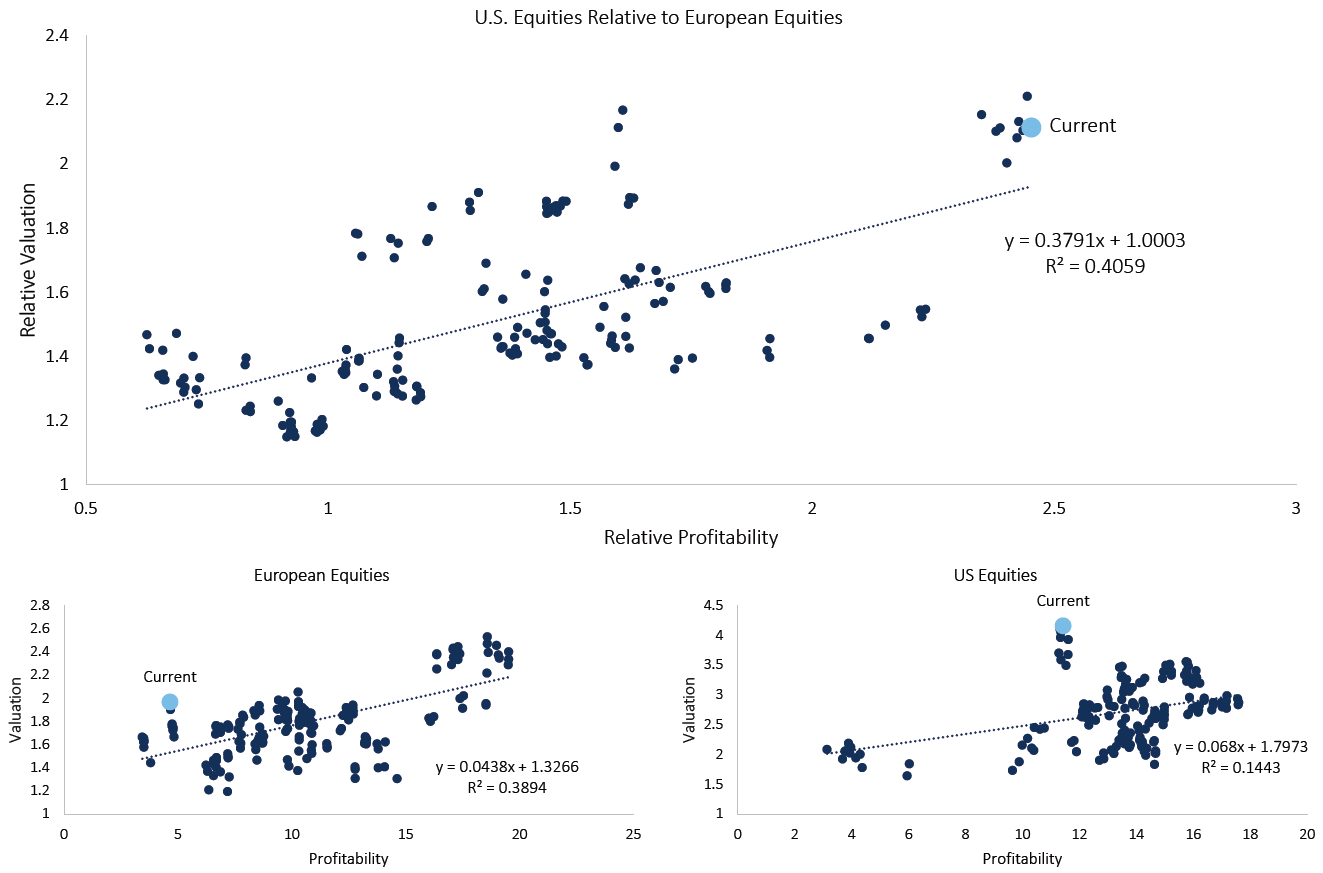
Source: Innealta Capital. Time frame 02/28/2006 to 02/28/2021. Frequency monthly. “U.S. Equities” refers to the S&P 500 Index. “European Equities” refers to the EURO STOXX 50 Index. “Valuation” refers to the price-to-book ratio. Profitability refers to the return on common equity. “Relative Valuation” refers to the U.S. price-to-book ratio divided by the European Equity price-to-book ratio. “Relative Profitability” refers to the U.S. equity return on common equity metric divided by the European Equity return on common equity metric.
Moving forward, both equity markets will, in our opinion, need to exhibit substantially higher earnings growth to justify such elevated valuations. U.S. equities are particularly concerning given the extremely elevated valuations. The linear regression models, shown in Figure 4, exhibit low r-squared and significant beta values, suggesting that profitability metrics are a good indicator for valuations, but profitability metrics do not explain all the variation in valuation values. Given this dynamic, we would suggest that investors use additional views, such as macroeconomic or behavioral, to inform their view on U.S. or European equities.
The S&P 500 Index is a diversified large cap U.S. index that holds companies across all eleven GICS sectors. The EURO STOXX 50 Index Europe’s leading blue-chip index for the Eurozone, provides a blue-chip representation of supersector leaders in the region. The index covers 50 stocks from 11 Eurozone countries. The index is licensed to financial institutions to serve as an underlying for a wide range of investment products such as exchange-traded funds (ETFs), futures, options and structured products.
This material is for informational purposes and is intended to be used for educational and illustrative purposes only. It is not designed to cover every aspect of the relevant markets and is not intended to be used as a general guide to investing or as a source of any specific investment recommendation. It is not intended as an offer or solicitation for the purchase or sale of any financial instrument, investment product or service. This material does not constitute investment advice, nor is it a substitute for such professional advice or services, nor should it be used as a basis for any decision or action that may affect your business. Before making any decision or taking any action that may affect your business, you should consult a qualified professional adviser. In preparing this material we have relied upon data supplied to us by third parties. The information has been compiled from sources believed to be reliable, but no representation or warranty, express or implied, is made by Innealta Capital, LLC as to its accuracy, completeness or correctness. Innealta Capital, LLC does not guarantee that the information supplied is accurate, complete, or timely, or make any warranties with regard to the results obtained from its use. Innealta Capital, LLC has no obligations to update any such information.
The Market Share discusses current economic events and their implications for financial markets, directly from the Innealta Portfolio Managers.
For more publications, please visit our website www.innealtacapital.com/insights
733-INN-03/17/2021
