

Tight Spreads Point to Below Average Excess Returns for Corporate Bonds
As a result of investors’ anticipation of Fed rate cuts amid an ongoing economic expansion (covered in our Goldilocks and the Five Rate Cuts note), financial conditions eased in 4Q23, which saw credit spreads tighten alongside the “everything rally” in nearly all asset classes.
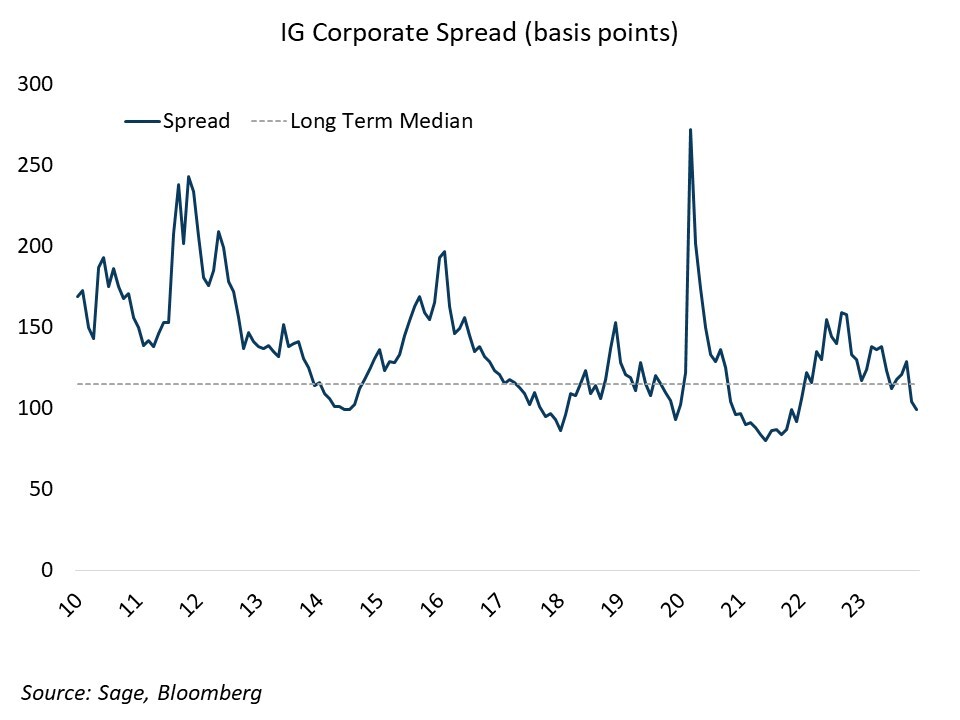
Corporate bond spreads, or the excess yield over treasuries, represent the compensation to a corporate bond investor for bearing the credit risk of the issuer. At an index level, the investment grade (IG) corporate spread serves as the credit risk premium for the entire sector.
Right now, the spread stands at 97 basis points, which places it in the 36% percentile of spreads going back 1990 – not the tightest spread on record, but well below the long-term median level.
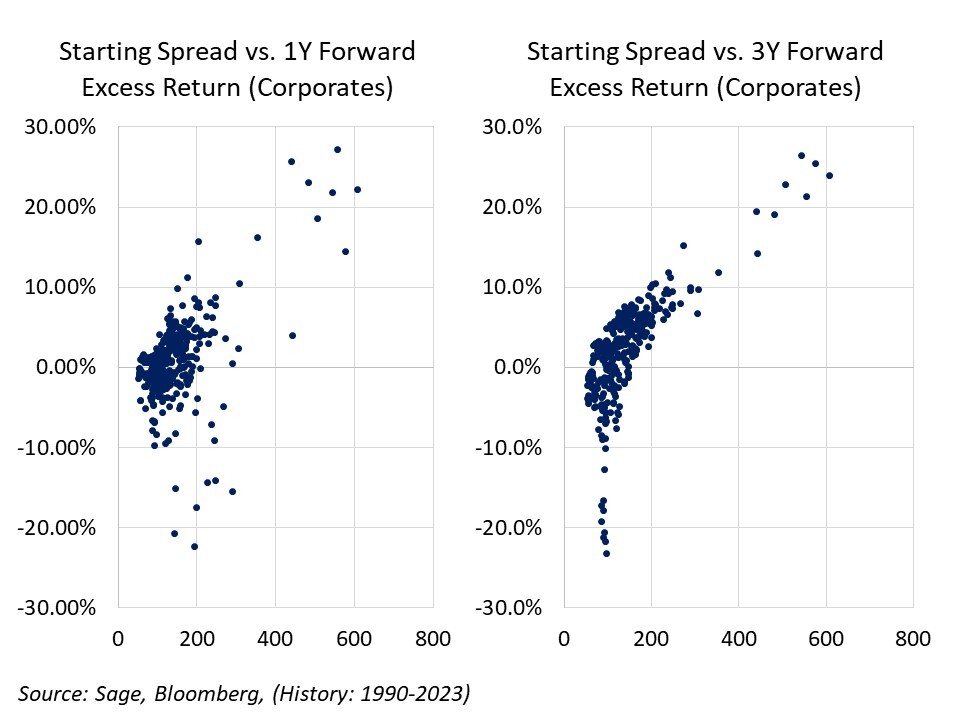
At the current valuation (100 bps of spread and below), the median 1-year excess return is +32 basis points over treasuries, with 58.2% of occurrences resulting in a 1-year positive excess return; while on a 3-year forward basis, the median excess return is flat, with a positive excess return only 45.8% of the time.
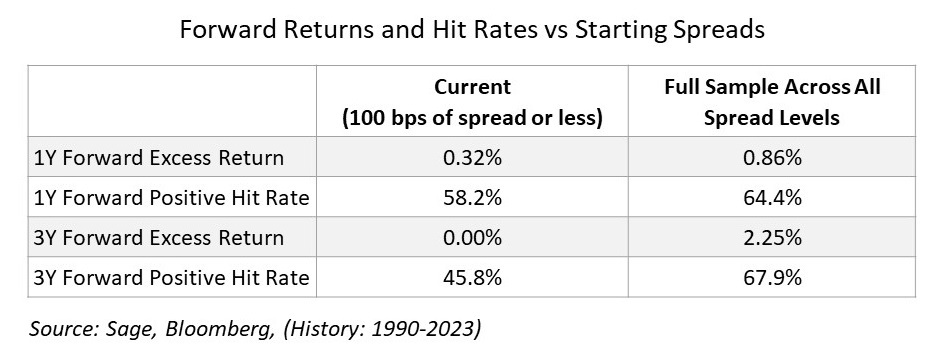
Compared to the full history of corporate bonds since 1990: 86 bps of excess over one year (64% positive hit rate), and 225 bps over three years (68% hit rate), and it is clear that the future prospects for the outperformance of corporate bonds is well below the historical average. While the “Goldilocks” pricing in markets has served as a tailwind for corporate bonds in recent months, the risk/reward picture for the sector means that the key decision in this environment will be at the issuer/security level, rather than a simple “beta” allocation to the sector.
For more news, information, and analysis, visit the ETF Strategist Channel.
Disclosures: This is for informational purposes only and is not intended as investment advice or an offer or solicitation with respect to the purchase or sale of any security, strategy or investment product. Although the statements of fact, information, charts, analysis and data in this report have been obtained from, and are based upon, sources Sage believes to be reliable, we do not guarantee their accuracy, and the underlying information, data, figures and publicly available information has not been verified or audited for accuracy or completeness by Sage. Additionally, we do not represent that the information, data, analysis and charts are accurate or complete, and as such should not be relied upon as such. All results included in this report constitute Sage’s opinions as of the date of this report and are subject to change without notice due to various factors, such as market conditions. Investors should make their own decisions on investment strategies based on their specific investment objectives and financial circumstances. All investments contain risk and may lose value. Past performance is not a guarantee of future results.
Sage Advisory Services, Ltd. Co. is a registered investment adviser that provides investment management services for a variety of institutions and high net worth individuals. For additional information on Sage and its investment management services, please view our website atsageadvisory.com, or refer to our Form ADV, which is available upon request by calling 512.327.5530.