

By Kevin Nicholson, CFA
SUMMARY
- The Fed is likely to raise rates once more in 2023, in our view.
- The Trend is positive for now and positive Q3 earnings surprises could pull the S&P 500 out of its trading range.
- We believe crowd sentiment is searching for direction.
Portfolios Favor Stock Exposure Domestic Market Now Flashing Green…While International Market is Flashing Red
Since the last update of the Three Tactical Rules in the August 1st Weekly View, much has changed…and a lot has stayed the same. Financial markets continue to hope for the end of the Fed’s rate hiking cycle, while the economic data has been mixed without any clear signal. Hence, the focus remains on corporate America’s ability to adapt to the new economic reality, and thus the stability of earnings. Over the past two months, our tactical rules have seen a big change in crowd sentiment, while the Fed and the trend have been steady.

Our qualitative ratings on the Three Rules are represented by a 6-increment color scheme, with Green Light being the most favorable. “Don’t Fight the Fed” is currently a solid red light, “Don’t Fight the Trend” is a flashing green light, and “Beware of the Crowd at Extremes” has moved from a flashing red light to a yellow light since August 1, 2023. While the individual rules collectively would align with a yellow light, the heatmaps we overlay onto the tactical rules are more favorable, due to the recent market pullback. This nuance shifts our combined tactical rating on the stock market to a flashing green light.
DON’T FIGHT THE FED: Fed is Prepared for Additional Hikes, Despite Inflation Easing. Red Light
The Fed held the fed funds target range steady at 5.25 -5.50% at its last meeting, but left the door open for one more hike this year if the economic data remains relatively resilient. The Fed sees inflation as being elevated, as headline inflation increased to 3.7% in August due to rising oil prices. The Fed is focused on core inflation which strips out the volatile categories of food and energy. Its preferred inflation gauge, core Personal Consumption Expenditures (PCE), currently sits at 3.90%, well above the 2% target. Additionally, the continued strength of the labor market has made the Fed more determined to slow the economy before declaring victory over inflation. Therefore, we believe that the Fed will raise rates once more this year as indicated in its summary of economic predictions at its September 20th meeting. Our forecast is for the fed funds terminal rate to be 5.625% at year-end, with the Fed holding that level until at least Q3 2024. Given that we expect another rate hike, we believe that the Fed is at a red light.
Internationally, the Bank of England (BOE) and European Central Bank (ECB) find themselves in similar positions to the Fed, having recently hiked interest rates to tame persistent inflation. The BOE left its policy rate at 5.25% in September, despite having the highest inflation rate of the G7 nations at 6.7%. As for the ECB, it raised its deposit facility to 4.00% and its main refinancing rate to 4.50% on September 14th, and like the Fed left the door open to do more, as inflation is still well above their 2% target. We believe the willingness of international central banks to contemplate additional hikes means they too have moved back to a red light.
DON’T FIGHT THE TREND: Trend Is Slowing and Testing Support Levels. Flashing Green Light (Domestically)
The trend of the S&P 500, which we define as the 200-day moving average, has decelerated since our last update, and the index has traded in a range between 4250 and 4600. We see meaningful support at 4200. Despite the recent pullback, the trend is rising at an annualized rate of 13.5% as of this past Friday. The trend will continue to be positive for several months even if the S&P 500 holds its current level of 4288 (as of September 29, 2023). Historically, a positive trend is good for future stock returns, and we believe that this time is no different, however Q3 earnings will have to significantly beat expectations to pull the S&P 500 out of its recent trading range. Thus, domestically our rule of “Don’t Fight the Trend” is signaling a flashing green light which calls for stock exposure slightly above long-term targets.
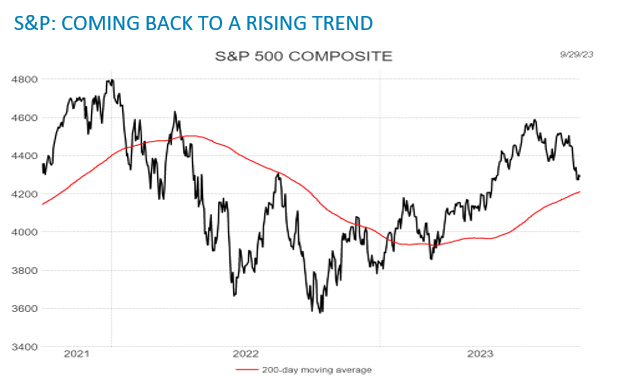
Source: LESG Datastream, RiverFront. Data daily as of September 29, 2023. Charts shown for illustrative purposes. Not indicative of RiverFront portfolio performance. Index definitions are available in the disclosures.
International Trend – Flashing Red Light
Internationally, the trend of the MSCI ACWI ex-US Index is rising at an annualized rate of approximately 5.75% as of this past Friday, but it is decelerating rapidly, with the price now below the trend. Unlike its domestic counterpart, the international trend will turn negative if it does not reaccelerate over the next month and current levels were to hold. Therefore, the international trend is a flashing red light signaling lower stock exposure relative to long-term targets.
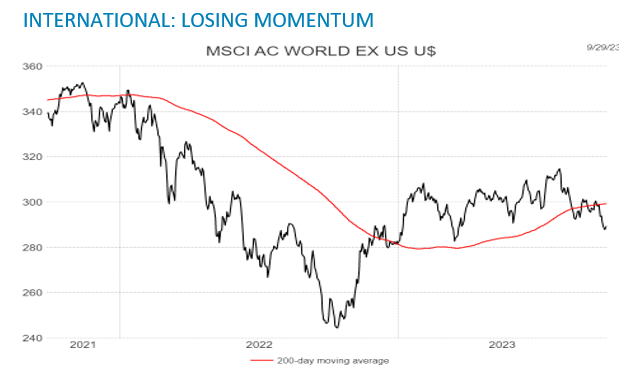
Source: LESG Datastream, RiverFront. Data daily as of September 29, 2023. Charts shown for illustrative purposes. Not indicative of RiverFront portfolio performance. Index definitions are available in the disclosures.
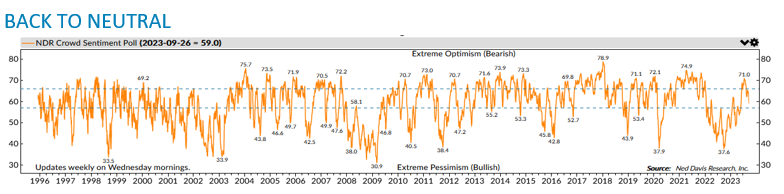
BEWARE OF THE CROWD AT EXTREMES: Neutral, No Signal. Yellow Light
We regard Crowd Sentiment as the contrary indicator of the Three Tactical Rules. Since the beginning of the year, the crowd has been either neutral or in extreme pessimism as investors attempted to handicap and navigate the evolving monetary policy landscape. The chart below shows a measure of investor sentiment as calculated by Ned Davis Research. When the line is high it shows extreme optimism, and when it is low, extreme pessimism. This is our preferred data source to measure investor psychology, though we use our own analytical framework from which to draw conclusions. Currently, the indicator is in the neutral zone and searching for direction, a state that is typically good for stocks, just not great. However, our quantitative process, which combines sentiment and trend, is positive. Thus, viewing the Crowd at Extremes through this combined lens indicates a yellow light in our rating continuum.
Copyright 2023 Ned Davis Research, Inc. Further distribution prohibited without prior permission. All Rights Reserved. See NDR Disclaimer at ndr.com/copyright.html. For data vendor disclaimers refer to ndr.com/vendorinfo/. Past performance is no guarantee of future results. Shown for illustrative purposes.
CONCLUSION: Signals Are Mixed, But Quantitative Process Signaling a Flashing Green Light Domestically.
The combined signals looking through the qualitative lens as discussed through this piece are signaling a flashing yellow light. However, our quantitative process, which combines trend and crowd sentiment to forecast the probability of the S&P 500 having positive returns over the next three months is signaling a flashing green light. When we combine the qualitative and quantitative signals, we arrive at a more positive conclusion than the three rules would suggest in isolation domestically. For this reason, we continue to slightly favor stocks over bonds in our balanced portfolios.
At the other end of the spectrum, internationally both our qualitative and quantitative signals are signaling a flashing red light.
Risk Discussion: All investments in securities, including the strategies discussed above, include a risk of loss of principal (invested amount) and any profits that have not been realized. Markets fluctuate substantially over time, and have experienced increased volatility in recent years due to global and domestic economic events. Performance of any investment is not guaranteed. In a rising interest rate environment, the value of fixed-income securities generally declines. Diversification does not guarantee a profit or protect against a loss. Investments in international and emerging markets securities include exposure to risks such as currency fluctuations, foreign taxes and regulations, and the potential for illiquid markets and political instability. Please see the end of this publication for more disclosures.
Important Disclosure Information:
The comments above refer generally to financial markets and not RiverFront portfolios or any related performance. Opinions expressed are current as of the date shown and are subject to change. Past performance is not indicative of future results and diversification does not ensure a profit or protect against loss. All investments carry some level of risk, including loss of principal. An investment cannot be made directly in an index.
Information or data shown or used in this material was received from sources believed to be reliable, but accuracy is not guaranteed.
This report does not provide recipients with information or advice that is sufficient on which to base an investment decision. This report does not take into account the specific investment objectives, financial situation or need of any particular client and may not be suitable for all types of investors. Recipients should consider the contents of this report as a single factor in making an investment decision. Additional fundamental and other analyses would be required to make an investment decision about any individual security identified in this report.
Chartered Financial Analyst is a professional designation given by the CFA Institute (formerly AIMR) that measures the competence and integrity of financial analysts. Candidates are required to pass three levels of exams covering areas such as accounting, economics, ethics, money management and security analysis. Four years of investment/financial career experience are required before one can become a CFA charterholder. Enrollees in the program must hold a bachelor’s degree.
All charts shown for illustrative purposes only. Technical analysis is based on the study of historical price movements and past trend patterns. There are no assurances that movements or trends can or will be duplicated in the future.
Ned Davis Research (NDR) is a global provider of independent investment research, solutions, and tools. Founded in 1980, NDR helps clients around the world make objective investment decisions.
Stocks represent partial ownership of a corporation. If the corporation does well, its value increases, and investors share in the appreciation. However, if it goes bankrupt, or performs poorly, investors can lose their entire initial investment (i.e., the stock price can go to zero). Bonds represent a loan made by an investor to a corporation or government. As such, the investor gets a guaranteed interest rate for a specific period of time and expects to get their original investment back at the end of that time period, along with the interest earned. Investment risk is repayment of the principal (amount invested). In the event of a bankruptcy or other corporate disruption, bonds are senior to stocks. Investors should be aware of these differences prior to investing.
In general, the bond market is volatile, and fixed income securities carry interest rate risk. (As interest rates rise, bond prices usually fall, and vice versa). This effect is usually more pronounced for longer-term securities). Fixed income securities also carry inflation risk, liquidity risk, call risk and credit and default risks for both issuers and counterparties. Lower-quality fixed income securities involve greater risk of default or price changes due to potential changes in the credit quality of the issuer. Foreign investments involve greater risks than U.S. investments, and can decline significantly in response to adverse issuer, political, regulatory, market, and economic risks. Any fixed-income security sold or redeemed prior to maturity may be subject to loss.
Investing in foreign companies poses additional risks since political and economic events unique to a country or region may affect those markets and their issuers. In addition to such general international risks, the portfolio may also be exposed to currency fluctuation risks and emerging markets risks as described further below.
Changes in the value of foreign currencies compared to the U.S. dollar may affect (positively or negatively) the value of the portfolio’s investments. Such currency movements may occur separately from, and/or in response to, events that do not otherwise affect the value of the security in the issuer’s home country. Also, the value of the portfolio may be influenced by currency exchange control regulations. The currencies of emerging market countries may experience significant declines against the U.S. dollar, and devaluation may occur subsequent to investments in these currencies by the portfolio.
Foreign investments, especially investments in emerging markets, can be riskier and more volatile than investments in the U.S. and are considered speculative and subject to heightened risks in addition to the general risks of investing in non-U.S. securities. Also, inflation and rapid fluctuations in inflation rates have had, and may continue to have, negative effects on the economies and securities markets of certain emerging market countries.
Index Definitions:
Standard & Poor’s (S&P) 500 Index measures the performance of 500 large cap stocks, which together represent about 80% of the total US equities market.
MSCI ACWI ex USA Index captures large and mid-cap representation across approximately 22 of 23 developed markets (DM) countries (excluding the US) and approximately 25 emerging markets (EM) countries.
Definitions:
Personal consumption expenditures (PCE), also known as consumer spending, is a measure of the spending on goods and services by people of the United States.
The Group of Seven (G7) is an informal grouping of seven of the world’s advanced economies, including Canada, France, Germany, Italy, Japan, the United Kingdom, and the United States, as well as the European Union.
The 200-day moving average is a popular technical indicator which investors use to analyze price trends. It is simply a security’s average closing price over the last 200 days.
The European Central Bank (ECB) is the central bank responsible for monetary policy of the European Union (EU) member countries that have adopted the euro currency. This currency union is known as the eurozone and currently includes 19 countries. The ECB’s primary objective is price stability in the euro area.
The Bank of England (BoE) is the central bank of the United Kingdom. The BoE oversees monetary policy and issues currency. It also regulates banks, financial firms, and payment systems. Like other central banks, the BoE may act as a lender of last resort in a financial crisis.
Interest rate sensitivity is a measure of how much the price of a fixed-income asset will fluctuate as a result of changes in the interest rate environment. Securities that are more sensitive have greater price fluctuations than those with less sensitivity. This type of sensitivity must be taken into account when selecting a bond or other fixed-income instrument the investor may sell in the secondary market. Interest rate sensitivity affects buying as well as selling.
Don’t Fight the Fed – ‘Supportive’ means the Fed’s monetary policy regarding inflation and employment is in what we believe based on our analysis to be the investors’ best interest; ‘Against’ means the Fed’s monetary policy, in our view, is going against the investors’ best interest; ‘Neutral’ means the Fed’s monetary policy is neither supportive or against the investors’ best interest in our view. Don’t Fight the Trend – Terms correlate to the 200-day moving average as it relates to the equity indexes: ‘Positive’ means that the trend is rising, ‘Flat’ means the trend is flat, ‘Negative’ means the trend is falling. Beware the Crowd at Extremes – Terms correlate to the NDR Crowd Sentiment Poll and its measurement of Extreme Optimism (Bearish), Neutral, or Extreme Pessimism (Bullish).
RiverFront Investment Group, LLC (“RiverFront”), is a registered investment adviser with the Securities and Exchange Commission. Registration as an investment adviser does not imply any level of skill or expertise. Any discussion of specific securities is provided for informational purposes only and should not be deemed as investment advice or a recommendation to buy or sell any individual security mentioned. RiverFront is affiliated with Robert W. Baird & Co. Incorporated (“Baird”), member FINRA/SIPC, from its minority ownership interest in RiverFront. RiverFront is owned primarily by its employees through RiverFront Investment Holding Group, LLC, the holding company for RiverFront. Baird Financial Corporation (BFC) is a minority owner of RiverFront Investment Holding Group, LLC and therefore an indirect owner of RiverFront. BFC is the parent company of Robert W. Baird & Co. Incorporated, a registered broker/dealer and investment adviser.
To review other risks and more information about RiverFront, please visit the website at riverfrontig.com and the Form ADV, Part 2A. Copyright ©2023 RiverFront Investment Group. All Rights Reserved. ID 3143503
For more news, information, and analysis, visit the ETF Strategist Channel.