

We constructed four portfolios using the two factor rotation definitions and the two economic cycle definitions. Generically, at the end of each month, we would use the next month’s economic cycle label to identify which factors to hold in our portfolio. Identified factors were held in equal weight.
Below we plot the four equity curves. Remember that these series are generated using de-meaned return data, so reflect the out-performance against an equal-weight factor benchmark.
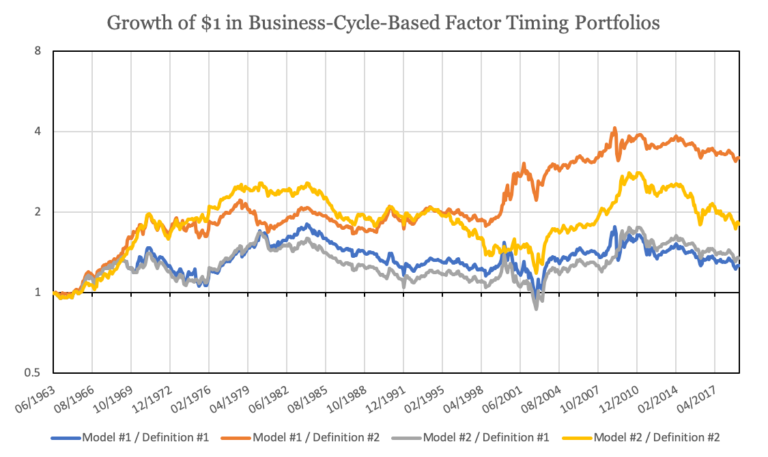
Source: NBER, AQR, and Kenneth French Data Library. Calculations by Newfound Research. Returns are backtested and hypothetical. Returns assume the reinvestment of all distributions. Returns are gross of all fees. None of the strategies shown reflect any portfolio managed by Newfound Research and were constructed solely for demonstration purposes within this commentary. You cannot invest in an index.
It would appear that even with a crystal ball, conventional wisdom about style rotation and business cycles may not hold. And even where it might, we can see multi-decade periods where it adds little-to-no value.
Data-Mining Our Way to Success
If we are going to use a crystal ball, we might as well just blatantly data-mine our way to success and see what we learn along the way.
To achieve this goal, we can simply look at the annualized de-meaned returns of each factor during each period of the business cycle.
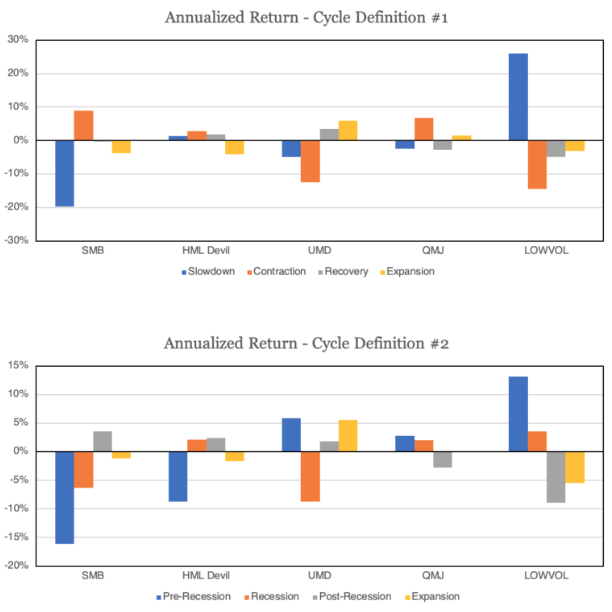
Source: NBER, AQR, and Kenneth French Data Library. Calculations by Newfound Research. Returns are backtested and hypothetical. Returns assume the reinvestment of all distributions. Returns are gross of all fees. None of the strategies shown reflect any portfolio managed by Newfound Research and were constructed solely for demonstration purposes within this commentary. You cannot invest in an index.
Despite two different definitions of the business cycle, we can see a strong alignment in which factors work when. Slow-downs / pre-recessionary periods are tilted towards momentum and defensive factors like quality and low-volatility. Momentum may seem like a curious factor, but its high turnover may give it a chameleon-like nature that can tilt it defensively in certain scenarios.
In a recession, momentum is replaced with value while quality and low-volatility remain. In the initial recovery, small-caps, value, and momentum are favored. In this case, while value may actually be benefiting from multiple expansion, small-caps may simply be a way to play higher beta. Finally, momentum is strongly favored during an expansion.
Yet even a data-mined solution is not without its flaws. Below we plot rolling 3-year returns for our data-mined timing strategies. Again, remember that these series are generated using de-meaned return data, so reflect the out-performance against an equal-weight factor benchmark.
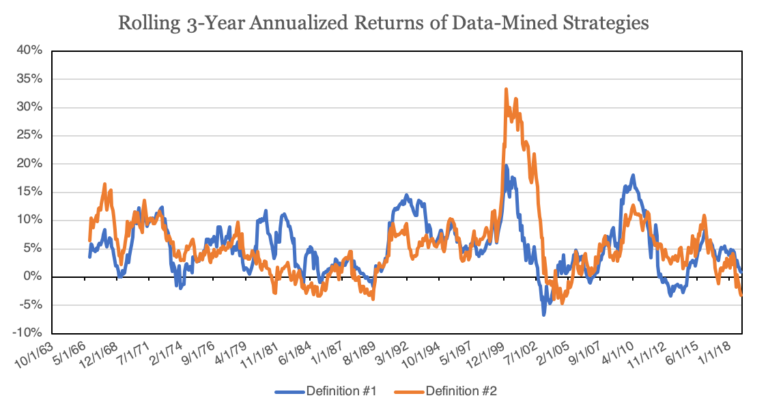
Source: NBER, AQR, and Kenneth French Data Library. Calculations by Newfound Research. Returns are backtested and hypothetical. Returns assume the reinvestment of all distributions. Returns are gross of all fees. None of the strategies shown reflect any portfolio managed by Newfound Research and were constructed solely for demonstration purposes within this commentary. You cannot invest in an index.
Despite a crystal ball telling us what part of the business cycle we are in and completely data-mined results, there are still a number of 3-year periods with low-to-negative results. And we have not even considered manager costs, transaction costs, or taxes yet.
A few more important things to note.
Several of these factors exhibit strong negative performance during certain parts of the market cycle, indicating a potential for out-performance by taking the opposite side of the factor. For example, value appears to do poorly during pre-recession and expansion periods. One hypothesis is that during expansionary periods, markets tend to over-extrapolate earnings growth potential, favoring growth companies that appear more expensive.
We should also remember that our test is on long/short portfolios and may not necessarily be relevant for long-only investors. While we can think of a long-only portfolio as a market-cap portfolio plus a long/short portfolio, the implicit long/short is not necessarily identical to academic factor definitions.
Finally, it is worth considering that these results are data-mined over a 50+ year period, which may allow outlier events to dramatically skew the results. Momentum, for example, famously exhibited dramatic crashes during the Great Depression and in the 2008-crisis, but may have actually relatively out-performed in other recessions.
Conclusion
In this commentary we sought to answer the question, “can we use the business cycle to time factor exposures?” Assuming access to a crystal ball that could tell us where we stood precisely in the business cycle, we found that conventional wisdom about factor timing did not add meaningful value over time. We do not hold out much hope, based on this conventional wisdom, that someone without a crystal ball would fare much better.
Despite explicitly trying to select models that reflected conventional wisdom, we found a significant degree of similarity in these recommendations with those that came from blindly data-mining optimal results. Nevertheless, even slight recommendation differences lead to lackluster results.
The similarities between data-mined results and conventional wisdom, however, should give us pause. While the argument for conventional wisdom is often a well-articulated economic rationale, we have to wonder whether we have simply fooled ourselves with a narrative that has been inherently constructed with the benefit of hindsight.