

In the first three weeks of 2024, the markets have been primarily led by technology-related stocks. Technology stocks bounced last week after selling off in the first week of the year. Last week, the S&P 500 rose +1.17%. Only two sectors outperformed that mark. The Communications sector was up +1.38%, while the Information Technology sector rose a whopping +4.13%. Meanwhile, the equal-weight S&P 500 (which evenly weights its 503 components) finished slightly down for the week.
Sector Rankings
Our proprietary research at Canterbury applies both a rating and ranking to liquid securities, such as stocks and ETFs. For the ranking component, we rank stocks and ETFs using a “risk-adjusted” relative strength, which we call Volatility-Weighted-Relative-Strength. This ranking considers a sector’s performance relative to its volatility, or degree of fluctuation. Looking at the 11 sector ETFs, here is how the US sectors currently rank on a risk-adjusted basis:
Source: Canterbury Investment Management. Sectors ranked use data from SPDR ETFs. Sectors are ranked by Canterbury’s Volatility-Weighted-Relative-Strength indicator.
Only three sectors have a higher risk-adjusted ranking than the S&P 500. Those three sectors collectively account for more than half of the S&P 500’s market capitalization and have carried the index higher in 2024 while other sectors lag on a risk-adjusted basis.
Chart of the Week- Amazon
The featured chart this week is Amazon. Amazon is the largest stock in the Consumer Discretionary sector. In the table displaying the sector rankings (above), Discretionary ranks sixth out of the 11 sectors (not including the S&P 500 index). Part of the reason for this lower sector rank is because of a recent decline in Tesla (the sector’s second largest stock). For a comment on Tesla, refer to our previous updates this year.
Here are some technical comments on Amazon. Refer to the chart below.
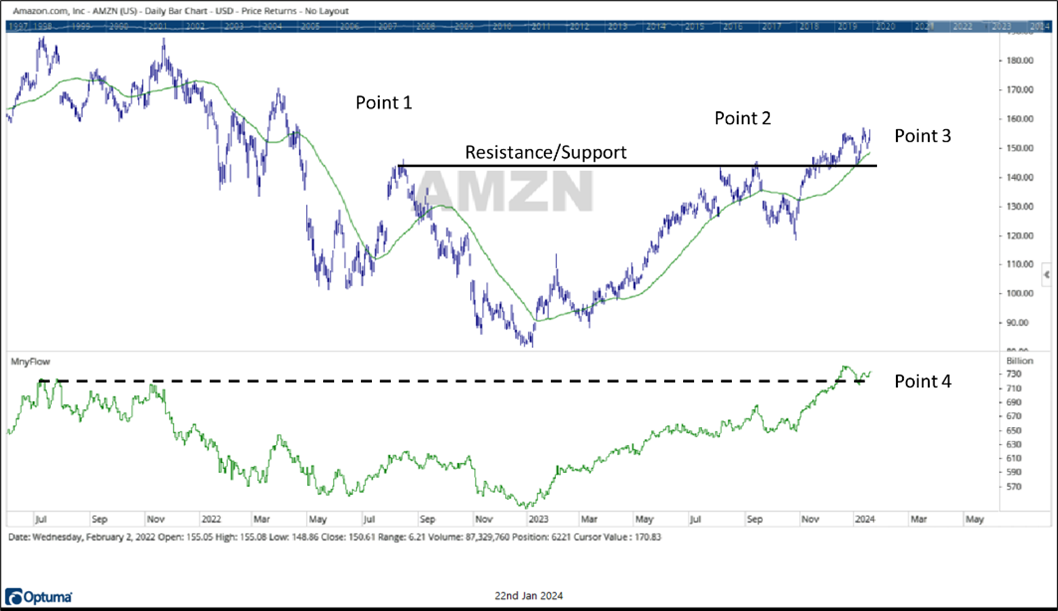
Source: Canterbury Investment Management. Chart created using Optuma Technical Analysis Software
1. At Point 1, Amazon broke down, and then rallied to a peak during the summer of 2022. This peak is where an initial resistance level was established.
2. At Point 2, following a steep decline, Amazon began to show more stable characteristics and upward fluctuation. The stock rallied to the previous peak (resistance level), before pulling back below its 50-day moving average.
3. At Point 3, Amazon rallied to the resistance level once again, this time breaking through. The stock recently tested the previous resistance for support. Support held and Amazon bounced higher. It is typical for a stock to test previous resistance for support.
4. Point 4 shows the stock’s MoneyFlow index, which is a volume indicator. You can see that although Amazon’s share price is not a new high, its MoneyFlow index is at a new high (positive divergence). This means that the stock has been closing in the upper half of its daily trading range and there has been more money that wanted into Amazon than out of it.
Bottom Line
The markets will go as far as technology stocks will go. The Information Technology sector is more than double the size of the next largest sector. When you add in the Communications sector, Tesla, and Amazon, those stocks account for 42% of the index’s capitalization.
The Canterbury Portfolio Thermostat is diversified into stocks and Exchange Traded Funds that represent sectors and industries. On the technology side, we currently have positions in the two leading sectors, Information Technology and Communications. We also own a stock position in Bank of America, which is in the financial sector. Financials is ranked as the third sector in our risk-adjusted rankings. Additionally, we own a position in Amazon, which was highlighted in this week’s update.
The portfolio also has exposure to other sectors. The Consumer Staples sector has been weak in the last few months. It is currently ranked 8th out of the 11th sectors. One of its largest stocks, Costco, however, is one of the top ranked S&P 500 stocks and recently hit a new all time high. The Portfolio Thermostat has owned this position for several months. Other positions include O’Reilly, Aflac, and two biotech stocks.
For risk management purposes, rather than owning bonds, the Portfolio Thermostat holds some inverse positions, which move in the opposite direction of their underlying index. These inverse positions are in some of the market’s weaker areas, such as Emerging Markets. Emerging Markets has heavy exposure to China, which is putting in lower lows. Inverse positions can help reduce risks when markets become volatile.
The Canterbury Portfolio Thermostat is an adaptive portfolio management strategy. Markets are dynamic and market conditions will change over time. The Portfolio Thermostat is designed to move in concert with ever-changing market environments and adapt both its holdings and allocations to maintain stable volatility.
For more news, information, and analysis, visit the ETF Strategist Channel.