

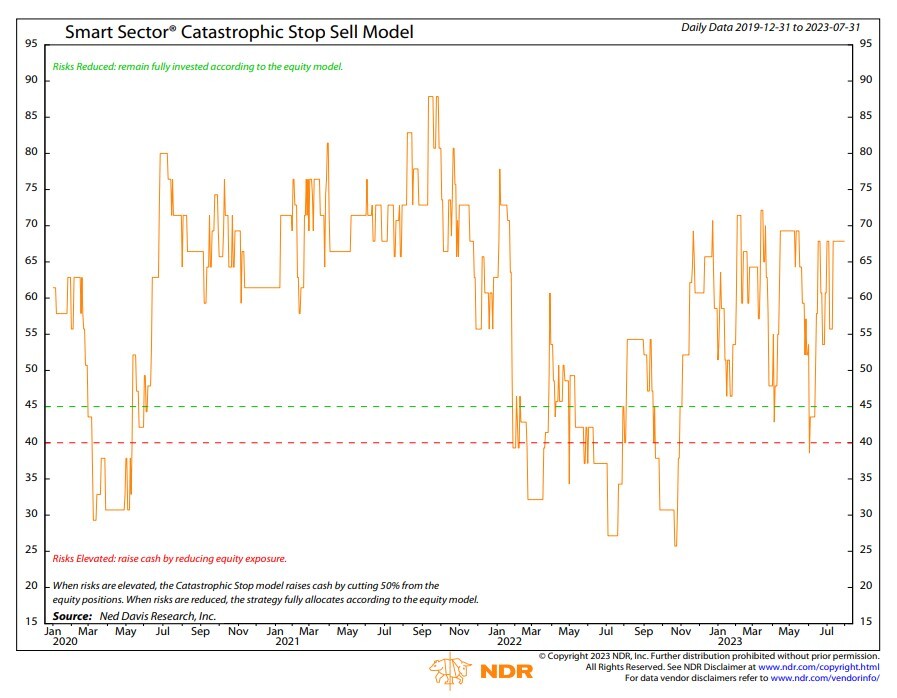
Catastrophic Stop Update
The NDR Catastrophic Stop Sell model combines time-tested, objective indicators designed to identify high-risk periods for the equity market. The model (Figure 1) was unchanged from last month and entered August with a fully invested equity allocation recommendation.
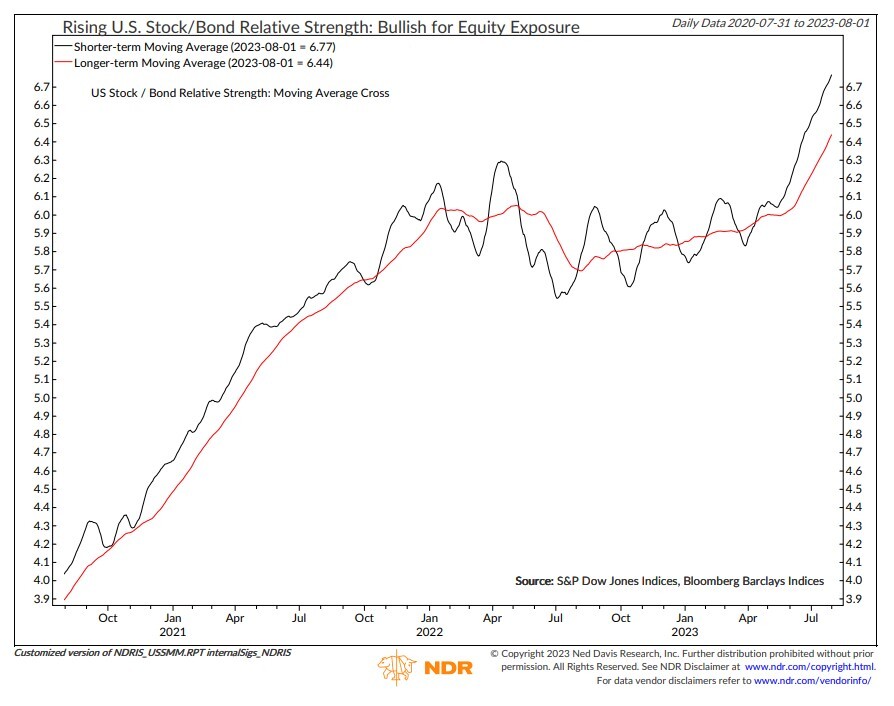
The model’s steadiness is driven by five (of seven) internal (price-based) measures that remain bullish, including rising stock/bond relative strength (Figure 2). While external influences such as trade and market sentiment remained bearish, they’re offset by bullish readings from high-yield and emerging market bond breadth, as well as high-yield option-adjusted spreads. For now, the weight of the evidence recommends a fully invested allocation to equities according to the model.
Figure 2: Rising U.S. Stock/Bond Relative Strength: Bullish for Equity Exposure.
Global Market Update
The ACWI ex. U.S. Total Return Index increased over 409 basis points (bps) in July. The index gained more than 400 bps for a second consecutive month, which last occurred in late 2020. Among the strongest-performing markets were Turkey, Colombia, South Africa, Peru, and China, while the largest underperformers included Egypt, Portugal, Finland, Taiwan, and Denmark.
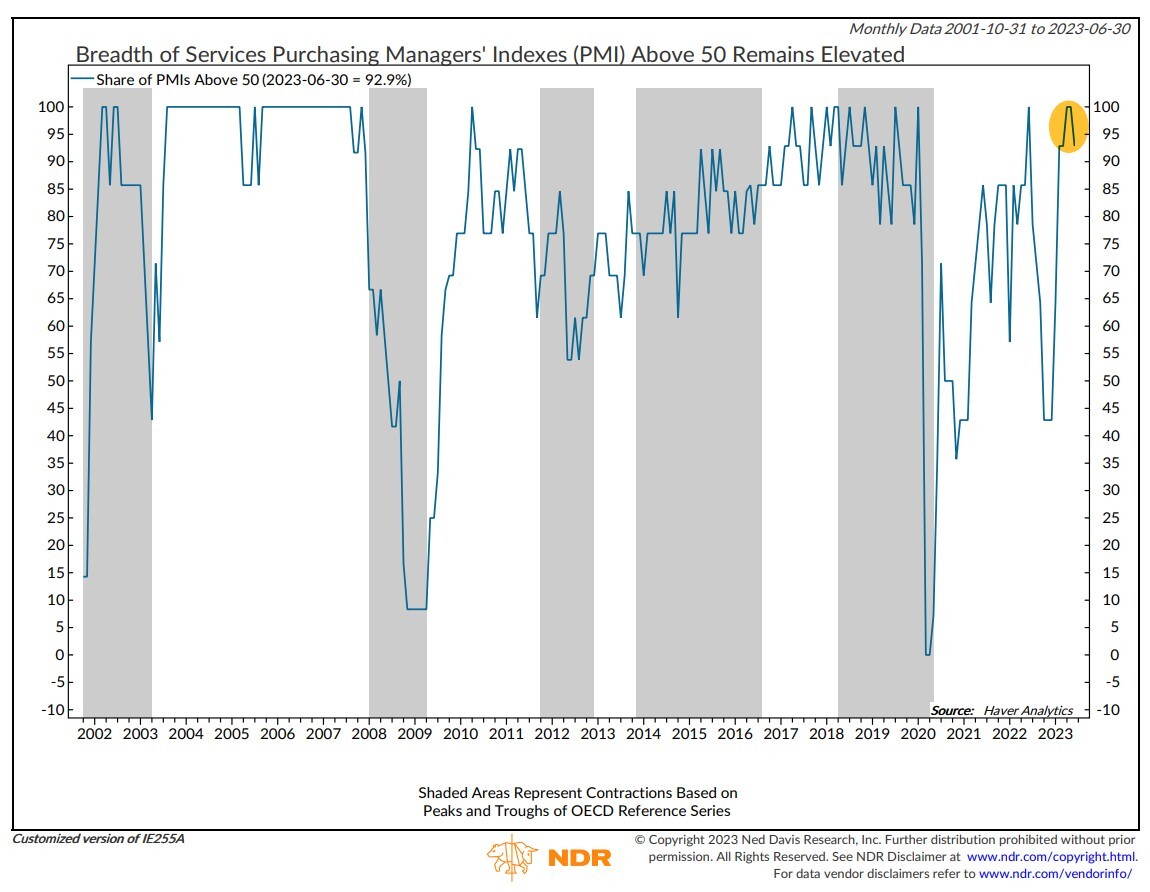
Global economic momentum eased in June, according to the latest S&P Global Purchasing Managers’ Index (PMI) readings. The combined services and manufacturing global PMI declined. It was the first deceleration in growth since November and the weakest reading in four months. Even so, the global PMI remains firmly in expansion territory and well above the levels observed during global recessions. The future output index even ticked up further into positive territory in June.
Global growth has been almost entirely led by the services sector (Figure 3), which grew at a slower pace in June. Manufacturing continued to deteriorate, suggesting the global economy may be entering a manufacturing recession. However, the sector has also been a notable source of global disinflation.
Among countries and regions, growth has been the strongest in emerging markets outside of China. On the other hand, the eurozone, which was the star earlier in the year, has seen momentum deteriorate in recent months. The second half of the year will be more challenging for the global economy amid tighter credit conditions, sticky services inflation, and easing Chinese economic growth.
Entering August, the non-U.S. equity Core model overweighted Australia, Germany, Canada, and China, while underweighting the U.K., Japan, France, and Switzerland. The Explore model favored Chile, India, South Korea, Sweden, and Taiwan.
Figure 3: Breadth of Services Purchasing Managers’ Indexes (PMI) Above 50 Remains Elevated
Core Allocations
China continues to be overweight. Although slowing, both the official and Caixin composite PMIs stayed firmly in growth territory as of their latest readings for June. Engagement in the economy via measures of passenger traffic and subway usage remains high and at pre-pandemic levels.
Also, industrial activity has stabilized. Annual industrial production growth accelerated to 4.4% in June from a 3.3% pace in the prior month. The absolute trend has recently broken out higher after declining for most of the year (Figure 4).
Figure 4: MSCI China Absolute Trend Has Started To Move Higher
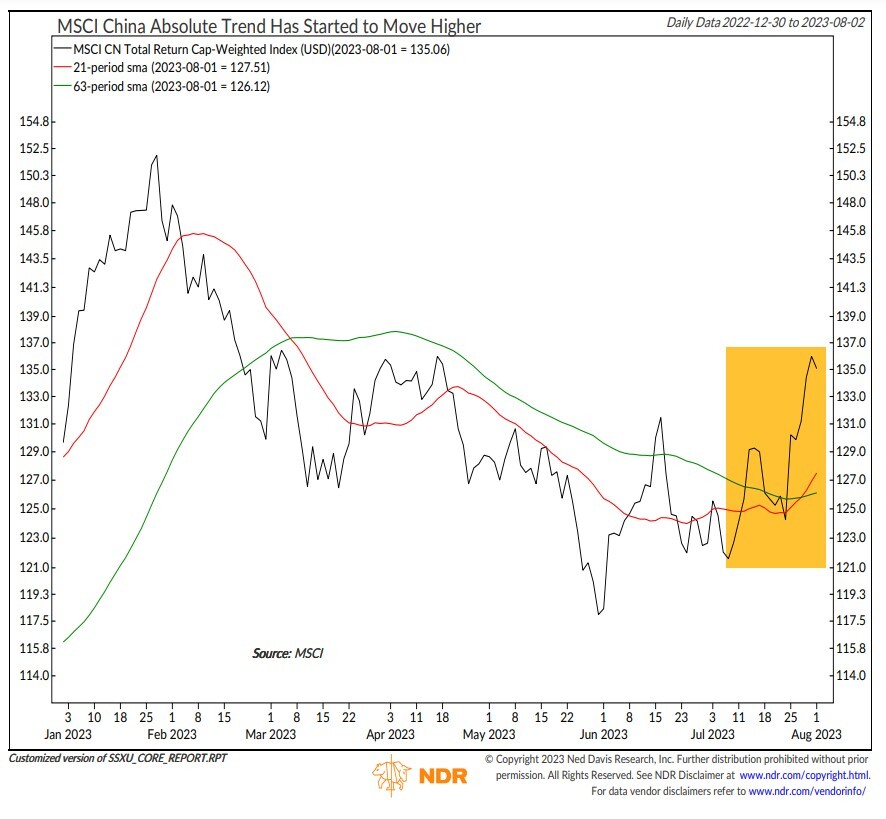
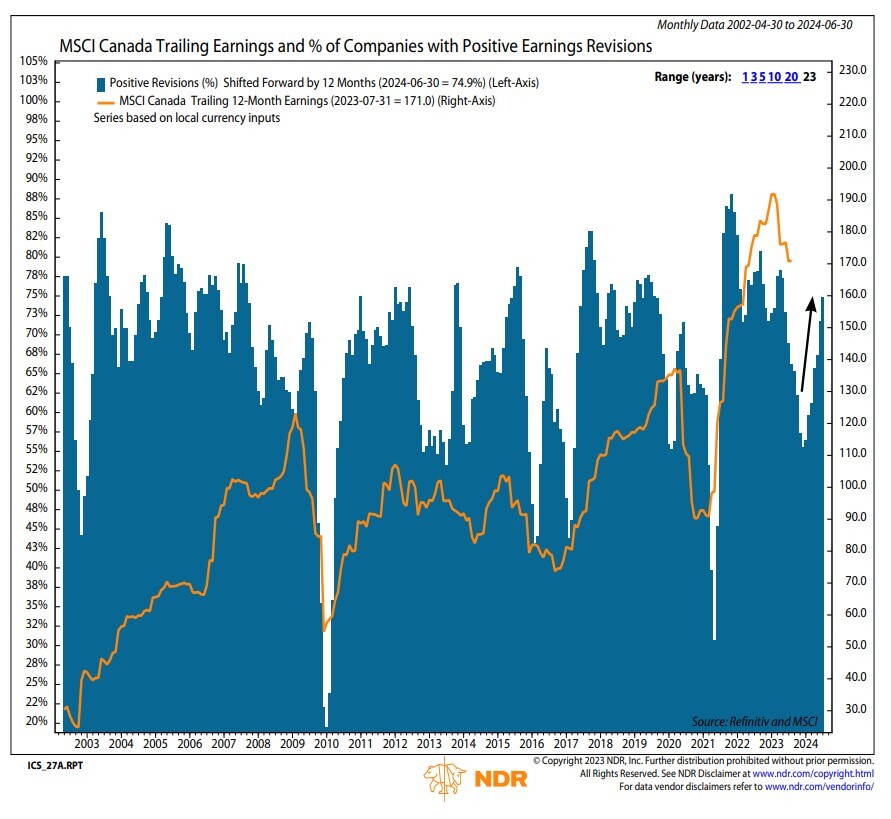
Figure 5: MSCI Canada Trailing Earnings and % of Companies with Positive Earnings Revisions
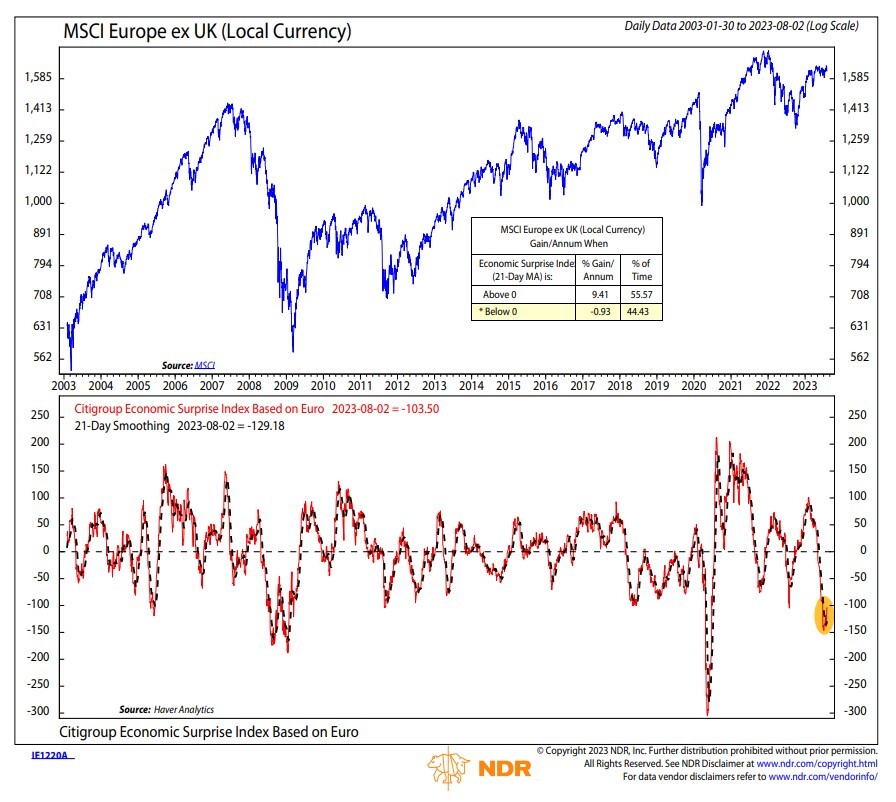
France and Switzerland are both underweight as recession risks within Europe are rising. The flash PMIs for July are signaling a poor start to the third quarter. The composite PMI signaled contraction for a second straight month. The Ifo business climate survey, an excellent leading indicator for the economy, fell to its lowest level this year. The Citigroup Economic Surprise Index (Figure 6) is at its lowest level since the beginning of the pandemic.
Figure 6: MSCI Europe ex UK (Local Currency)
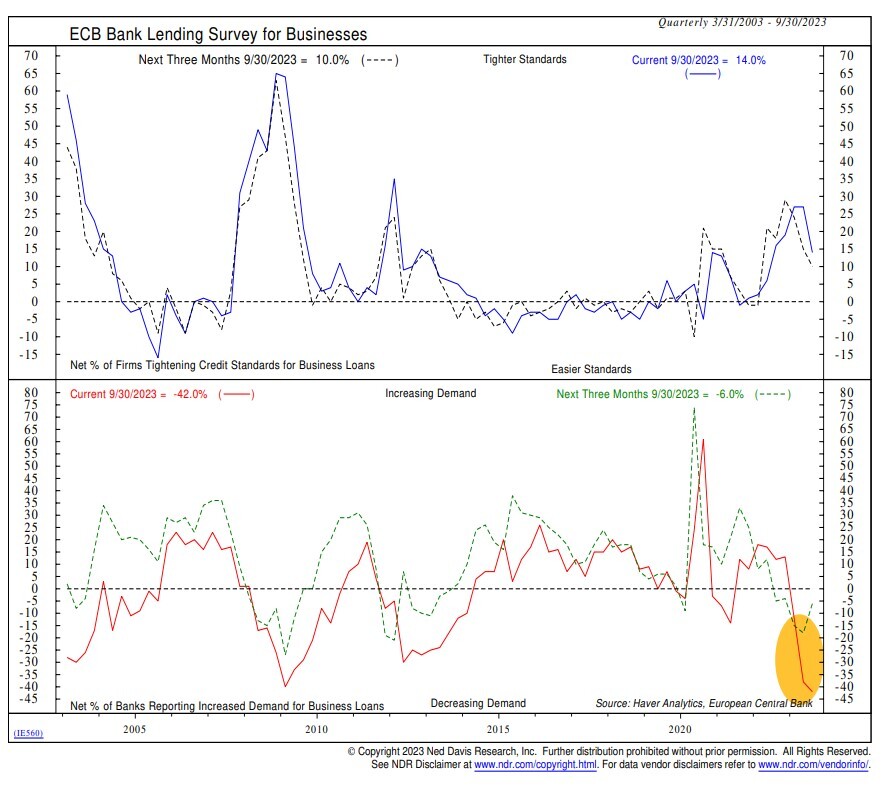
The latest European Central Bank (ECB) Bank Lending Survey indicated further weakening conditions for bank lending. Demand continued to plunge across all loan types at a pace not seen since the European sovereign debt crisis, reflecting the effect of higher interest rates and the slowing economy. Notably, the demand for business loans fell to the lowest since data began in 2003 (Figure 7).
Figure 7: ECB Bank Lending Survey for Businesses
Explore Opportunities
Among the top-ranked Explore markets are Chile, India, South Korea, Sweden, and Taiwan:
- India, South Korea, Sweden, and Taiwan have favorable price trends as their 50-day moving averages trade above their 200-day counterparts.
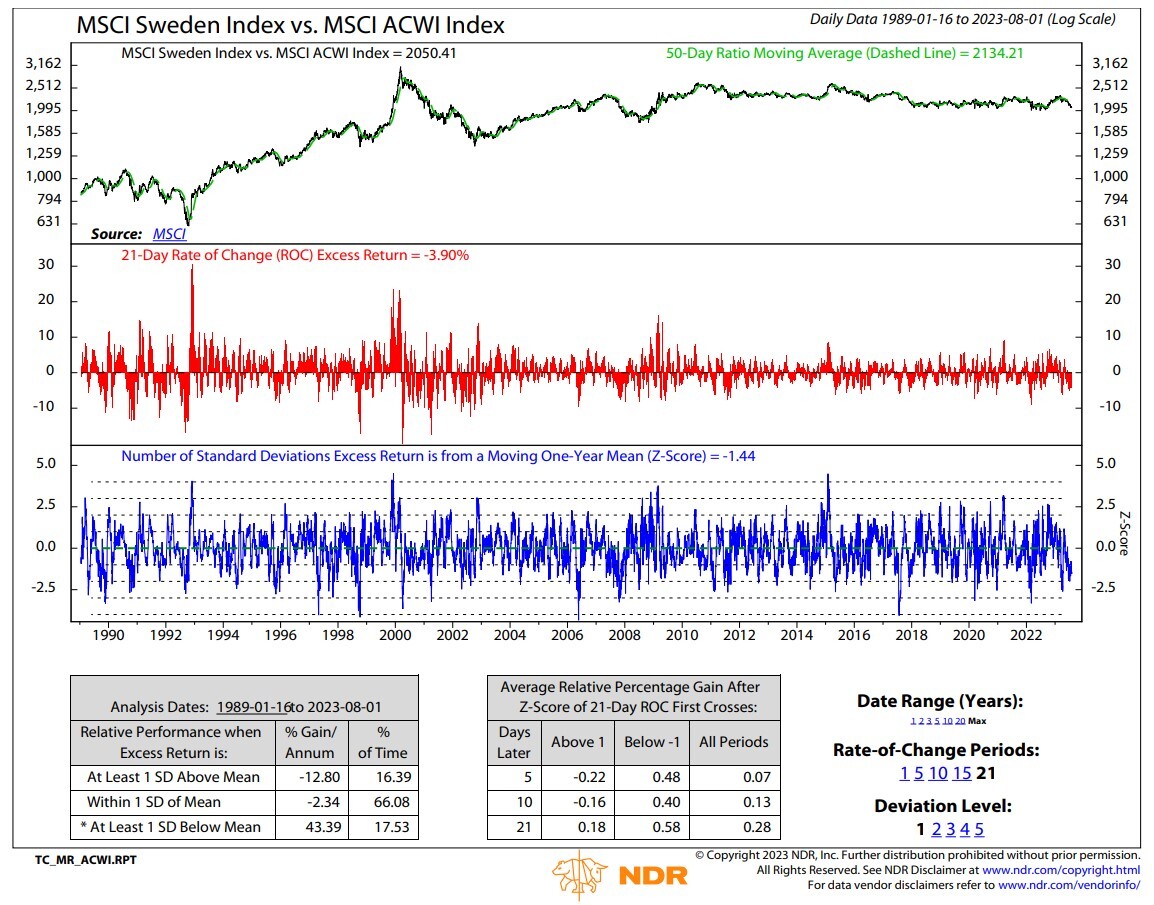
- Over the last 21 days, Sweden is more than one standard deviation oversold, which historically has provided a near-term bounce opportunity (Figure 8).
- Chile and India have low market capitalization-to-GDP ratios, which typically indicate a favorable valuation.
- India has one of the largest composite PMI readings.
- India, South Korea, and Sweden have double-digit one-year forward earnings growth estimates.
- India, South Korea, and Sweden have over 75% of stocks with positive earnings revisions from analysts.
Figure 8: MSCI Sweden Index vs. MSCI ACWI Index
Summary
The Catastrophic Stop model improved from last month, as it continues to recommend a fully invested allocation.
Entering August, the non-U.S. equity Core model overweighted Australia, Germany, Canada, and China, while underweighting the U.K., Japan, France, and Switzerland. The Explore model favored Chile, India, South Korea, Sweden, and Taiwan.
The models combine macro, fundamental, technical, and sentiment indicators to determine opportunities and identify risks in an objective, weight-of-the-evidence approach.
Strategy Description
- The Smart Sector® International strategy combines three Ned Davis Research quantitative investment strategies: The Core International, Explore International, and the NDR Catastrophic Stop.
Core Allocation
- The fund begins by overweighting and underweighting the largest non-U.S. equity markets based on Ned Davis Research’s proprietary models.
- Each of the models utilize market-specific, weight-of-the-evidence composites of fundamental, economic, technical, and behavioral indicators to determine each area’s probability of outperforming the ACWI ex. U.S. Markets are weighted accordingly relative to benchmark weightings.
Explore Allocation
- To select smaller markets, the fund uses a multi-factor technical ranking system to choose the top markets. The markets with the highest rankings split the non-Core model allocation equally.
When market risks become extraordinarily high — reduce your portfolio risk
- The model remains fully invested unless the Ned Davis Research Catastrophic Sell Stop (CSS) model is triggered, whereupon the equity-invested position is trimmed to 50%.
- The NDR Catastrophic Sell Stop model combines time-tested, objective indicators designed to identify periods of high risk for the broad U.S. equity market. The model uses price-based, breadth, deviation from trend, fundamental, economic, interest rate, behavioral and volatility-based indicator composites.
When market risks return to normal — put your money back to work
- When the NDR CSS model moves back to bullish levels, indicating lower risk, the strategy immediately moves back to fully invested.
For more information, please contact us at:
Day Hagan Asset Management
1000 S. Tamiami Trl
Sarasota, FL 34236
Toll Free: (800) 594-7930
Office Phone: (941) 330-1702
Website: https://dayhagan.com/ or https://dhfunds.com/
Ned Davis Research Disclaimer:
The data and analysis contained within are provided “as is” and without warranty of any kind, either express or implied. The information is based on data believed to be reliable, but it is not guaranteed. NDR DISCLAIMS ANY AND ALL EXPRESS OR IMPLIED WARRANTIES, INCLUDING, BUT NOT LIMITED TO, ANY WARRANTIES OF MERCHANTABILITY, SUITABILITY OR FITNESS FOR A PARTICULAR PURPOSE OR USE. All performance measures do not reflect tax consequences, execution, commissions, and other trading costs, and as such investors should consult their tax advisors before making investment decisions, as well as realize that the past performance and results of the model are not a guarantee of future results. The Smart Sector® Strategy is not intended to be the primary basis for investment decisions and the usage of the model does not address the suitability of any particular in Fixed Income vestment for any particular investor.
Using any graph, chart, formula, model, or other device to assist in deciding which securities to trade or when to trade them presents many difficulties and their effectiveness has significant limitations, including that prior patterns may not repeat themselves continuously or on any particular occasion. In addition, market participants using such devices can impact the market in a way that changes the effectiveness of such devices. NDR believes no individual graph, chart, formula, model, or other device should be used as the sole basis for any investment decision and suggests that all market participants consider differing viewpoints and use a weight of the evidence approach that fits their investment needs.
DISCLOSURES
Past performance does not guarantee future results. No current or prospective client should assume future performance of any specific investment or strategy will be profitable or equal to past performance levels. All investment strategies have the potential for profit or loss. Changes in investment strategies, contributions or withdrawals and economic conditions may materially alter the performance of your portfolio. Different types of investments involve varying degrees of risk, and there can be no assurance that any specific investment or strategy will be suitable or profitable for a client’s portfolio. Historical performance results for investment indexes and/or categories generally do not reflect the deduction of transaction and/or custodial charges or the deduction of an investment management fee, the incurrence of which would have the effect of decreasing historical performance results. There can be no assurances that a portfolio will match or outperform any particular benchmark.
Day Hagan Asset Management is registered as an investment adviser with the United States Securities and Exchange Commission. SEC registration does not constitute an endorsement of the firm by the Commission nor does it indicate that the adviser has attained a particular level of skill or ability.
References to “NDR” throughout refer to Ned Davis Research, Inc. Clients engaging in this strategy will be advised by Day Hagan and will not have a contractual relationship with NDR. Day Hagan purchases signals from NDR, and Day Hagan is responsible for executing transactions on behalf of its clients and has discretion in how to implement the strategy.
NDR is a registered as an investment adviser with the Securities and Exchange Commission (SEC). NDR serves as the Signal Provider in connection with this strategy. The information provided here has not been approved or verified by the SEC or by any state or other authority. Additional information about NDR also is available on the SEC’s website at https://www.adviserinfo.sec.gov/. This material is provided for informational purposes only and is not intended as an offer or solicitation with respect to the purchase or sale of any security or other financial instrument or to participate in any trading strategy. NDR’s strategies, including the model discussed in this publication, are intended to be used only by sophisticated investment professionals.
There may be a potential tax implication with a rebalancing strategy. Re-balancing involves selling some positions and buying others, and this activity results in realized gains and losses for the positions that are sold. The performance calculations do not reflect the impact that paying taxes would have, and for taxable accounts, any taxable gains would reduce the performance on an after-tax basis. This reduction could be material to the overall performance of an actual trading account. NDR does not provide legal, tax or accounting advice. Please consult your tax advisor in connection with this material, before implementing such a strategy, and prior to any withdrawals that you make from your portfolio.
There is no guarantee that any investment strategy will achieve its objectives, generate dividends or avoid losses.
© 2023 Ned Davis Research, Inc. | © 2023 Day Hagan Asset Management, LLC
For more news, information, and analysis, visit the ETF Strategist Channel.