

By Grant Engelbart, CFA, CAIA – Director of Research & Senior Portfolio Manager, CLS Investments
Smart beta has become synonymous with the ETF universe, soaring in popularity after the 2008 financial crisis. By Morningstar’s measure, there are almost 700 smart beta ETFs in the marketplace (30% of the total). With this explosion of launches and products (factor, multifactor, double factor, comprehensive factor, diversified; you get the point) the natural question is: do these products truly work? I don’t have a firm answer because of the sheer number of ways to measure “work” and the fact that time is needed to assess any product’s performance. However, I found some interesting results by reviewing the equity smart beta space in aggregate to see if more launches are adding or subtracting value.
This was definitely a crude attempt but an important assessment of the universe. I reviewed three different measures (you could look at infinitely more) that would be natural fits when observing performance. In each, I used the Morningstar category index, or the index assigned to a particular ETF, to measure performance. Note this is not the ETF’s underlying benchmark, nor is it the Morningstar category return.
The first place to start is excess returns. Below, I have measured 12-month rolling excess returns versus the applicable index and then averaged those aggregate returns over time. The data begins in 2005 when there were just 36 ETFs (that still exist) in the smart beta space. While this is a small number, I included that history because it’s important to see the impact of new products to the overall space. As shown, excess returns troughed in 2006 and then headed higher, particularly through the 2008 financial crisis, eventually ticking positive. From there, somewhat as expected, excess returns began to flatline as more and more launches came on board. They have recently ticked back slightly negative. By my estimation, this is due to the underperformance of the value factor as many ETFs utilize value in their methodologies.
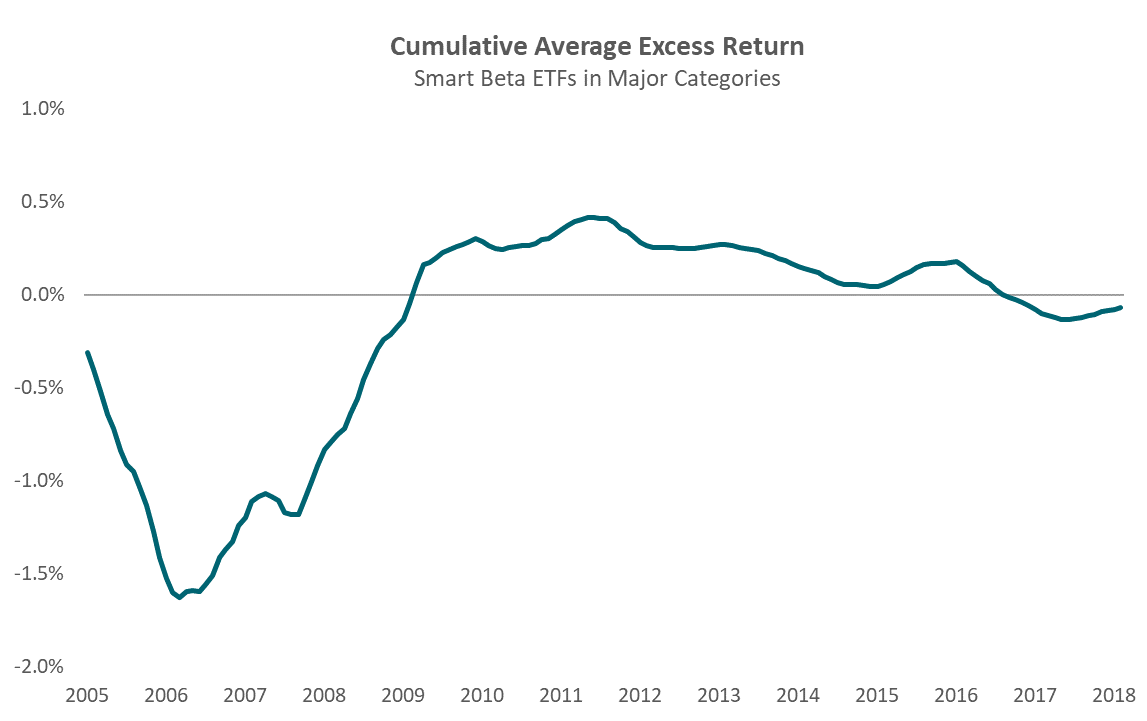
Source: Morningstar. Cumulative excess return is measured as rolling 12-month returns versus the applicable Morningstar category index, averaged through time from January 1, 2005, to January 31, 2019. Included are equity smart beta ETFs from the following Morningstar (U.S. Fund) categories: Diversified Emerging Mkts, Foreign Large Blend, Foreign Large Growth, Foreign Large Value, Foreign Small/Mid Blend, Foreign Small/Mid Value, Large Blend, Large Growth, Large Value, Mid-Cap Blend, Mid-Cap Growth, Mid-Cap Value, Small Blend, Small Growth, Small Value, World Large Stock. Closed ETFs are included.
With smart beta ETFs, excess returns are just half the story. Risk reduction and control are hugely important in smart beta and factor investing, and they are necessary to account for. So, let’s review excess risk-adjusted return, or alpha. We see a similar story to the excess return chart but with a more positive ending, as the cumulative universe is still positive in recent time frames on a risk-adjusted basis, albeit slightly.
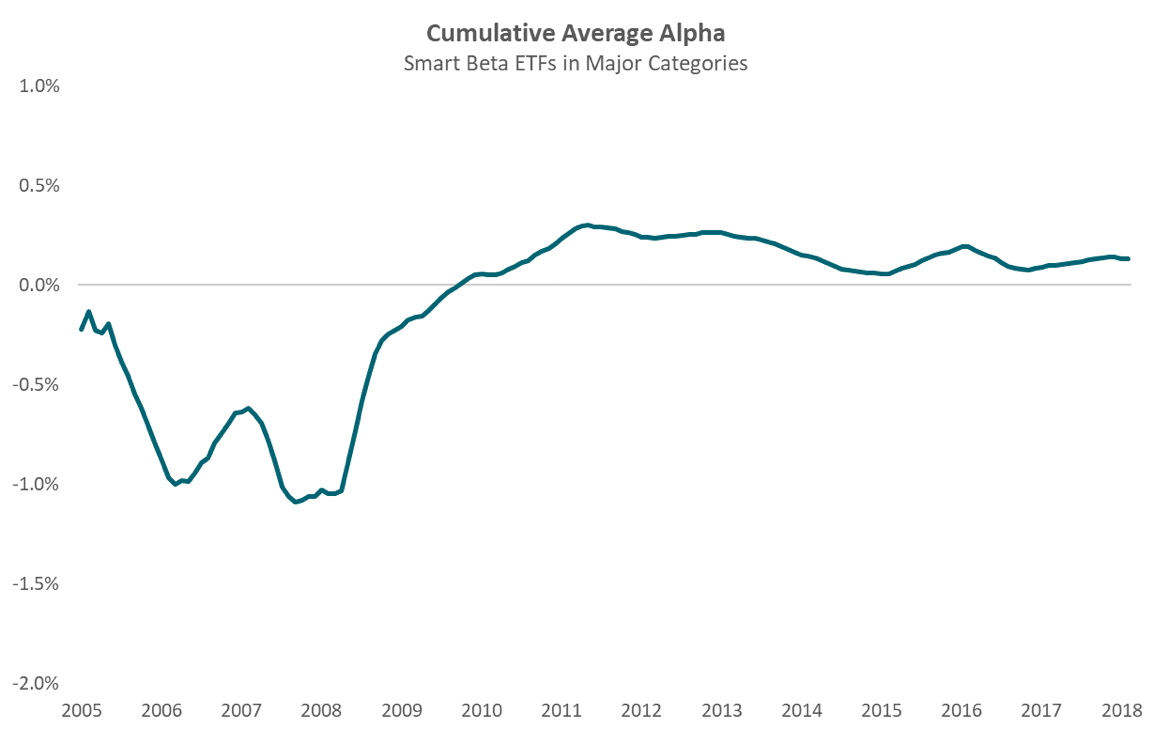
Source: Morningstar. Cumulative average alpha is measured as rolling 12-month alpha versus the applicable Morningstar category index, averaged through time from January 1, 2005, to January 31, 2019. Included are equity smart beta ETFs from the following Morningstar (U.S. Fund) categories: Diversified Emerging Mkts, Foreign Large Blend, Foreign Large Growth, Foreign Large Value, Foreign Small/Mid Blend, Foreign Small/Mid Value, Large Blend, Large Growth, Large Value, Mid-Cap Blend, Mid-Cap Growth, Mid-Cap Value, Small Blend, Small Growth, Small Value, World Large Stock. Closed ETFs are included.