
By Doug Sandler, CFA
SUMMARY
- Money Markets have seen record inflows.
- However, short-term investments carry reinvestment risks, in our view.
- Stock pullback offers buying opportunity for long-term investors, in our opinion.
The Risks of Being ‘Penny-wise and Pound-foolish’
There are only two things hotter than this summer’s record temperatures…Taylor Swift tickets and the demand for short-term investments (see chart below). The latter should come as no surprise given that investors have been starved of yield for over a decade. Yields of 5% or higher on T-Bills, CDs and Money Markets seem compelling, especially after 2022’s losses in the stock and bond markets.
According to the Fed, assets in retail money-market funds hit a record $1.5 trillion, surging more than 25% in 2023 alone!
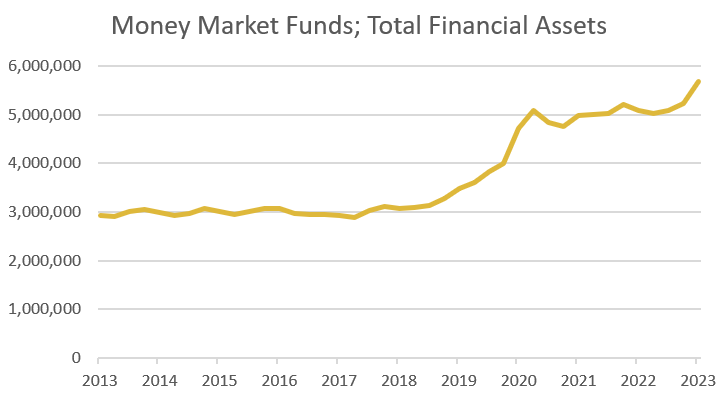
Source: Federal Reserve Economic Data. Data as of 3.31.23. Chart shown for illustrative purposes.
Board of Governors of the Federal Reserve System (US), Money Market Funds; Total Financial Assets, Level [MMMFFAQ027S], retrieved from FRED, Federal Reserve Bank of St. Louis; https://fred.stlouisfed.org/series/MMMFFAQ027S
-
- T-Bills, CDs and Money Markets are not Risk-Free: Short-term investments are, by definition, short-term; meaning they mature in less than one year and often much sooner. At maturity the proceeds will need to be reinvested into an unknown market environment. This makes these types of investments sensitive to the many pitfalls of market timing. One could get lucky, and yields could remain high… or unlucky, if yields are lower and stocks are higher. For this reason, portfolios constructed from T-Bills, CDs and Money Market funds can be like ‘castles in the sand’, whose foundations can quickly erode with small shifts in the tides. Thus, T-Bills, CDs and Money Markets carry the highest reinvestment risk of any asset class, in our view. A significant reallocation of long-term investments (selling stocks or bonds) to short-term investments is a bet that neither stocks nor bonds will rise by more than the return of the short-term investment. In the case of a 6-month CD yielding 5%, that return threshold would be 2.5% (yields are quoted on annualized basis…a 5% 6-month CD will return 2.5% over its lifetime). Given that the S&P 500 has risen at an average annual rate of nearly 10% since 1928, we think this is a bet with a below average chance of paying off over time.
- Purchasing Power Risk: Cash equivalents typically provide returns in-line with inflation and no more. In fact, since 2009, short-term rates have generally remained below the rate of inflation (financial repression). Because of this, short-term investments cannot be relied upon to deliver real (after inflation) growth and therefore have historically been a poor fit for portfolios designed to fund significant expenses like retirement, college funding, and second-home purchases. Absent real growth, we believe investors who overly rely on short-term investments today may be forced to cut back on future plans or take more risk later to catch up.
- Short-term Rates Should Follow Inflation Lower: Today’s high short-term rates have an expiration date because they will only remain high so long as the Fed views inflation as a threat. Whether rates remain high for another six months, one year or more is anybody’s guess. However, the fact remains that as inflation fades, so will short-term interest rates. The chart to the right highlights the long-term relationship between inflation (blue line) and short-term rates (green line). Note from the chart that inflation typically leads T-Bill yields. Given that inflation has fallen for twelve months, we anticipate that short-term rates will ultimately follow inflation lower.
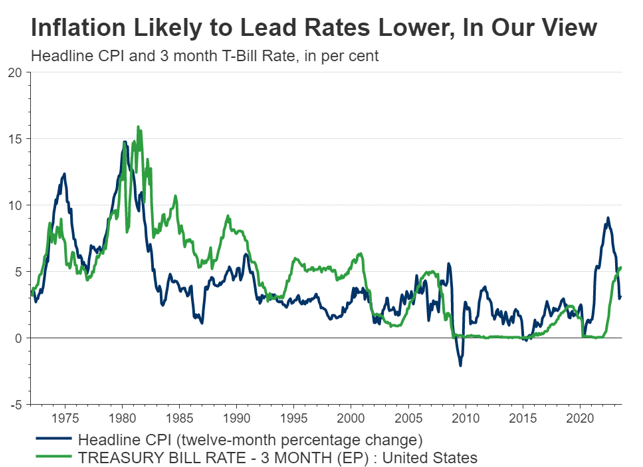
Source: Refinitiv Datastream, RiverFront. Data as of 8.18.23.
4. Equity Bull Markets are Unlikely to End When Investors are Flocking to Short-Term Investments, in our View: Markets often move in the opposite direction of the most popular investment trends. Thus, the reason for one of our three tactical rules: ‘Beware of the Crowd at Extremes’. From the first chart on page one, we can see that money flows into cash and cash equivalents have been significant, which has been surprising, given the strength of 2023’s bull market.
A Reinvestment Plan: Merging into Traffic
Reinvesting into a market that is rising can be like an activity that we are all familiar with: merging into moving traffic. For most of us, the action of merging requires little thought because it has become second nature. However, if we take a minute to examine it, we can identify three important steps that can be applied to the reinvestment process.
- Start Immediately: When you are merging onto the interstate, you start the process immediately by getting up to speed. You do not stop on the entrance ramp to wait for an opening because if you did you would lose all your momentum (and your nerve). Likewise, when reinvesting cash, investors should also start the process immediately, in our view. We do not believe that the secular bull market that began in 2009 is over and therefore do not recommend waiting for a significant pullback before putting a portion of cash to work. In fact, the 5% pullback in the S&P 500 from the July 31st YTD high, in our view, represents an attractive window for reinvestment.
- Allocate Opportunistically: When merging onto the highway, gaps in the traffic will appear as you get up to speed. These gaps provide opportunities to merge more quickly. From a reinvestment perspective, investors can designate a portion of their cash to take advantage of opportunities that may arise from market volatility. Historically, market volatility has been high in September and October, which may provide an opportunity for additional reinvestment. In our view, such a reinvestment window would occur if the market were to decline to between 4,200 and 4,300 on the S&P 500, which would be a 50% retracement of the rally that began in late 2022 and coincides with the top of the S&P 500’s ‘decision box’ highlighted in past publications.
- Complete Gradually: Gradually the merger lane comes to an end, and the driver must complete the merge. Reinvestment windows also come to an end because investors risk missing out on the ‘power of compound interest’ if they fail to reinvest in a timely manner. The recent uptick in estimates for the US economy from the Atlanta Fed and S&P 500 full-year earnings (FactSet) are a reminder that the economy and stock market remain resilient despite the regular doses of worrisome headlines. To offset the risk of bad timing, investors can use a dollar-cost-average approach to gradually reinvest on a series of dates over a defined time-period. Three to six months is probably the appropriate time-period for a long-term investor to reinvest their cash, in our view.
Risk Discussion: All investments in securities, including the strategies discussed above, include a risk of loss of principal (invested amount) and any profits that have not been realized. Markets fluctuate substantially over time, and have experienced increased volatility in recent years due to global and domestic economic events. Performance of any investment is not guaranteed. In a rising interest rate environment, the value of fixed-income securities generally declines. Diversification does not guarantee a profit or protect against a loss. Investments in international and emerging markets securities include exposure to risks such as currency fluctuations, foreign taxes and regulations, and the potential for illiquid markets and political instability. Please see the end of this publication for more disclosures.
Important Disclosure Information:
The comments above refer generally to financial markets and not RiverFront portfolios or any related performance. Opinions expressed are current as of the date shown and are subject to change. Past performance is not indicative of future results and diversification does not ensure a profit or protect against loss. All investments carry some level of risk, including loss of principal. An investment cannot be made directly in an index.
Information or data shown or used in this material was received from sources believed to be reliable, but accuracy is not guaranteed.
This report does not provide recipients with information or advice that is sufficient on which to base an investment decision. This report does not take into account the specific investment objectives, financial situation or need of any particular client and may not be suitable for all types of investors. Recipients should consider the contents of this report as a single factor in making an investment decision. Additional fundamental and other analyses would be required to make an investment decision about any individual security identified in this report.
Chartered Financial Analyst is a professional designation given by the CFA Institute (formerly AIMR) that measures the competence and integrity of financial analysts. Candidates are required to pass three levels of exams covering areas such as accounting, economics, ethics, money management and security analysis. Four years of investment/financial career experience are required before one can become a CFA charterholder. Enrollees in the program must hold a bachelor’s degree.
All charts shown for illustrative purposes only. Technical analysis is based on the study of historical price movements and past trend patterns. There are no assurances that movements or trends can or will be duplicated in the future.
Stocks represent partial ownership of a corporation. If the corporation does well, its value increases, and investors share in the appreciation. However, if it goes bankrupt, or performs poorly, investors can lose their entire initial investment (i.e., the stock price can go to zero). Bonds represent a loan made by an investor to a corporation or government. As such, the investor gets a guaranteed interest rate for a specific period of time and expects to get their original investment back at the end of that time period, along with the interest earned. Investment risk is repayment of the principal (amount invested). In the event of a bankruptcy or other corporate disruption, bonds are senior to stocks. Investors should be aware of these differences prior to investing.
In general, the bond market is volatile, and fixed income securities carry interest rate risk. (As interest rates rise, bond prices usually fall, and vice versa). This effect is usually more pronounced for longer-term securities). Fixed income securities also carry inflation risk, liquidity risk, call risk and credit and default risks for both issuers and counterparties. Lower-quality fixed income securities involve greater risk of default or price changes due to potential changes in the credit quality of the issuer. Foreign investments involve greater risks than U.S. investments, and can decline significantly in response to adverse issuer, political, regulatory, market, and economic risks. Any fixed-income security sold or redeemed prior to maturity may be subject to loss.
Index Definitions: Standard & Poor’s (S&P) 500 Index measures the performance of 500 large cap stocks, which together represent about 80% of the total US equities market.
The Consumer Price Index (CPI) is a measure that examines the weighted average of prices of a basket of consumer goods and services, such as transportation, food, and medical care. It is calculated by taking price changes for each item in the predetermined basket of goods and averaging them. Changes in the CPI are used to assess price changes associated with the cost of living. The CPI is one of the most frequently used statistics for identifying periods of inflation or deflation.
Definitions:
The Federal Reserve System (FRS) is the central bank of the United States. Often simply called the Fed, it is arguably the most powerful financial institution in the world. It was founded to provide the country with a safe, flexible, and stable monetary and financial system. The Fed has a board that is comprised of seven members. There are also 12 Federal Reserve banks with their own presidents that represent a separate district.
Treasury bill (T-Bill) is a short-term U.S. government debt obligation backed by the Treasury Department with a maturity of one year or less. Treasury bills are usually sold in denominations of $1,000. However, some can reach a maximum denomination of $5 million in non-competitive bids. These securities are widely regarded as low-risk and secure investments.
A certificate of deposit (CD) is a savings product that earns interest on a lump sum for a fixed period of time. CDs differ from savings accounts because the money must remain untouched for the entirety of their term or risk penalty fees or lost interest. CDs usually have higher interest rates than savings accounts as an incentive for lost liquidity.
The Money Market refers to trading in very short-term debt investments. At the wholesale level, it involves large-volume trades between institutions and traders. At the retail level, it includes money market mutual funds bought by individual investors and money market accounts opened by bank customers. In all of these cases, the money market is characterized by a high degree of safety and relatively low rates of return.
Financial repression is a term that describes measures by which governments channel funds from the private sector to themselves as a form of debt reduction. The overall policy actions result in the government being able to borrow at extremely low interest rates, obtaining low-cost funding for government expenditures.
Interest rate sensitivity is a measure of how much the price of a fixed-income asset will fluctuate as a result of changes in the interest rate environment. Securities that are more sensitive have greater price fluctuations than those with less sensitivity. This type of sensitivity must be taken into account when selecting a bond or other fixed-income instrument the investor may sell in the secondary market. Interest rate sensitivity affects buying as well as selling.
Beware the Crowd at Extremes – Terms correlate to the NDR Crowd Sentiment Poll and its measurement of Extreme Optimism (Bearish), Neutral, or Extreme Pessimism (Bullish).
RiverFront Investment Group, LLC (“RiverFront”), is a registered investment adviser with the Securities and Exchange Commission. Registration as an investment adviser does not imply any level of skill or expertise. Any discussion of specific securities is provided for informational purposes only and should not be deemed as investment advice or a recommendation to buy or sell any individual security mentioned. RiverFront is affiliated with Robert W. Baird & Co. Incorporated (“Baird”), member FINRA/SIPC, from its minority ownership interest in RiverFront. RiverFront is owned primarily by its employees through RiverFront Investment Holding Group, LLC, the holding company for RiverFront. Baird Financial Corporation (BFC) is a minority owner of RiverFront Investment Holding Group, LLC and therefore an indirect owner of RiverFront. BFC is the parent company of Robert W. Baird & Co. Incorporated, a registered broker/dealer and investment adviser.
To review other risks and more information about RiverFront, please visit the website at riverfrontig.com and the Form ADV, Part 2A. Copyright ©2023 RiverFront Investment Group. All Rights Reserved. ID 3073867
For more news, information, and analysis, visit the ETF Strategist Channel.
